| Multiple Linear Regression - Estimated Regression Equation |
| Y[t] = + 176.905248685416 + 3.04049881808095X[t] + 5.55389550870783M1[t] + 17.0753919629505M2[t] + 24.7482898354962M3[t] + 29.669786289739M4[t] + 35.4641806165276M5[t] + 38.9775773071543M6[t] + 47.2367697428724M7[t] + 45.180071397559M8[t] + 1.51650827343334M9[t] -8.72648463505236M10[t] -13.8292874716581M11[t] + e[t] |
| Multiple Linear Regression - Ordinary Least Squares | |||||
| Variable | Parameter | S.D. | T-STAT H0: parameter = 0 | 2-tail p-value | 1-tail p-value |
| (Intercept) | 176.905248685416 | 11.536304 | 15.3347 | 0 | 0 |
| X | 3.04049881808095 | 0.087246 | 34.8496 | 0 | 0 |
| M1 | 5.55389550870783 | 5.035462 | 1.103 | 0.275662 | 0.137831 |
| M2 | 17.0753919629505 | 5.05944 | 3.375 | 0.001488 | 0.000744 |
| M3 | 24.7482898354962 | 5.08025 | 4.8715 | 1.3e-05 | 6e-06 |
| M4 | 29.669786289739 | 5.125448 | 5.7887 | 1e-06 | 0 |
| M5 | 35.4641806165276 | 5.224295 | 6.7883 | 0 | 0 |
| M6 | 38.9775773071543 | 5.296415 | 7.3592 | 0 | 0 |
| M7 | 47.2367697428724 | 5.498591 | 8.5907 | 0 | 0 |
| M8 | 45.180071397559 | 5.450119 | 8.2897 | 0 | 0 |
| M9 | 1.51650827343334 | 5.061516 | 0.2996 | 0.765792 | 0.382896 |
| M10 | -8.72648463505236 | 5.150959 | -1.6941 | 0.096855 | 0.048427 |
| M11 | -13.8292874716581 | 5.108937 | -2.7069 | 0.009438 | 0.004719 |
| Multiple Linear Regression - Regression Statistics | |
| Multiple R | 0.985073814323171 |
| R-squared | 0.970370419665202 |
| Adjusted R-squared | 0.962805420430785 |
| F-TEST (value) | 128.271053254117 |
| F-TEST (DF numerator) | 12 |
| F-TEST (DF denominator) | 47 |
| p-value | 0 |
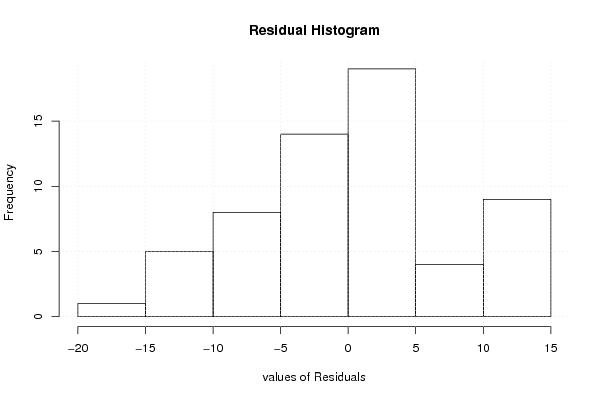
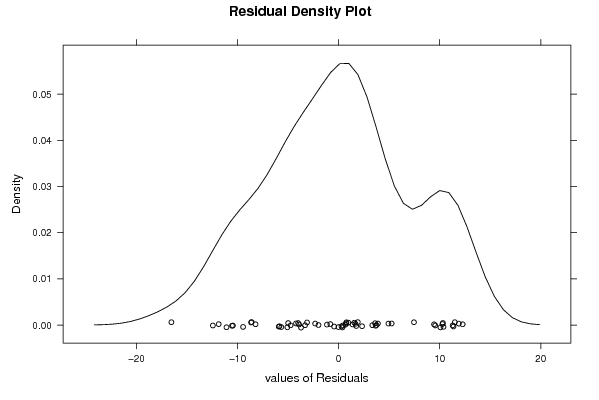
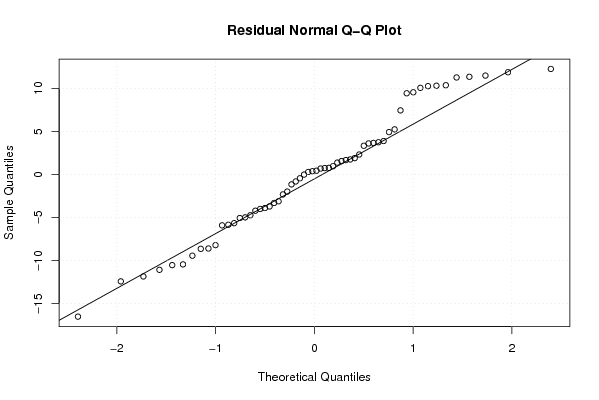
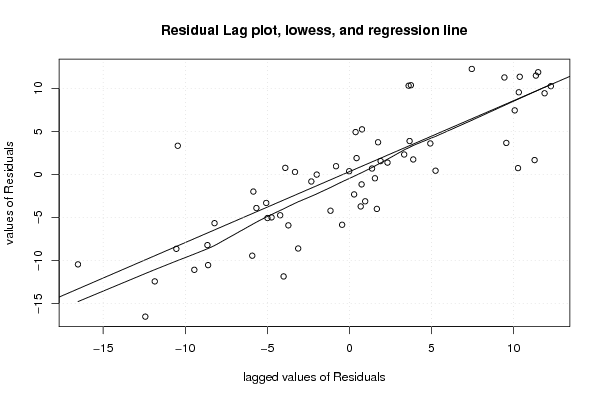
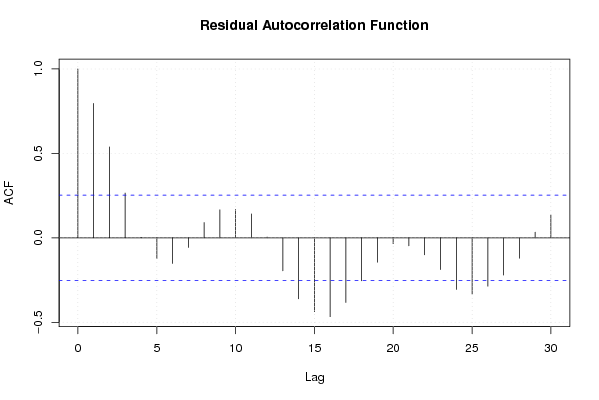
| Multiple Linear Regression - Residual Statistics | |
| Residual Standard Deviation | 7.94448891931475 |
| Sum Squared Residuals | 2966.40049688840 |
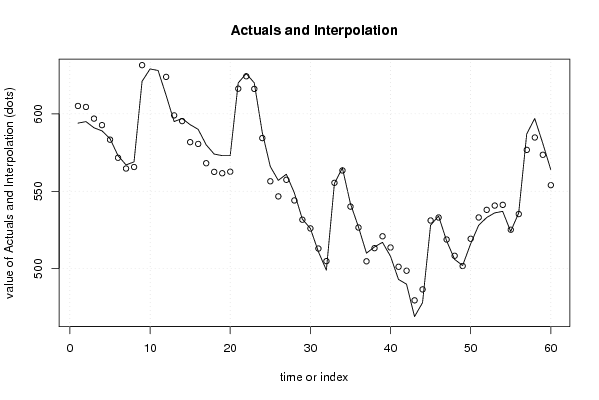
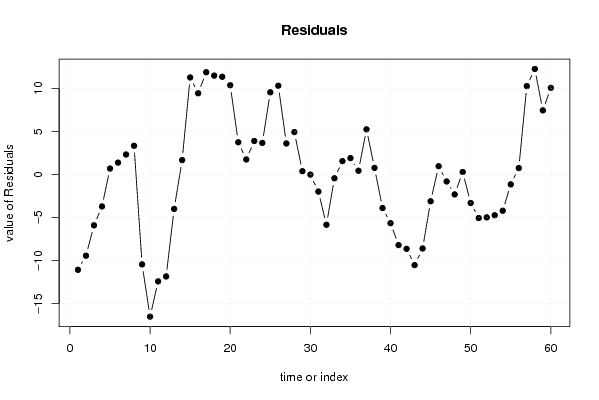
| Multiple Linear Regression - Actuals, Interpolation, and Residuals | |||
| Time or Index | Actuals | Interpolation Forecast | Residuals Prediction Error |
| 1 | 594 | 605.088479907375 | -11.0884799073753 |
| 2 | 595 | 604.447981089295 | -9.4479810892953 |
| 3 | 591 | 596.918384871436 | -5.91838487143616 |
| 4 | 589 | 592.718384871436 | -3.71838487143619 |
| 5 | 584 | 583.31028510782 | 0.689714892180035 |
| 6 | 573 | 571.621187708042 | 1.37881229195811 |
| 7 | 567 | 564.677886053355 | 2.32211394664476 |
| 8 | 569 | 565.661686526123 | 3.33831347387716 |
| 9 | 621 | 631.456080852911 | -10.4560808529114 |
| 10 | 629 | 645.537078489073 | -16.5370784890733 |
| 11 | 628 | 640.434275652468 | -12.4342756524676 |
| 12 | 612 | 623.858574943316 | -11.8585749433162 |
| 13 | 595 | 599.007482271214 | -4.00748227121449 |
| 14 | 597 | 595.326484635052 | 1.67351536494766 |
| 15 | 593 | 581.715890781031 | 11.2841092189686 |
| 16 | 590 | 580.556389599112 | 9.44361040088764 |
| 17 | 580 | 568.107791017415 | 11.8922089825848 |
| 18 | 574 | 562.499691253799 | 11.5003087462010 |
| 19 | 573 | 561.637387235274 | 11.3626127647257 |
| 20 | 573 | 562.621187708042 | 10.3788122919581 |
| 21 | 620 | 616.253586762507 | 3.74641323749335 |
| 22 | 626 | 624.253586762507 | 1.74641323749335 |
| 23 | 620 | 616.11028510782 | 3.88971489218002 |
| 24 | 588 | 584.332090308264 | 3.6679096917362 |
| 25 | 566 | 556.440498818081 | 9.55950118191883 |
| 26 | 557 | 546.678503545757 | 10.3214964542429 |
| 27 | 561 | 557.391900236384 | 3.60809976361619 |
| 28 | 549 | 544.070403782141 | 4.92959621785904 |
| 29 | 532 | 531.621805200444 | 0.378194799556179 |
| 30 | 526 | 526.013705436828 | -0.0137054368276273 |
| 31 | 511 | 512.989406145979 | -1.98940614597905 |
| 32 | 499 | 504.851710164504 | -5.85171016450381 |
| 33 | 555 | 555.443610400888 | -0.443610400887622 |
| 34 | 565 | 563.443610400888 | 1.55638959911237 |
| 35 | 542 | 540.097814655796 | 1.90218534420379 |
| 36 | 527 | 526.562612764726 | 0.43738723527428 |
| 37 | 510 | 504.752018910705 | 5.247981089295 |
| 38 | 514 | 513.233016546867 | 0.766983453133338 |
| 39 | 517 | 520.905914419412 | -3.9059144194124 |
| 40 | 508 | 513.665415601331 | -5.66541560133144 |
| 41 | 493 | 501.216817019634 | -8.2168170196343 |
| 42 | 490 | 498.649216074099 | -8.64921607409907 |
| 43 | 469 | 479.543919147089 | -10.5439191470886 |
| 44 | 478 | 486.608717256018 | -8.6087172560181 |
| 45 | 528 | 531.11961985624 | -3.11961985624001 |
| 46 | 534 | 533.038622220078 | 0.961377779921877 |
| 47 | 518 | 518.81432292923 | -0.814322929229542 |
| 48 | 506 | 508.31961985624 | -2.31961985624002 |
| 49 | 502 | 501.711520092624 | 0.288479907375944 |
| 50 | 516 | 519.314014183029 | -3.31401418302857 |
| 51 | 528 | 533.067909691736 | -5.0679096917362 |
| 52 | 533 | 537.989406145979 | -4.98940614597904 |
| 53 | 536 | 540.743301654687 | -4.74330165468667 |
| 54 | 537 | 541.216199527232 | -4.21619952723238 |
| 55 | 524 | 525.151401418303 | -1.15140141830285 |
| 56 | 536 | 535.256698345313 | 0.743301654686659 |
| 57 | 587 | 576.727102127454 | 10.2728978725457 |
| 58 | 597 | 584.727102127454 | 12.2728978725457 |
| 59 | 581 | 573.543301654687 | 7.45669834531333 |
| 60 | 564 | 553.927102127454 | 10.0728978725457 |
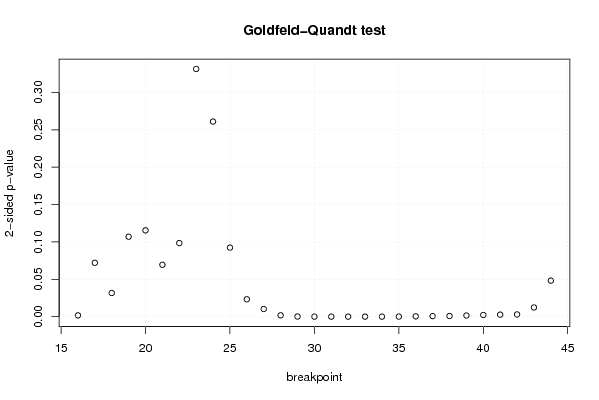
| Goldfeld-Quandt test for Heteroskedasticity | |||
| p-values | Alternative Hypothesis | ||
| breakpoint index | greater | 2-sided | less |
| 16 | 0.000860697409510995 | 0.00172139481902199 | 0.99913930259049 |
| 17 | 0.0360528531048604 | 0.0721057062097209 | 0.96394714689514 |
| 18 | 0.0158405863107176 | 0.0316811726214353 | 0.984159413689282 |
| 19 | 0.0534852782521301 | 0.106970556504260 | 0.94651472174787 |
| 20 | 0.0577461666612851 | 0.115492333322570 | 0.942253833338715 |
| 21 | 0.0347221019332266 | 0.0694442038664532 | 0.965277898066773 |
| 22 | 0.0492381726962248 | 0.0984763453924497 | 0.950761827303775 |
| 23 | 0.165710813303324 | 0.331421626606648 | 0.834289186696676 |
| 24 | 0.869487035671714 | 0.261025928656572 | 0.130512964328286 |
| 25 | 0.953801574800654 | 0.0923968503986923 | 0.0461984251993462 |
| 26 | 0.9883610555523 | 0.0232778888953979 | 0.0116389444476989 |
| 27 | 0.994872268628226 | 0.0102554627435484 | 0.00512773137177421 |
| 28 | 0.999083447555212 | 0.00183310488957613 | 0.000916552444788067 |
| 29 | 0.9998897938836 | 0.000220412232801428 | 0.000110206116400714 |
| 30 | 0.99996935822558 | 6.12835488412234e-05 | 3.06417744206117e-05 |
| 31 | 0.999977840033939 | 4.43199321225238e-05 | 2.21599660612619e-05 |
| 32 | 0.999980275944666 | 3.94481106685859e-05 | 1.97240553342929e-05 |
| 33 | 0.999967889846978 | 6.42203060430797e-05 | 3.21101530215398e-05 |
| 34 | 0.999976234162866 | 4.75316742689485e-05 | 2.37658371344742e-05 |
| 35 | 0.999916232155737 | 0.000167535688525462 | 8.37678442627312e-05 |
| 36 | 0.99979054190154 | 0.000418916196919673 | 0.000209458098459837 |
| 37 | 0.999634198141887 | 0.000731603716226991 | 0.000365801858113495 |
| 38 | 0.9995683873176 | 0.000863225364799476 | 0.000431612682399738 |
| 39 | 0.999230412667315 | 0.00153917466537052 | 0.00076958733268526 |
| 40 | 0.99885311059875 | 0.00229377880250047 | 0.00114688940125023 |
| 41 | 0.998620551714781 | 0.00275889657043808 | 0.00137944828521904 |
| 42 | 0.9985015228922 | 0.00299695421559741 | 0.00149847710779870 |
| 43 | 0.993847317749444 | 0.0123053645011117 | 0.00615268225055586 |
| 44 | 0.97587868470241 | 0.0482426305951816 | 0.0241213152975908 |
| Meta Analysis of Goldfeld-Quandt test for Heteroskedasticity | |||
| Description | # significant tests | % significant tests | OK/NOK |
| 1% type I error level | 16 | 0.551724137931034 | NOK |
| 5% type I error level | 21 | 0.724137931034483 | NOK |
| 10% type I error level | 25 | 0.862068965517241 | NOK |