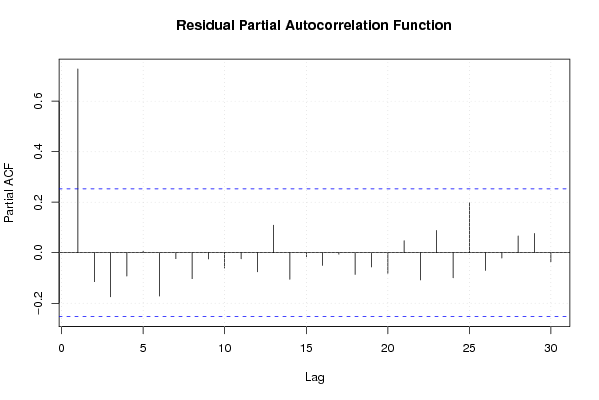
| Multiple Linear Regression - Estimated Regression Equation |
| Y[t] = + 22.3375 -13.9750000000000X[t] -3.74465277777777M1[t] -3.5551388888889M2[t] -3.68562499999999M3[t] -3.7561111111111M4[t] -3.56659722222222M5[t] -3.17708333333333M6[t] -2.70756944444444M7[t] -2.33805555555555M8[t] -1.76854166666666M9[t] -1.09902777777777M10[t] -0.409513888888884M11[t] -0.00951388888888879t + e[t] |
| Multiple Linear Regression - Ordinary Least Squares | |||||
| Variable | Parameter | S.D. | T-STAT H0: parameter = 0 | 2-tail p-value | 1-tail p-value |
| (Intercept) | 22.3375 | 2.419346 | 9.2329 | 0 | 0 |
| X | -13.9750000000000 | 1.728104 | -8.0869 | 0 | 0 |
| M1 | -3.74465277777777 | 2.436089 | -1.5372 | 0.131105 | 0.065553 |
| M2 | -3.5551388888889 | 2.428928 | -1.4637 | 0.150086 | 0.075043 |
| M3 | -3.68562499999999 | 2.42243 | -1.5215 | 0.13499 | 0.067495 |
| M4 | -3.7561111111111 | 2.416602 | -1.5543 | 0.126968 | 0.063484 |
| M5 | -3.56659722222222 | 2.411447 | -1.479 | 0.145949 | 0.072974 |
| M6 | -3.17708333333333 | 2.406971 | -1.32 | 0.193383 | 0.096691 |
| M7 | -2.70756944444444 | 2.403177 | -1.1267 | 0.265728 | 0.132864 |
| M8 | -2.33805555555555 | 2.400068 | -0.9742 | 0.335071 | 0.167536 |
| M9 | -1.76854166666666 | 2.397648 | -0.7376 | 0.464494 | 0.232247 |
| M10 | -1.09902777777777 | 2.395917 | -0.4587 | 0.648603 | 0.324302 |
| M11 | -0.409513888888884 | 2.394878 | -0.171 | 0.864977 | 0.432489 |
| t | -0.00951388888888879 | 0.040732 | -0.2336 | 0.816352 | 0.408176 |
| Multiple Linear Regression - Regression Statistics | |
| Multiple R | 0.861444261613593 |
| R-squared | 0.742086215866989 |
| Adjusted R-squared | 0.669197537742442 |
| F-TEST (value) | 10.1810903278966 |
| F-TEST (DF numerator) | 13 |
| F-TEST (DF denominator) | 46 |
| p-value | 1.34445365951308e-09 |
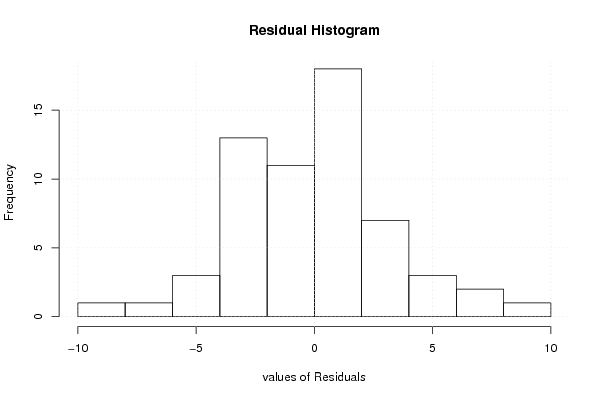
| Multiple Linear Regression - Residual Statistics | |
| Residual Standard Deviation | 3.78608699188819 |
| Sum Squared Residuals | 659.384916666667 |
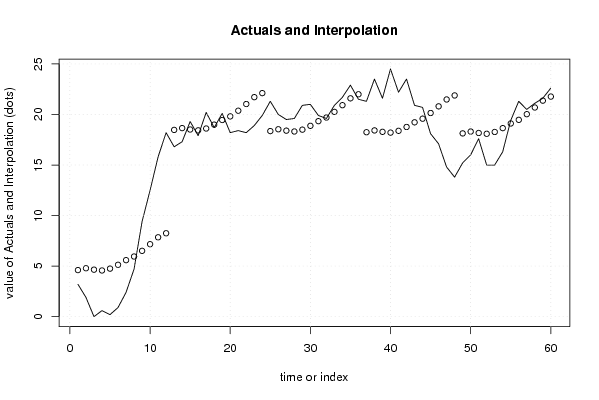
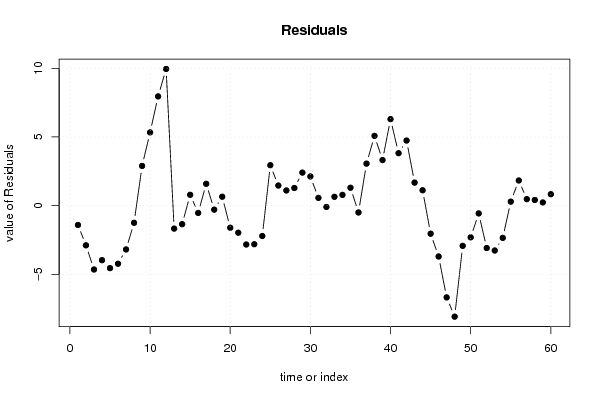
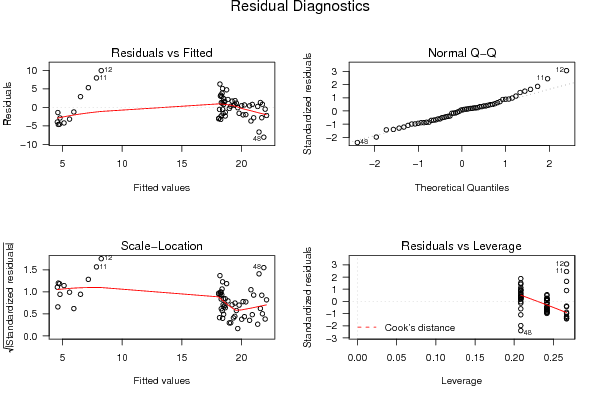
| Multiple Linear Regression - Actuals, Interpolation, and Residuals | |||
| Time or Index | Actuals | Interpolation Forecast | Residuals Prediction Error |
| 1 | 3.2 | 4.60833333333334 | -1.40833333333334 |
| 2 | 1.9 | 4.78833333333339 | -2.88833333333339 |
| 3 | 0 | 4.64833333333333 | -4.64833333333333 |
| 4 | 0.6 | 4.56833333333332 | -3.96833333333332 |
| 5 | 0.2 | 4.74833333333334 | -4.54833333333334 |
| 6 | 0.9 | 5.12833333333333 | -4.22833333333333 |
| 7 | 2.4 | 5.58833333333333 | -3.18833333333333 |
| 8 | 4.7 | 5.94833333333333 | -1.24833333333333 |
| 9 | 9.4 | 6.50833333333332 | 2.89166666666668 |
| 10 | 12.5 | 7.16833333333332 | 5.33166666666668 |
| 11 | 15.8 | 7.84833333333333 | 7.95166666666667 |
| 12 | 18.2 | 8.24833333333333 | 9.95166666666667 |
| 13 | 16.8 | 18.4691666666667 | -1.66916666666667 |
| 14 | 17.3 | 18.6491666666666 | -1.34916666666665 |
| 15 | 19.3 | 18.5091666666667 | 0.790833333333333 |
| 16 | 17.9 | 18.4291666666667 | -0.529166666666668 |
| 17 | 20.2 | 18.6091666666667 | 1.59083333333333 |
| 18 | 18.7 | 18.9891666666667 | -0.289166666666666 |
| 19 | 20.1 | 19.4491666666667 | 0.650833333333336 |
| 20 | 18.2 | 19.8091666666667 | -1.60916666666667 |
| 21 | 18.4 | 20.3691666666667 | -1.96916666666667 |
| 22 | 18.2 | 21.0291666666667 | -2.82916666666667 |
| 23 | 18.9 | 21.7091666666667 | -2.80916666666667 |
| 24 | 19.9 | 22.1091666666667 | -2.20916666666666 |
| 25 | 21.3 | 18.355 | 2.94500000000001 |
| 26 | 20 | 18.535 | 1.46500000000001 |
| 27 | 19.5 | 18.395 | 1.10500000000000 |
| 28 | 19.6 | 18.315 | 1.285 |
| 29 | 20.9 | 18.495 | 2.405 |
| 30 | 21 | 18.875 | 2.125 |
| 31 | 19.9 | 19.335 | 0.564999999999999 |
| 32 | 19.6 | 19.695 | -0.0950000000000018 |
| 33 | 20.9 | 20.255 | 0.644999999999995 |
| 34 | 21.7 | 20.915 | 0.785 |
| 35 | 22.9 | 21.595 | 1.30500000000000 |
| 36 | 21.5 | 21.995 | -0.494999999999995 |
| 37 | 21.3 | 18.2408333333333 | 3.05916666666667 |
| 38 | 23.5 | 18.4208333333333 | 5.07916666666668 |
| 39 | 21.6 | 18.2808333333333 | 3.31916666666667 |
| 40 | 24.5 | 18.2008333333333 | 6.29916666666666 |
| 41 | 22.2 | 18.3808333333333 | 3.81916666666666 |
| 42 | 23.5 | 18.7608333333333 | 4.73916666666666 |
| 43 | 20.9 | 19.2208333333333 | 1.67916666666666 |
| 44 | 20.7 | 19.5808333333333 | 1.11916666666666 |
| 45 | 18.1 | 20.1408333333333 | -2.04083333333334 |
| 46 | 17.1 | 20.8008333333333 | -3.70083333333333 |
| 47 | 14.8 | 21.4808333333333 | -6.68083333333333 |
| 48 | 13.8 | 21.8808333333333 | -8.08083333333333 |
| 49 | 15.2 | 18.1266666666667 | -2.92666666666666 |
| 50 | 16 | 18.3066666666667 | -2.30666666666665 |
| 51 | 17.6 | 18.1666666666667 | -0.56666666666667 |
| 52 | 15 | 18.0866666666667 | -3.08666666666667 |
| 53 | 15 | 18.2666666666667 | -3.26666666666667 |
| 54 | 16.3 | 18.6466666666667 | -2.34666666666667 |
| 55 | 19.4 | 19.1066666666667 | 0.293333333333328 |
| 56 | 21.3 | 19.4666666666667 | 1.83333333333333 |
| 57 | 20.5 | 20.0266666666667 | 0.473333333333327 |
| 58 | 21.1 | 20.6866666666667 | 0.413333333333332 |
| 59 | 21.6 | 21.3666666666667 | 0.23333333333333 |
| 60 | 22.6 | 21.7666666666667 | 0.833333333333337 |
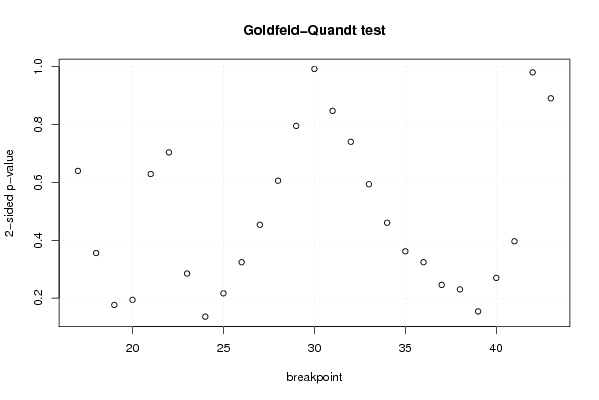
| Goldfeld-Quandt test for Heteroskedasticity | |||
| p-values | Alternative Hypothesis | ||
| breakpoint index | greater | 2-sided | less |
| 17 | 0.319889340886216 | 0.639778681772432 | 0.680110659113784 |
| 18 | 0.177940186246123 | 0.355880372492246 | 0.822059813753877 |
| 19 | 0.088241980979888 | 0.176483961959776 | 0.911758019020112 |
| 20 | 0.097082375383511 | 0.194164750767022 | 0.902917624616489 |
| 21 | 0.314467041954394 | 0.628934083908787 | 0.685532958045606 |
| 22 | 0.648144879440964 | 0.703710241118072 | 0.351855120559036 |
| 23 | 0.857446901403578 | 0.285106197192844 | 0.142553098596422 |
| 24 | 0.932013297320297 | 0.135973405359407 | 0.0679867026797034 |
| 25 | 0.891683310985233 | 0.216633378029534 | 0.108316689014767 |
| 26 | 0.837951911957306 | 0.324096176085387 | 0.162048088042694 |
| 27 | 0.773214034413403 | 0.453571931173195 | 0.226785965586597 |
| 28 | 0.697022874256605 | 0.60595425148679 | 0.302977125743395 |
| 29 | 0.602306372782839 | 0.795387254434322 | 0.397693627217161 |
| 30 | 0.503917133259012 | 0.992165733481975 | 0.496082866740988 |
| 31 | 0.423681240853355 | 0.84736248170671 | 0.576318759146645 |
| 32 | 0.370179707055941 | 0.740359414111882 | 0.629820292944059 |
| 33 | 0.29685531480772 | 0.59371062961544 | 0.70314468519228 |
| 34 | 0.230257646703722 | 0.460515293407444 | 0.769742353296278 |
| 35 | 0.180962161940826 | 0.361924323881652 | 0.819037838059174 |
| 36 | 0.162121439095389 | 0.324242878190779 | 0.83787856090461 |
| 37 | 0.122905959573888 | 0.245811919147776 | 0.877094040426112 |
| 38 | 0.115090654643211 | 0.230181309286423 | 0.884909345356789 |
| 39 | 0.0771060619693304 | 0.154212123938661 | 0.92289393803067 |
| 40 | 0.134969867950607 | 0.269939735901215 | 0.865030132049393 |
| 41 | 0.198297993767694 | 0.396595987535389 | 0.801702006232306 |
| 42 | 0.490224898908752 | 0.980449797817504 | 0.509775101091248 |
| 43 | 0.55465462522032 | 0.890690749559361 | 0.445345374779681 |
| Meta Analysis of Goldfeld-Quandt test for Heteroskedasticity | |||
| Description | # significant tests | % significant tests | OK/NOK |
| 1% type I error level | 0 | 0 | OK |
| 5% type I error level | 0 | 0 | OK |
| 10% type I error level | 0 | 0 | OK |