| Multiple Linear Regression - Estimated Regression Equation |
| Y[t] = -521.125044123331 + 43.9247300401469X[t] + 0.267607684713609Y1[t] + 0.353647238620865Y2[t] + 0.0424752602074008Y3[t] + 0.087865010872984Y4[t] + 127.551804826609M1[t] -192.613937113397M2[t] + 225.212618383627M3[t] + 443.735103798471M4[t] + 133.326151066841M5[t] + 512.431188452368M6[t] + 188.750160570144M7[t] + 228.369322244913M8[t] + 514.605578151214M9[t] -216.103454805878M10[t] -264.768073178073M11[t] + 1.7513226111489t + e[t] |
| Multiple Linear Regression - Ordinary Least Squares | |||||
| Variable | Parameter | S.D. | T-STAT H0: parameter = 0 | 2-tail p-value | 1-tail p-value |
| (Intercept) | -521.125044123331 | 784.363785 | -0.6644 | 0.510349 | 0.255174 |
| X | 43.9247300401469 | 28.009469 | 1.5682 | 0.124911 | 0.062456 |
| Y1 | 0.267607684713609 | 0.157588 | 1.6982 | 0.097446 | 0.048723 |
| Y2 | 0.353647238620865 | 0.165713 | 2.1341 | 0.039178 | 0.019589 |
| Y3 | 0.0424752602074008 | 0.166763 | 0.2547 | 0.80029 | 0.400145 |
| Y4 | 0.087865010872984 | 0.161445 | 0.5442 | 0.589374 | 0.294687 |
| M1 | 127.551804826609 | 191.769338 | 0.6651 | 0.509881 | 0.25494 |
| M2 | -192.613937113397 | 216.309642 | -0.8905 | 0.378682 | 0.189341 |
| M3 | 225.212618383627 | 206.89073 | 1.0886 | 0.28303 | 0.141515 |
| M4 | 443.735103798471 | 212.273282 | 2.0904 | 0.043149 | 0.021575 |
| M5 | 133.326151066841 | 252.330248 | 0.5284 | 0.60023 | 0.300115 |
| M6 | 512.431188452368 | 246.67126 | 2.0774 | 0.044398 | 0.022199 |
| M7 | 188.750160570144 | 241.791598 | 0.7806 | 0.439732 | 0.219866 |
| M8 | 228.369322244913 | 254.534876 | 0.8972 | 0.375116 | 0.187558 |
| M9 | 514.605578151214 | 236.685299 | 2.1742 | 0.03582 | 0.01791 |
| M10 | -216.103454805878 | 201.719321 | -1.0713 | 0.290616 | 0.145308 |
| M11 | -264.768073178073 | 185.609993 | -1.4265 | 0.161688 | 0.080844 |
| t | 1.7513226111489 | 2.688302 | 0.6515 | 0.51857 | 0.259285 |
| Multiple Linear Regression - Regression Statistics | |
| Multiple R | 0.829733555062557 |
| R-squared | 0.688457772396749 |
| Adjusted R-squared | 0.552657314210717 |
| F-TEST (value) | 5.06962775820413 |
| F-TEST (DF numerator) | 17 |
| F-TEST (DF denominator) | 39 |
| p-value | 1.38179662922955e-05 |
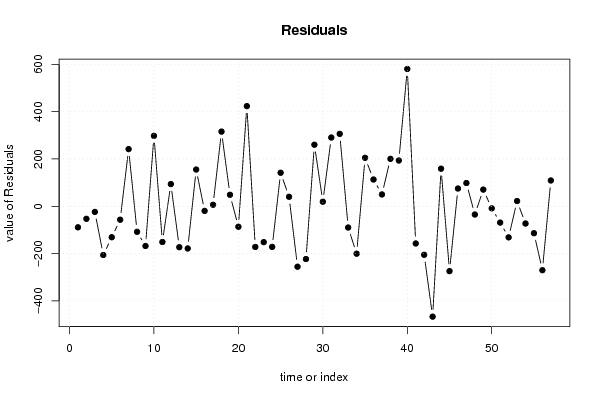
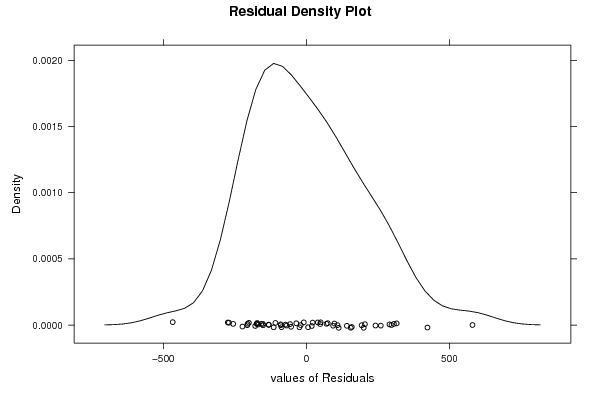
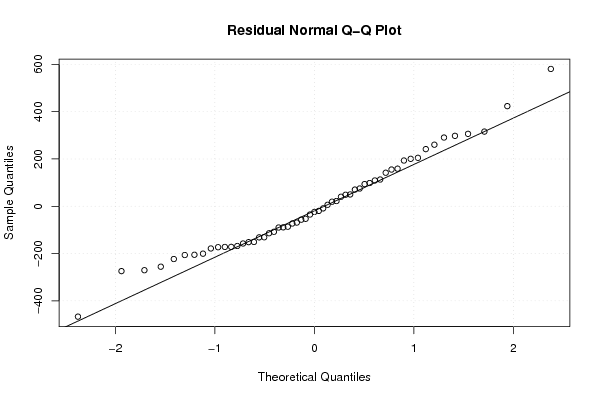
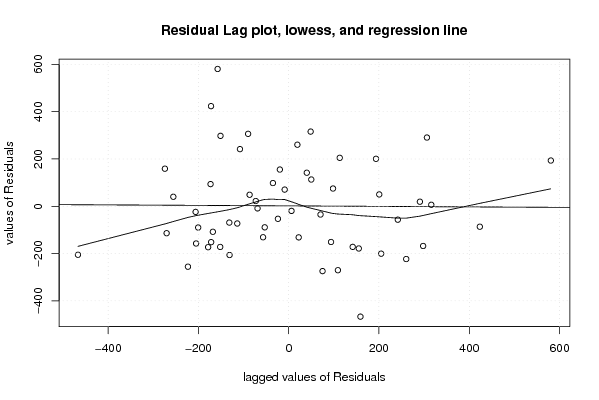
| Multiple Linear Regression - Residual Statistics | |
| Residual Standard Deviation | 236.799134179636 |
| Sum Squared Residuals | 2186879.36798078 |
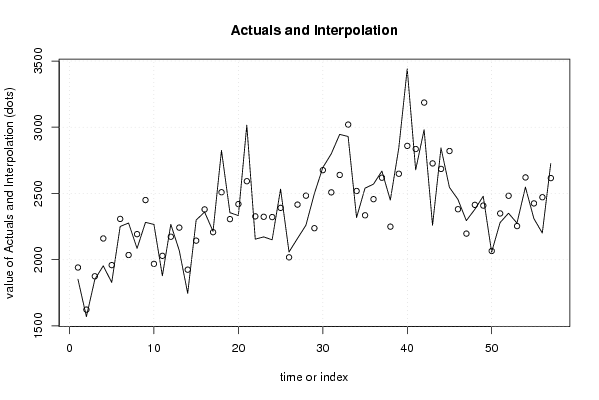
| Multiple Linear Regression - Actuals, Interpolation, and Residuals | |||
| Time or Index | Actuals | Interpolation Forecast | Residuals Prediction Error |
| 1 | 1852 | 1941.05180079232 | -89.0518007923169 |
| 2 | 1570 | 1623.12094946266 | -53.1209494626560 |
| 3 | 1851 | 1874.89315302571 | -23.8931530257124 |
| 4 | 1954 | 2160.25021167375 | -206.250211673746 |
| 5 | 1828 | 1959.08061013037 | -131.080610130366 |
| 6 | 2251 | 2307.8393174631 | -56.8393174631012 |
| 7 | 2277 | 2035.29592757216 | 241.704072427837 |
| 8 | 2085 | 2192.9904768909 | -107.990476890899 |
| 9 | 2282 | 2450.08072484923 | -168.080724849227 |
| 10 | 2266 | 1968.22883814607 | 297.771161853927 |
| 11 | 1878 | 2029.14876880496 | -151.148768804957 |
| 12 | 2267 | 2173.28309827660 | 93.7169017234037 |
| 13 | 2069 | 2242.17555942156 | -173.175559421565 |
| 14 | 1746 | 1924.57025814827 | -178.57025814827 |
| 15 | 2299 | 2143.76511482489 | 155.234885175112 |
| 16 | 2360 | 2379.64257209135 | -19.6425720913465 |
| 17 | 2214 | 2207.83442245575 | 6.16557754425473 |
| 18 | 2825 | 2509.19881337064 | 315.801186629365 |
| 19 | 2355 | 2306.40051846619 | 48.5994815338065 |
| 20 | 2333 | 2419.66233939098 | -86.6623393909767 |
| 21 | 3016 | 2592.59716913233 | 423.402830867667 |
| 22 | 2155 | 2327.12085177489 | -172.120851774893 |
| 23 | 2172 | 2323.77943368687 | -151.779433686865 |
| 24 | 2150 | 2321.82793315012 | -171.827933150117 |
| 25 | 2533 | 2391.23931089213 | 141.760689107873 |
| 26 | 2058 | 2017.93665955256 | 40.0633404474396 |
| 27 | 2160 | 2415.65971824574 | -255.659718245736 |
| 28 | 2260 | 2483.22722816375 | -223.227228163747 |
| 29 | 2498 | 2237.70151640775 | 260.298483592253 |
| 30 | 2695 | 2675.81735260082 | 19.1826473991786 |
| 31 | 2799 | 2508.37663414389 | 290.623365856107 |
| 32 | 2946 | 2639.78759864091 | 306.212401359092 |
| 33 | 2930 | 3019.99489946441 | -89.9948994644116 |
| 34 | 2318 | 2518.59747258839 | -200.597472588395 |
| 35 | 2540 | 2335.20163436202 | 204.798365637976 |
| 36 | 2570 | 2456.93437855671 | 113.065621443293 |
| 37 | 2669 | 2619.01988606472 | 49.9801139352799 |
| 38 | 2450 | 2249.43943575277 | 200.560564247234 |
| 39 | 2842 | 2648.63270573609 | 193.367294263910 |
| 40 | 3440 | 2859.27625195842 | 580.723748041577 |
| 41 | 2678 | 2835.49686991502 | -157.496869915020 |
| 42 | 2981 | 3186.18530344320 | -205.185303443204 |
| 43 | 2260 | 2726.91987466946 | -466.919874669459 |
| 44 | 2844 | 2685.10756778693 | 158.892432213067 |
| 45 | 2546 | 2820.31524068911 | -274.315240689115 |
| 46 | 2456 | 2381.05283749064 | 74.947162509361 |
| 47 | 2295 | 2196.87016314615 | 98.1298368538463 |
| 48 | 2379 | 2413.95459001658 | -34.9545900165796 |
| 49 | 2479 | 2408.51344282927 | 70.486557170729 |
| 50 | 2057 | 2065.93269708375 | -8.93269708374724 |
| 51 | 2280 | 2349.04930816757 | -69.0493081675735 |
| 52 | 2351 | 2482.60373611274 | -131.603736112738 |
| 53 | 2276 | 2253.88658109112 | 22.1134189088789 |
| 54 | 2548 | 2620.95921312224 | -72.9592131222383 |
| 55 | 2311 | 2425.00704514829 | -114.007045148292 |
| 56 | 2201 | 2471.45201729028 | -270.452017290284 |
| 57 | 2725 | 2616.01196586491 | 108.988034135087 |
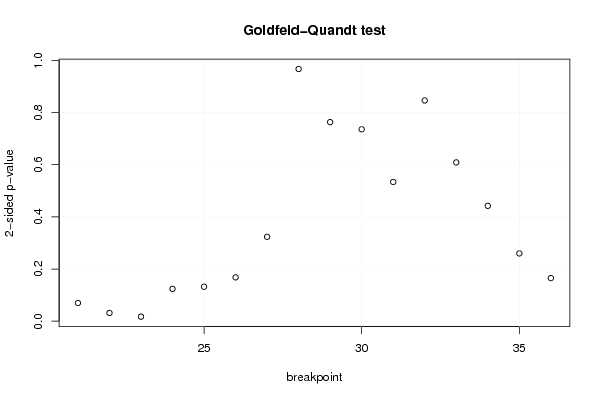
| Goldfeld-Quandt test for Heteroskedasticity | |||
| p-values | Alternative Hypothesis | ||
| breakpoint index | greater | 2-sided | less |
| 21 | 0.0348206650068658 | 0.0696413300137317 | 0.965179334993134 |
| 22 | 0.0157730294774870 | 0.0315460589549739 | 0.984226970522513 |
| 23 | 0.00866032903329128 | 0.0173206580665826 | 0.991339670966709 |
| 24 | 0.0618712431454521 | 0.123742486290904 | 0.938128756854548 |
| 25 | 0.0660615882920617 | 0.132123176584123 | 0.933938411707938 |
| 26 | 0.0839843593911774 | 0.167968718782355 | 0.916015640608823 |
| 27 | 0.161759277948584 | 0.323518555897168 | 0.838240722051416 |
| 28 | 0.483453699831766 | 0.966907399663533 | 0.516546300168234 |
| 29 | 0.381526812375684 | 0.763053624751368 | 0.618473187624316 |
| 30 | 0.367802762265659 | 0.735605524531318 | 0.632197237734341 |
| 31 | 0.266823536731103 | 0.533647073462206 | 0.733176463268897 |
| 32 | 0.423011514030045 | 0.84602302806009 | 0.576988485969955 |
| 33 | 0.304326357066636 | 0.608652714133272 | 0.695673642933364 |
| 34 | 0.221128255572386 | 0.442256511144772 | 0.778871744427614 |
| 35 | 0.129905005527964 | 0.259810011055928 | 0.870094994472036 |
| 36 | 0.0826144141416389 | 0.165228828283278 | 0.917385585858361 |
| Meta Analysis of Goldfeld-Quandt test for Heteroskedasticity | |||
| Description | # significant tests | % significant tests | OK/NOK |
| 1% type I error level | 0 | 0 | OK |
| 5% type I error level | 2 | 0.125 | NOK |
| 10% type I error level | 3 | 0.1875 | NOK |