| Multiple Linear Regression - Estimated Regression Equation |
| Yt[t] = + 616.551900582166 + 7.38444103238997X[t] -1.95296039659737t + e[t] |
| Multiple Linear Regression - Ordinary Least Squares | |||||
| Variable | Parameter | S.D. | T-STAT H0: parameter = 0 | 2-tail p-value | 1-tail p-value |
| (Intercept) | 616.551900582166 | 8.113104 | 75.9946 | 0 | 0 |
| X | 7.38444103238997 | 12.282856 | 0.6012 | 0.55005 | 0.275025 |
| t | -1.95296039659737 | 0.29336 | -6.6572 | 0 | 0 |
| Multiple Linear Regression - Regression Statistics | |
| Multiple R | 0.766800045961603 |
| R-squared | 0.587982310486717 |
| Adjusted R-squared | 0.573774803951776 |
| F-TEST (value) | 41.3853274704243 |
| F-TEST (DF numerator) | 2 |
| F-TEST (DF denominator) | 58 |
| p-value | 6.80078215964386e-12 |
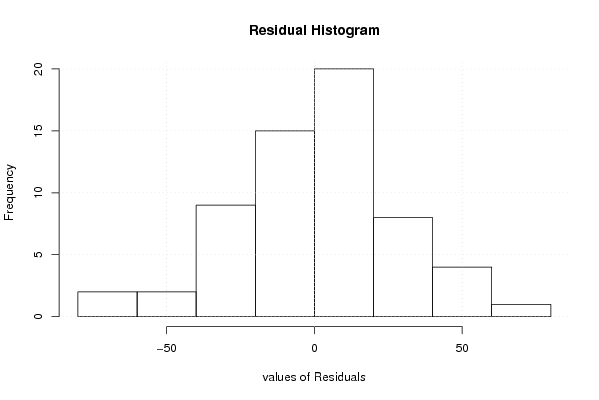
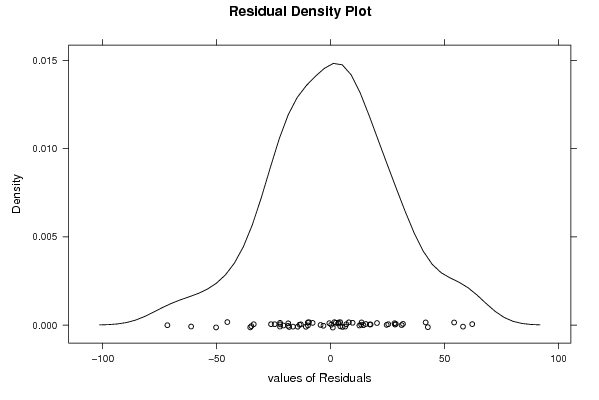
| Multiple Linear Regression - Residual Statistics | |
| Residual Standard Deviation | 27.6374538885241 |
| Sum Squared Residuals | 44302.0737315372 |
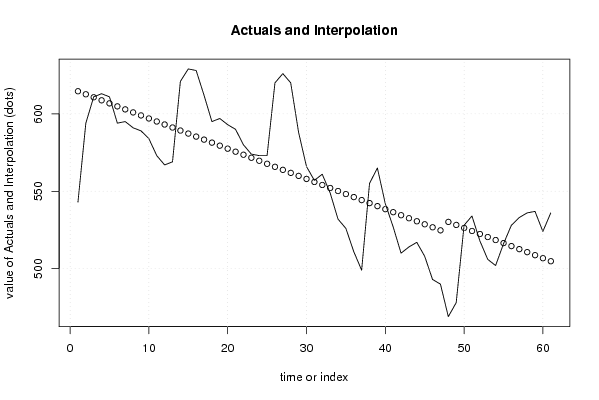
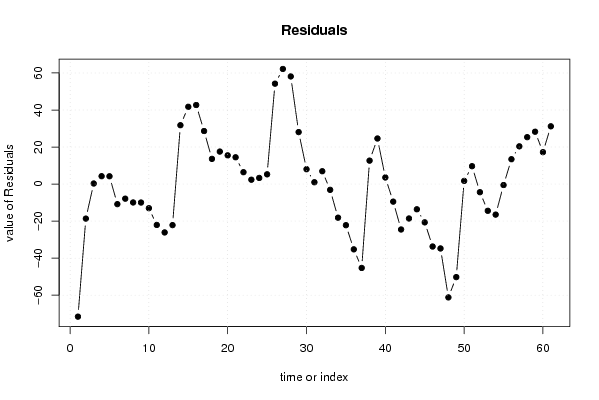
| Multiple Linear Regression - Actuals, Interpolation, and Residuals | |||
| Time or Index | Actuals | Interpolation Forecast | Residuals Prediction Error |
| 1 | 543 | 614.598940185571 | -71.5989401855713 |
| 2 | 594 | 612.645979788972 | -18.6459797889719 |
| 3 | 611 | 610.693019392375 | 0.306980607625428 |
| 4 | 613 | 608.740058995777 | 4.25994100422288 |
| 5 | 611 | 606.78709859918 | 4.21290140082024 |
| 6 | 594 | 604.834138202582 | -10.8341382025824 |
| 7 | 595 | 602.881177805985 | -7.88117780598502 |
| 8 | 591 | 600.928217409388 | -9.92821740938765 |
| 9 | 589 | 598.97525701279 | -9.97525701279028 |
| 10 | 584 | 597.022296616193 | -13.0222966161929 |
| 11 | 573 | 595.069336219596 | -22.0693362195955 |
| 12 | 567 | 593.116375822998 | -26.1163758229982 |
| 13 | 569 | 591.1634154264 | -22.1634154264008 |
| 14 | 621 | 589.210455029803 | 31.7895449701966 |
| 15 | 629 | 587.257494633206 | 41.7425053667939 |
| 16 | 628 | 585.304534236609 | 42.6954657633913 |
| 17 | 612 | 583.351573840011 | 28.6484261599887 |
| 18 | 595 | 581.398613443414 | 13.6013865565860 |
| 19 | 597 | 579.445653046817 | 17.5543469531834 |
| 20 | 593 | 577.492692650219 | 15.5073073497808 |
| 21 | 590 | 575.539732253622 | 14.4602677463782 |
| 22 | 580 | 573.586771857024 | 6.41322814297552 |
| 23 | 574 | 571.633811460427 | 2.36618853957289 |
| 24 | 573 | 569.68085106383 | 3.31914893617026 |
| 25 | 573 | 567.727890667232 | 5.27210933276763 |
| 26 | 620 | 565.774930270635 | 54.225069729365 |
| 27 | 626 | 563.821969874038 | 62.1780301259624 |
| 28 | 620 | 561.86900947744 | 58.1309905225597 |
| 29 | 588 | 559.916049080843 | 28.0839509191571 |
| 30 | 566 | 557.963088684246 | 8.03691131575447 |
| 31 | 557 | 556.010128287648 | 0.989871712351839 |
| 32 | 561 | 554.057167891051 | 6.94283210894921 |
| 33 | 549 | 552.104207494453 | -3.10420749445342 |
| 34 | 532 | 550.151247097856 | -18.1512470978561 |
| 35 | 526 | 548.198286701259 | -22.1982867012587 |
| 36 | 511 | 546.245326304661 | -35.2453263046613 |
| 37 | 499 | 544.292365908064 | -45.2923659080639 |
| 38 | 555 | 542.339405511467 | 12.6605944885334 |
| 39 | 565 | 540.386445114869 | 24.6135548851308 |
| 40 | 542 | 538.433484718272 | 3.56651528172816 |
| 41 | 527 | 536.480524321674 | -9.48052432167447 |
| 42 | 510 | 534.527563925077 | -24.5275639250771 |
| 43 | 514 | 532.57460352848 | -18.5746035284797 |
| 44 | 517 | 530.621643131882 | -13.6216431318824 |
| 45 | 508 | 528.668682735285 | -20.668682735285 |
| 46 | 493 | 526.715722338688 | -33.7157223386876 |
| 47 | 490 | 524.76276194209 | -34.7627619420903 |
| 48 | 469 | 530.194242577883 | -61.1942425778829 |
| 49 | 478 | 528.241282181286 | -50.2412821812855 |
| 50 | 528 | 526.288321784688 | 1.71167821531184 |
| 51 | 534 | 524.335361388091 | 9.6646386119092 |
| 52 | 518 | 522.382400991493 | -4.38240099149343 |
| 53 | 506 | 520.429440594896 | -14.4294405948961 |
| 54 | 502 | 518.476480198299 | -16.4764801982987 |
| 55 | 516 | 516.523519801701 | -0.523519801701317 |
| 56 | 528 | 514.570559405104 | 13.4294405948960 |
| 57 | 533 | 512.617599008507 | 20.3824009914934 |
| 58 | 536 | 510.664638611909 | 25.3353613880908 |
| 59 | 537 | 508.711678215312 | 28.2883217846882 |
| 60 | 524 | 506.758717818714 | 17.2412821812855 |
| 61 | 536 | 504.805757422117 | 31.1942425778829 |
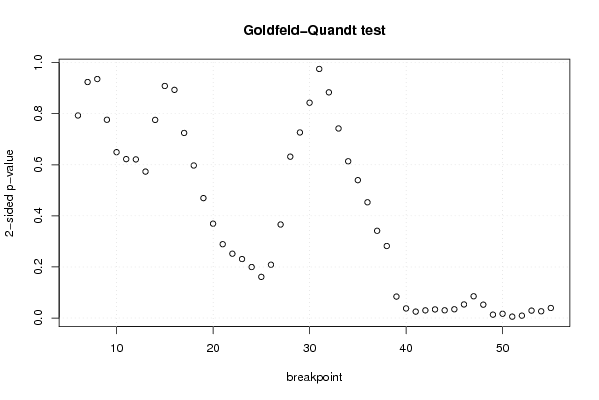
| Goldfeld-Quandt test for Heteroskedasticity | |||
| p-values | Alternative Hypothesis | ||
| breakpoint index | greater | 2-sided | less |
| 6 | 0.603561770978399 | 0.792876458043202 | 0.396438229021601 |
| 7 | 0.538078111590127 | 0.923843776819746 | 0.461921888409873 |
| 8 | 0.467799372745983 | 0.935598745491965 | 0.532200627254017 |
| 9 | 0.388082449515054 | 0.776164899030108 | 0.611917550484946 |
| 10 | 0.324665599914699 | 0.649331199829399 | 0.6753344000853 |
| 11 | 0.311013458419598 | 0.622026916839195 | 0.688986541580402 |
| 12 | 0.310510171813140 | 0.621020343626281 | 0.68948982818686 |
| 13 | 0.286624517661377 | 0.573249035322753 | 0.713375482338623 |
| 14 | 0.387756837133948 | 0.775513674267896 | 0.612243162866052 |
| 15 | 0.454202499114023 | 0.908404998228047 | 0.545797500885977 |
| 16 | 0.446626770586996 | 0.893253541173992 | 0.553373229413004 |
| 17 | 0.362271234363814 | 0.724542468727628 | 0.637728765636186 |
| 18 | 0.298573506241571 | 0.597147012483143 | 0.701426493758429 |
| 19 | 0.234733347170628 | 0.469466694341255 | 0.765266652829372 |
| 20 | 0.184649842491473 | 0.369299684982945 | 0.815350157508527 |
| 21 | 0.144505739725926 | 0.289011479451851 | 0.855494260274074 |
| 22 | 0.125893986750005 | 0.251787973500011 | 0.874106013249994 |
| 23 | 0.115439046264839 | 0.230878092529679 | 0.884560953735161 |
| 24 | 0.0997836545878486 | 0.199567309175697 | 0.900216345412151 |
| 25 | 0.0805701281233201 | 0.161140256246640 | 0.91942987187668 |
| 26 | 0.104306272087560 | 0.208612544175121 | 0.89569372791244 |
| 27 | 0.183048483326768 | 0.366096966653536 | 0.816951516673232 |
| 28 | 0.315855383236049 | 0.631710766472097 | 0.684144616763951 |
| 29 | 0.363237527903543 | 0.726475055807085 | 0.636762472096457 |
| 30 | 0.421424621192812 | 0.842849242385624 | 0.578575378807188 |
| 31 | 0.487533481940195 | 0.97506696388039 | 0.512466518059805 |
| 32 | 0.55824253511251 | 0.88351492977498 | 0.44175746488749 |
| 33 | 0.62895452774544 | 0.742090944509121 | 0.371045472254561 |
| 34 | 0.693175044570413 | 0.613649910859174 | 0.306824955429587 |
| 35 | 0.73013066073095 | 0.539738678538101 | 0.269869339269050 |
| 36 | 0.773451241817027 | 0.453097516365946 | 0.226548758182973 |
| 37 | 0.829238237411674 | 0.341523525176651 | 0.170761762588325 |
| 38 | 0.859021392846621 | 0.281957214306758 | 0.140978607153379 |
| 39 | 0.958018286565789 | 0.0839634268684222 | 0.0419817134342111 |
| 40 | 0.981189363311185 | 0.0376212733776306 | 0.0188106366888153 |
| 41 | 0.987407271158773 | 0.0251854576824537 | 0.0125927288412268 |
| 42 | 0.98498310691223 | 0.0300337861755380 | 0.0150168930877690 |
| 43 | 0.983142998418913 | 0.0337140031621744 | 0.0168570015810872 |
| 44 | 0.984842009676813 | 0.0303159806463732 | 0.0151579903231866 |
| 45 | 0.98281939187737 | 0.0343612162452577 | 0.0171806081226288 |
| 46 | 0.973416333128793 | 0.0531673337424149 | 0.0265836668712074 |
| 47 | 0.957415585912193 | 0.0851688281756137 | 0.0425844140878068 |
| 48 | 0.973867111175451 | 0.0522657776490978 | 0.0261328888245489 |
| 49 | 0.993401209803974 | 0.0131975803920518 | 0.00659879019602592 |
| 50 | 0.99164621384879 | 0.0167075723024208 | 0.00835378615121039 |
| 51 | 0.99729652424907 | 0.00540695150185796 | 0.00270347575092898 |
| 52 | 0.995327072489265 | 0.00934585502147 | 0.004672927510735 |
| 53 | 0.98549800619353 | 0.0290039876129407 | 0.0145019938064704 |
| 54 | 0.986790848724658 | 0.0264183025506830 | 0.0132091512753415 |
| 55 | 0.980320916718475 | 0.0393581665630502 | 0.0196790832815251 |
| Meta Analysis of Goldfeld-Quandt test for Heteroskedasticity | |||
| Description | # significant tests | % significant tests | OK/NOK |
| 1% type I error level | 2 | 0.04 | NOK |
| 5% type I error level | 13 | 0.26 | NOK |
| 10% type I error level | 17 | 0.34 | NOK |