| Multiple Linear Regression - Estimated Regression Equation |
| Rvnp[t] = + 38.2335095393206 -0.764949810543109Svdg[t] -3.59272407985997M1[t] -6.99181657027631M2[t] -5.0113105763478M3[t] -4.21864397615723M4[t] -4.17195730018391M5[t] -5.03620035897094M6[t] -7.09137315251833M7[t] -5.32674670389328M8[t] -2.80212025526823M9[t] -1.73337335194664M10[t] -1.26565656229918M11[t] -0.313696713864699t + e[t] |
| Multiple Linear Regression - Ordinary Least Squares | |||||
| Variable | Parameter | S.D. | T-STAT H0: parameter = 0 | 2-tail p-value | 1-tail p-value |
| (Intercept) | 38.2335095393206 | 10.70384 | 3.5719 | 0.000844 | 0.000422 |
| Svdg | -0.764949810543109 | 0.414666 | -1.8447 | 0.07152 | 0.03576 |
| M1 | -3.59272407985997 | 6.680476 | -0.5378 | 0.593311 | 0.296656 |
| M2 | -6.99181657027631 | 7.066713 | -0.9894 | 0.327643 | 0.163821 |
| M3 | -5.0113105763478 | 6.651337 | -0.7534 | 0.455031 | 0.227516 |
| M4 | -4.21864397615723 | 6.609334 | -0.6383 | 0.526453 | 0.263226 |
| M5 | -4.17195730018391 | 6.592397 | -0.6328 | 0.529969 | 0.264985 |
| M6 | -5.03620035897094 | 6.608617 | -0.7621 | 0.449911 | 0.224955 |
| M7 | -7.09137315251833 | 6.754597 | -1.0499 | 0.299268 | 0.149634 |
| M8 | -5.32674670389328 | 6.625689 | -0.804 | 0.425559 | 0.21278 |
| M9 | -2.80212025526823 | 6.571308 | -0.4264 | 0.671793 | 0.335896 |
| M10 | -1.73337335194664 | 6.580854 | -0.2634 | 0.793421 | 0.396711 |
| M11 | -1.26565656229918 | 6.582159 | -0.1923 | 0.848365 | 0.424182 |
| t | -0.313696713864699 | 0.147594 | -2.1254 | 0.038955 | 0.019478 |
| Multiple Linear Regression - Regression Statistics | |
| Multiple R | 0.324935060040943 |
| R-squared | 0.105582793243811 |
| Adjusted R-squared | -0.147187286926416 |
| F-TEST (value) | 0.417702890993692 |
| F-TEST (DF numerator) | 13 |
| F-TEST (DF denominator) | 46 |
| p-value | 0.955563158999425 |
| Multiple Linear Regression - Residual Statistics | |
| Residual Standard Deviation | 10.3815051824122 |
| Sum Squared Residuals | 4957.67989321279 |
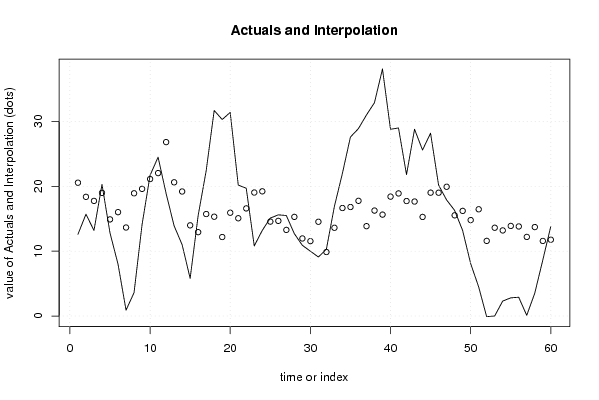
| Multiple Linear Regression - Actuals, Interpolation, and Residuals | |||
| Time or Index | Actuals | Interpolation Forecast | Residuals Prediction Error |
| 1 | 12.6 | 20.5579921558200 | -7.95799215582005 |
| 2 | 15.7 | 18.3751025726251 | -2.67510257262514 |
| 3 | 13.2 | 17.7470624210596 | -4.54706242105963 |
| 4 | 20.3 | 18.9909821179286 | 1.30901788207140 |
| 5 | 12.8 | 14.8992230273217 | -2.09922302732167 |
| 6 | 8 | 16.0161326862993 | -8.01613268629927 |
| 7 | 0.9 | 13.6472631788872 | -12.7472631788872 |
| 8 | 3.6 | 18.9229419663631 | -15.3229419663631 |
| 9 | 14.1 | 19.6039720800372 | -5.50397208003723 |
| 10 | 21.7 | 21.1239720800372 | 0.576027919962784 |
| 11 | 24.5 | 22.0429419663631 | 2.45705803363691 |
| 12 | 18.9 | 26.8196508675131 | -7.91965086751312 |
| 13 | 13.9 | 20.6183806421591 | -6.71838064215912 |
| 14 | 11 | 19.2004408695074 | -8.2004408695074 |
| 15 | 5.8 | 13.9827018546832 | -8.18270185468324 |
| 16 | 15.5 | 12.9317721199229 | 2.56822788007711 |
| 17 | 22.4 | 15.7245613242039 | 6.67543867579605 |
| 18 | 31.7 | 15.3115713620953 | 16.3884286379047 |
| 19 | 30.3 | 12.1777520441401 | 18.1222479558599 |
| 20 | 31.4 | 15.9235312105298 | 15.4764687894702 |
| 21 | 20.2 | 15.0746617031177 | 5.12533829688227 |
| 22 | 19.7 | 16.5946617031177 | 3.10533829688227 |
| 23 | 10.8 | 19.0435312105298 | -8.24353121052981 |
| 24 | 13.2 | 19.2305412484212 | -6.03054124842119 |
| 25 | 15.1 | 14.5591706441534 | 0.540829355846585 |
| 26 | 15.6 | 14.6711304925879 | 0.928869507412083 |
| 27 | 15.5 | 13.2781405304793 | 2.2218594695207 |
| 28 | 12.7 | 15.2870100378914 | -2.58701003789138 |
| 29 | 10.9 | 11.9602007578276 | -1.06020075782757 |
| 30 | 10 | 11.5472107957189 | -1.54721079571894 |
| 31 | 9.1 | 14.5329899621086 | -5.43298996210862 |
| 32 | 10.3 | 9.8643212125241 | 0.435678787475895 |
| 33 | 16.9 | 13.6051505683707 | 3.29484943162933 |
| 34 | 22 | 16.6550501894569 | 5.34494981054311 |
| 35 | 27.6 | 16.8090702652396 | 10.7909297347604 |
| 36 | 28.9 | 17.7610301136741 | 11.1389698863259 |
| 37 | 31 | 13.8546093199495 | 17.1453906800505 |
| 38 | 32.9 | 16.2614186000133 | 16.6385813999867 |
| 39 | 38.1 | 15.6333784484478 | 22.4666215515522 |
| 40 | 28.8 | 18.4071977664030 | 10.3928022335970 |
| 41 | 29 | 18.9051375390547 | 10.0948624609453 |
| 42 | 21.8 | 17.7271977664030 | 4.07280223359703 |
| 43 | 28.8 | 17.6531776906202 | 11.1468223093798 |
| 44 | 25.6 | 15.2793583726650 | 10.3206416273350 |
| 45 | 28.2 | 19.0201877285116 | 9.17981227148841 |
| 46 | 20.2 | 19.0102881074254 | 1.18971189257462 |
| 47 | 17.9 | 19.9292579937512 | -2.02925799375125 |
| 48 | 16.3 | 15.5265691683840 | 0.773430831616032 |
| 49 | 13.2 | 16.2098472379180 | -3.00984723791795 |
| 50 | 8.1 | 14.7919074652662 | -6.69190746526624 |
| 51 | 4.5 | 16.4587167453301 | -11.9587167453301 |
| 52 | -0.1 | 11.5830379578542 | -11.6830379578542 |
| 53 | 0 | 13.6108773515921 | -13.6108773515921 |
| 54 | 2.3 | 13.1978873894835 | -10.8978873894835 |
| 55 | 2.8 | 13.8888171242438 | -11.0888171242438 |
| 56 | 2.9 | 13.8098472379180 | -10.9098472379180 |
| 57 | 0.1 | 12.1960279199628 | -12.0960279199628 |
| 58 | 3.5 | 13.7160279199628 | -10.2160279199628 |
| 59 | 8.6 | 11.5751985641162 | -2.97519856411621 |
| 60 | 13.8 | 11.7622086020076 | 2.03779139799241 |
| Goldfeld-Quandt test for Heteroskedasticity | |||
| p-values | Alternative Hypothesis | ||
| breakpoint index | greater | 2-sided | less |
| 17 | 0.111780849272206 | 0.223561698544412 | 0.888219150727794 |
| 18 | 0.443199970935922 | 0.886399941871844 | 0.556800029064078 |
| 19 | 0.710760990084942 | 0.578478019830116 | 0.289239009915058 |
| 20 | 0.7805086115887 | 0.4389827768226 | 0.2194913884113 |
| 21 | 0.676590160506361 | 0.646819678987278 | 0.323409839493639 |
| 22 | 0.5840496286447 | 0.8319007427106 | 0.4159503713553 |
| 23 | 0.694053223113498 | 0.611893553773005 | 0.305946776886502 |
| 24 | 0.757001413451101 | 0.485997173097798 | 0.242998586548899 |
| 25 | 0.717404683816405 | 0.56519063236719 | 0.282595316183595 |
| 26 | 0.670868609281358 | 0.658262781437284 | 0.329131390718642 |
| 27 | 0.599706365898895 | 0.80058726820221 | 0.400293634101105 |
| 28 | 0.653966143881173 | 0.692067712237654 | 0.346033856118827 |
| 29 | 0.611044312373871 | 0.777911375252257 | 0.388955687626129 |
| 30 | 0.574677226369177 | 0.850645547261646 | 0.425322773630823 |
| 31 | 0.651886823626854 | 0.696226352746292 | 0.348113176373146 |
| 32 | 0.631591957570217 | 0.736816084859567 | 0.368408042429783 |
| 33 | 0.635649885764143 | 0.728700228471715 | 0.364350114235857 |
| 34 | 0.634134665376294 | 0.731730669247412 | 0.365865334623706 |
| 35 | 0.670784666501184 | 0.658430666997632 | 0.329215333498816 |
| 36 | 0.820700085647692 | 0.358599828704615 | 0.179299914352308 |
| 37 | 0.81780175201184 | 0.364396495976319 | 0.182198247988160 |
| 38 | 0.754323776264018 | 0.491352447471964 | 0.245676223735982 |
| 39 | 0.74668728423805 | 0.506625431523899 | 0.253312715761950 |
| 40 | 0.700482288713771 | 0.599035422572457 | 0.299517711286229 |
| 41 | 0.670380602507146 | 0.659238794985708 | 0.329619397492854 |
| 42 | 0.533269911709523 | 0.933460176580955 | 0.466730088290477 |
| 43 | 0.434755036258003 | 0.869510072516006 | 0.565244963741997 |
| Meta Analysis of Goldfeld-Quandt test for Heteroskedasticity | |||
| Description | # significant tests | % significant tests | OK/NOK |
| 1% type I error level | 0 | 0 | OK |
| 5% type I error level | 0 | 0 | OK |
| 10% type I error level | 0 | 0 | OK |