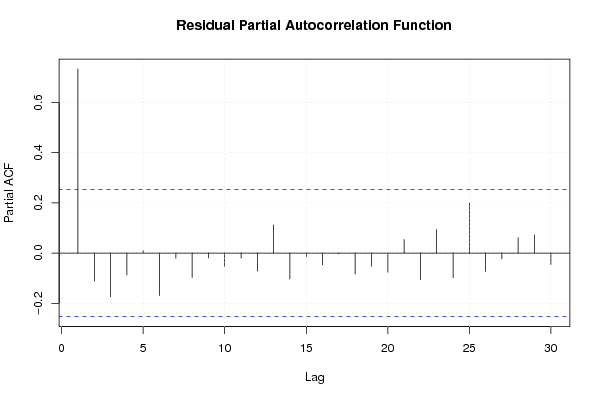
| Multiple Linear Regression - Estimated Regression Equation |
| Y[t] = + 21.9379166666667 -13.6895833333334X[t] -3.64M1[t] -3.46000000000001M2[t] -3.59999999999999M3[t] -3.67999999999999M4[t] -3.50000000000000M5[t] -3.12M6[t] -2.66M7[t] -2.30000000000000M8[t] -1.73999999999999M9[t] -1.07999999999999M10[t] -0.399999999999995M11[t] + e[t] |
| Multiple Linear Regression - Ordinary Least Squares | |||||
| Variable | Parameter | S.D. | T-STAT H0: parameter = 0 | 2-tail p-value | 1-tail p-value |
| (Intercept) | 21.9379166666667 | 1.693442 | 12.9546 | 0 | 0 |
| X | -13.6895833333334 | 1.209602 | -11.3174 | 0 | 0 |
| M1 | -3.64 | 2.370325 | -1.5357 | 0.131328 | 0.065664 |
| M2 | -3.46000000000001 | 2.370325 | -1.4597 | 0.15102 | 0.07551 |
| M3 | -3.59999999999999 | 2.370325 | -1.5188 | 0.135517 | 0.067758 |
| M4 | -3.67999999999999 | 2.370325 | -1.5525 | 0.127244 | 0.063622 |
| M5 | -3.50000000000000 | 2.370325 | -1.4766 | 0.146455 | 0.073227 |
| M6 | -3.12 | 2.370325 | -1.3163 | 0.194465 | 0.097233 |
| M7 | -2.66 | 2.370325 | -1.1222 | 0.267474 | 0.133737 |
| M8 | -2.30000000000000 | 2.370325 | -0.9703 | 0.336849 | 0.168424 |
| M9 | -1.73999999999999 | 2.370325 | -0.7341 | 0.466549 | 0.233274 |
| M10 | -1.07999999999999 | 2.370325 | -0.4556 | 0.650752 | 0.325376 |
| M11 | -0.399999999999995 | 2.370325 | -0.1688 | 0.866715 | 0.433357 |
| Multiple Linear Regression - Regression Statistics | |
| Multiple R | 0.86126669839 |
| R-squared | 0.741780325755611 |
| Adjusted R-squared | 0.675851898288959 |
| F-TEST (value) | 11.2512971150543 |
| F-TEST (DF numerator) | 12 |
| F-TEST (DF denominator) | 47 |
| p-value | 3.96747745767811e-10 |
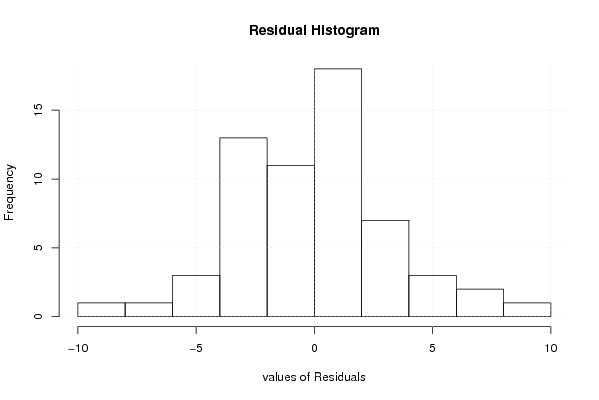
| Multiple Linear Regression - Residual Statistics | |
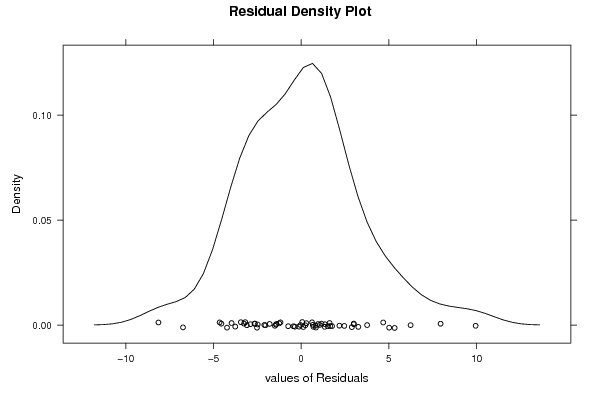
| Residual Standard Deviation | 3.74781342871466 |
| Sum Squared Residuals | 660.166958333334 |
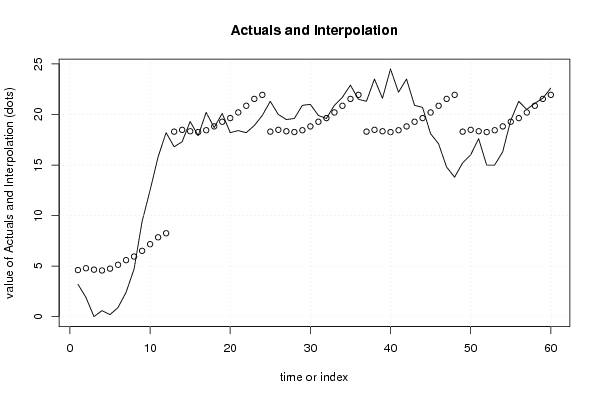
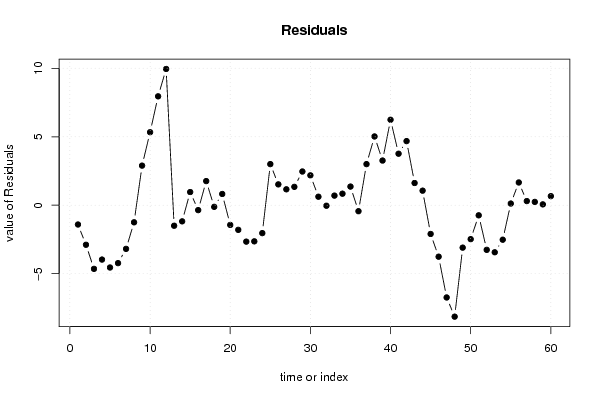
| Multiple Linear Regression - Actuals, Interpolation, and Residuals | |||
| Time or Index | Actuals | Interpolation Forecast | Residuals Prediction Error |
| 1 | 3.2 | 4.60833333333334 | -1.40833333333334 |
| 2 | 1.9 | 4.78833333333339 | -2.88833333333339 |
| 3 | 0 | 4.64833333333333 | -4.64833333333333 |
| 4 | 0.6 | 4.56833333333332 | -3.96833333333332 |
| 5 | 0.2 | 4.74833333333334 | -4.54833333333334 |
| 6 | 0.9 | 5.12833333333333 | -4.22833333333333 |
| 7 | 2.4 | 5.58833333333333 | -3.18833333333333 |
| 8 | 4.7 | 5.94833333333333 | -1.24833333333333 |
| 9 | 9.4 | 6.50833333333332 | 2.89166666666668 |
| 10 | 12.5 | 7.16833333333332 | 5.33166666666668 |
| 11 | 15.8 | 7.84833333333333 | 7.95166666666667 |
| 12 | 18.2 | 8.24833333333333 | 9.95166666666667 |
| 13 | 16.8 | 18.2979166666667 | -1.49791666666667 |
| 14 | 17.3 | 18.4779166666667 | -1.17791666666665 |
| 15 | 19.3 | 18.3379166666667 | 0.962083333333332 |
| 16 | 17.9 | 18.2579166666667 | -0.357916666666669 |
| 17 | 20.2 | 18.4379166666667 | 1.76208333333333 |
| 18 | 18.7 | 18.8179166666667 | -0.117916666666668 |
| 19 | 20.1 | 19.2779166666667 | 0.822083333333333 |
| 20 | 18.2 | 19.6379166666667 | -1.43791666666667 |
| 21 | 18.4 | 20.1979166666667 | -1.79791666666667 |
| 22 | 18.2 | 20.8579166666667 | -2.65791666666667 |
| 23 | 18.9 | 21.5379166666667 | -2.63791666666667 |
| 24 | 19.9 | 21.9379166666667 | -2.03791666666666 |
| 25 | 21.3 | 18.2979166666667 | 3.00208333333334 |
| 26 | 20 | 18.4779166666667 | 1.52208333333335 |
| 27 | 19.5 | 18.3379166666667 | 1.16208333333333 |
| 28 | 19.6 | 18.2579166666667 | 1.34208333333333 |
| 29 | 20.9 | 18.4379166666667 | 2.46208333333333 |
| 30 | 21 | 18.8179166666667 | 2.18208333333333 |
| 31 | 19.9 | 19.2779166666667 | 0.62208333333333 |
| 32 | 19.6 | 19.6379166666667 | -0.037916666666668 |
| 33 | 20.9 | 20.1979166666667 | 0.702083333333327 |
| 34 | 21.7 | 20.8579166666667 | 0.842083333333333 |
| 35 | 22.9 | 21.5379166666667 | 1.36208333333333 |
| 36 | 21.5 | 21.9379166666667 | -0.437916666666662 |
| 37 | 21.3 | 18.2979166666667 | 3.00208333333334 |
| 38 | 23.5 | 18.4779166666667 | 5.02208333333335 |
| 39 | 21.6 | 18.3379166666667 | 3.26208333333333 |
| 40 | 24.5 | 18.2579166666667 | 6.24208333333333 |
| 41 | 22.2 | 18.4379166666667 | 3.76208333333333 |
| 42 | 23.5 | 18.8179166666667 | 4.68208333333333 |
| 43 | 20.9 | 19.2779166666667 | 1.62208333333333 |
| 44 | 20.7 | 19.6379166666667 | 1.06208333333333 |
| 45 | 18.1 | 20.1979166666667 | -2.09791666666667 |
| 46 | 17.1 | 20.8579166666667 | -3.75791666666667 |
| 47 | 14.8 | 21.5379166666667 | -6.73791666666667 |
| 48 | 13.8 | 21.9379166666667 | -8.13791666666666 |
| 49 | 15.2 | 18.2979166666667 | -3.09791666666666 |
| 50 | 16 | 18.4779166666667 | -2.47791666666665 |
| 51 | 17.6 | 18.3379166666667 | -0.737916666666667 |
| 52 | 15 | 18.2579166666667 | -3.25791666666667 |
| 53 | 15 | 18.4379166666667 | -3.43791666666667 |
| 54 | 16.3 | 18.8179166666667 | -2.51791666666667 |
| 55 | 19.4 | 19.2779166666667 | 0.12208333333333 |
| 56 | 21.3 | 19.6379166666667 | 1.66208333333333 |
| 57 | 20.5 | 20.1979166666667 | 0.302083333333329 |
| 58 | 21.1 | 20.8579166666667 | 0.242083333333335 |
| 59 | 21.6 | 21.5379166666667 | 0.0620833333333334 |
| 60 | 22.6 | 21.9379166666667 | 0.66208333333334 |
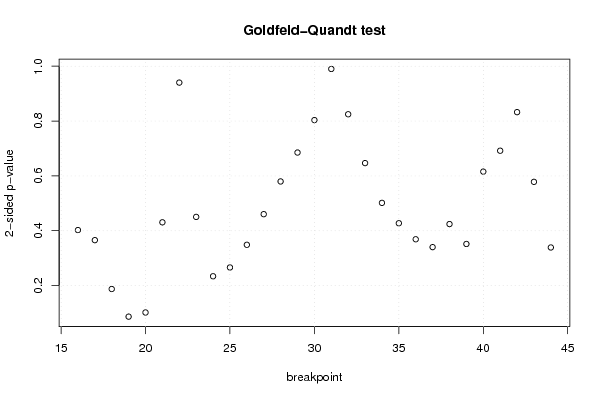
| Goldfeld-Quandt test for Heteroskedasticity | |||
| p-values | Alternative Hypothesis | ||
| breakpoint index | greater | 2-sided | less |
| 16 | 0.201201831085324 | 0.402403662170647 | 0.798798168914676 |
| 17 | 0.182777349027733 | 0.365554698055467 | 0.817222650972267 |
| 18 | 0.093651966815556 | 0.187303933631112 | 0.906348033184444 |
| 19 | 0.0432497359799072 | 0.0864994719598143 | 0.956750264020093 |
| 20 | 0.0508328812616245 | 0.101665762523249 | 0.949167118738375 |
| 21 | 0.215315722536364 | 0.430631445072728 | 0.784684277463636 |
| 22 | 0.529838618523108 | 0.940322762953784 | 0.470161381476892 |
| 23 | 0.774829944832408 | 0.450340110335184 | 0.225170055167592 |
| 24 | 0.883076123983437 | 0.233847752033126 | 0.116923876016563 |
| 25 | 0.867031269771325 | 0.265937460457350 | 0.132968730228675 |
| 26 | 0.825676152428543 | 0.348647695142914 | 0.174323847571457 |
| 27 | 0.769798977147356 | 0.460402045705288 | 0.230201022852644 |
| 28 | 0.71013143744968 | 0.579737125100639 | 0.289868562550320 |
| 29 | 0.65741006916749 | 0.685179861665021 | 0.342589930832511 |
| 30 | 0.598241420643587 | 0.803517158712826 | 0.401758579356413 |
| 31 | 0.504943418103237 | 0.990113163793526 | 0.495056581896763 |
| 32 | 0.412425193941908 | 0.824850387883815 | 0.587574806058092 |
| 33 | 0.323361440443741 | 0.646722880887483 | 0.676638559556259 |
| 34 | 0.25079101166211 | 0.50158202332422 | 0.74920898833789 |
| 35 | 0.213624063104908 | 0.427248126209816 | 0.786375936895092 |
| 36 | 0.184386766364251 | 0.368773532728503 | 0.815613233635749 |
| 37 | 0.170050290433641 | 0.340100580867281 | 0.82994970956636 |
| 38 | 0.212129937490241 | 0.424259874980481 | 0.78787006250976 |
| 39 | 0.175837011859600 | 0.351674023719200 | 0.8241629881404 |
| 40 | 0.307793853483 | 0.615587706966 | 0.692206146517 |
| 41 | 0.345896382041282 | 0.691792764082564 | 0.654103617958718 |
| 42 | 0.416289534437712 | 0.832579068875425 | 0.583710465562288 |
| 43 | 0.289120304056000 | 0.578240608111999 | 0.710879695944 |
| 44 | 0.169432061365860 | 0.338864122731719 | 0.83056793863414 |
| Meta Analysis of Goldfeld-Quandt test for Heteroskedasticity | |||
| Description | # significant tests | % significant tests | OK/NOK |
| 1% type I error level | 0 | 0 | OK |
| 5% type I error level | 0 | 0 | OK |
| 10% type I error level | 1 | 0.0344827586206897 | OK |