| Multiple Linear Regression - Estimated Regression Equation |
| Y[t] = + 6.45334600611849 + 2.86270785610798e-05X[t] + 0.313663967704978Y1[t] -0.0391313044914567Y2[t] -0.0475363981301766Y3[t] -0.0511292781289009Y4[t] + 0.0976468238655872M1[t] -0.587691273323679M2[t] -0.691345384808646M3[t] -0.634225040597112M4[t] -0.31093127283165M5[t] -0.0254784574698382M6[t] -0.0183527603020163M7[t] -0.0976254621655117M8[t] -0.166708756365665M9[t] -0.324682647520785M10[t] -0.434249952247223M11[t] -0.0133276870234248t + e[t] |
| Multiple Linear Regression - Ordinary Least Squares | |||||
| Variable | Parameter | S.D. | T-STAT H0: parameter = 0 | 2-tail p-value | 1-tail p-value |
| (Intercept) | 6.45334600611849 | 1.009816 | 6.3906 | 0 | 0 |
| X | 2.86270785610798e-05 | 0.000163 | 0.1756 | 0.861413 | 0.430707 |
| Y1 | 0.313663967704978 | 0.096369 | 3.2548 | 0.002215 | 0.001107 |
| Y2 | -0.0391313044914567 | 0.106875 | -0.3661 | 0.716056 | 0.358028 |
| Y3 | -0.0475363981301766 | 0.106688 | -0.4456 | 0.658148 | 0.329074 |
| Y4 | -0.0511292781289009 | 0.079544 | -0.6428 | 0.523782 | 0.261891 |
| M1 | 0.0976468238655872 | 0.355687 | 0.2745 | 0.784992 | 0.392496 |
| M2 | -0.587691273323679 | 0.384 | -1.5304 | 0.133231 | 0.066615 |
| M3 | -0.691345384808646 | 0.378884 | -1.8247 | 0.075 | 0.0375 |
| M4 | -0.634225040597112 | 0.375584 | -1.6886 | 0.09853 | 0.049265 |
| M5 | -0.31093127283165 | 0.354505 | -0.8771 | 0.385314 | 0.192657 |
| M6 | -0.0254784574698382 | 0.364483 | -0.0699 | 0.944595 | 0.472298 |
| M7 | -0.0183527603020163 | 0.357641 | -0.0513 | 0.959311 | 0.479656 |
| M8 | -0.0976254621655117 | 0.358981 | -0.272 | 0.786961 | 0.39348 |
| M9 | -0.166708756365665 | 0.357814 | -0.4659 | 0.643632 | 0.321816 |
| M10 | -0.324682647520785 | 0.35839 | -0.9059 | 0.370012 | 0.185006 |
| M11 | -0.434249952247223 | 0.353522 | -1.2284 | 0.225995 | 0.112998 |
| t | -0.0133276870234248 | 0.005246 | -2.5404 | 0.014766 | 0.007383 |
| Multiple Linear Regression - Regression Statistics | |
| Multiple R | 0.700175703647055 |
| R-squared | 0.490246015977649 |
| Adjusted R-squared | 0.288715371131603 |
| F-TEST (value) | 2.43261274905442 |
| F-TEST (DF numerator) | 17 |
| F-TEST (DF denominator) | 43 |
| p-value | 0.00948963500605382 |
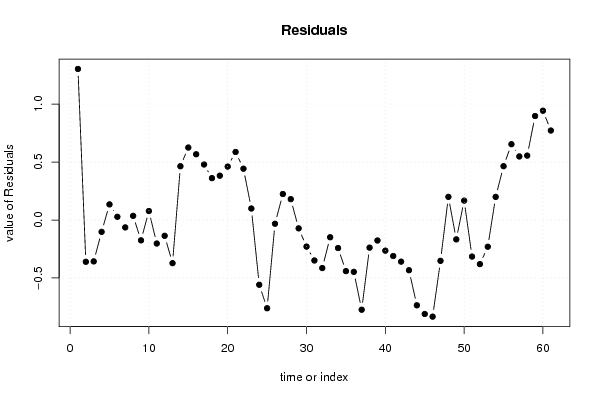
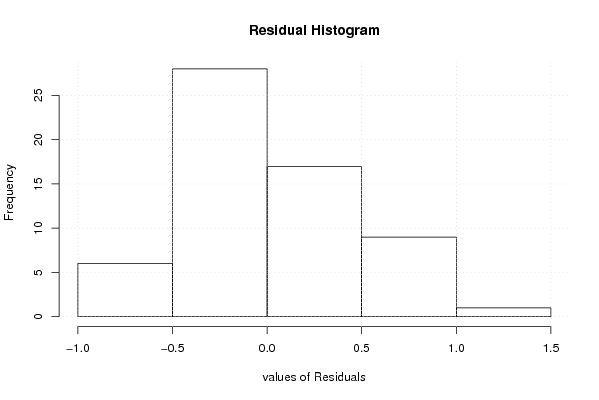
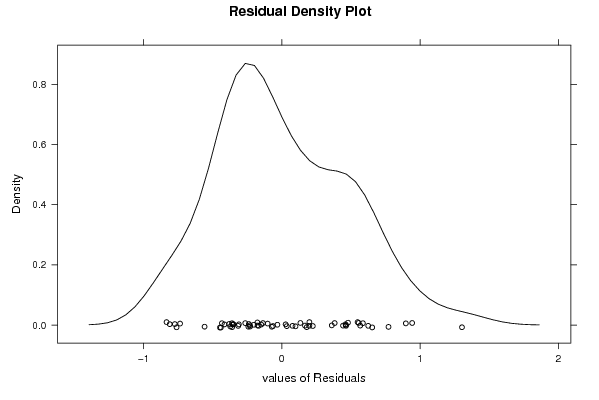
| Multiple Linear Regression - Residual Statistics | |
| Residual Standard Deviation | 0.557968541564462 |
| Sum Squared Residuals | 13.3871424151496 |
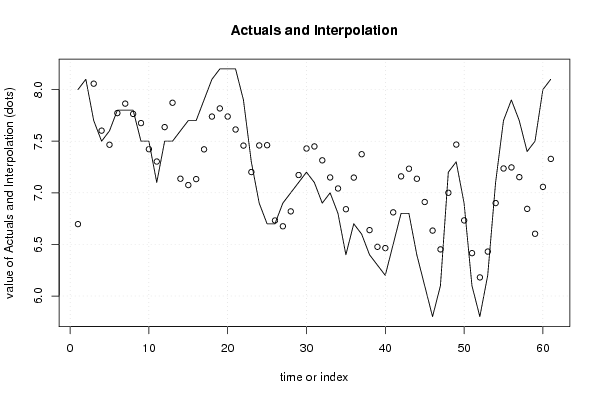
| Multiple Linear Regression - Actuals, Interpolation, and Residuals | |||
| Time or Index | Actuals | Interpolation Forecast | Residuals Prediction Error |
| 1 | 8 | 6.69683169976024 | 1.30316830023976 |
| 2 | 8.1 | 8.46058650250434 | -0.36058650250434 |
| 3 | 7.7 | 8.05725445102933 | -0.357254451029332 |
| 4 | 7.5 | 7.60222686841954 | -0.102226868419543 |
| 5 | 7.6 | 7.46552384353924 | 0.13447615646076 |
| 6 | 7.8 | 7.77247918486363 | 0.0275208151363730 |
| 7 | 7.8 | 7.86398749748853 | -0.0639874974885262 |
| 8 | 7.8 | 7.7643095955535 | 0.0356904044465012 |
| 9 | 7.5 | 7.67546575135946 | -0.175465751359464 |
| 10 | 7.5 | 7.4224545193069 | 0.0775454806930998 |
| 11 | 7.1 | 7.30299706612176 | -0.202997066121761 |
| 12 | 7.5 | 7.63636063059407 | -0.136360630594072 |
| 13 | 7.5 | 7.87247044594802 | -0.372470445948023 |
| 14 | 7.6 | 7.13625860392704 | 0.463741396072962 |
| 15 | 7.7 | 7.07495338995893 | 0.625046610041066 |
| 16 | 7.7 | 7.13278986354286 | 0.567210136457139 |
| 17 | 7.9 | 7.42112110743457 | 0.478878892565434 |
| 18 | 8.1 | 7.73855491294792 | 0.361445087052084 |
| 19 | 8.2 | 7.81767273241643 | 0.382327267583572 |
| 20 | 8.2 | 7.73907657269712 | 0.460923427302882 |
| 21 | 8.2 | 7.61323801448687 | 0.586761985513128 |
| 22 | 7.9 | 7.4573588983014 | 0.442641101698604 |
| 23 | 7.3 | 7.20095654831098 | 0.0990434516890234 |
| 24 | 6.9 | 7.45873141579013 | -0.558731415790127 |
| 25 | 6.7 | 7.46130772710349 | -0.761307727103491 |
| 26 | 6.7 | 6.73196892512309 | -0.0319689251230881 |
| 27 | 6.9 | 6.67571174644124 | 0.224288253558761 |
| 28 | 7 | 6.82021177004504 | 0.179788229954959 |
| 29 | 7.1 | 7.17218844091066 | -0.0721884409106568 |
| 30 | 7.2 | 7.42925253436344 | -0.229252534363435 |
| 31 | 7.1 | 7.44923668602114 | -0.349236686021144 |
| 32 | 6.9 | 7.31466780800895 | -0.414667808008952 |
| 33 | 7 | 7.14877039645154 | -0.148770396451538 |
| 34 | 6.8 | 7.0419806774112 | -0.241980677411199 |
| 35 | 6.4 | 6.84098070054098 | -0.440980700540977 |
| 36 | 6.7 | 7.1473311807947 | -0.447331180794707 |
| 37 | 6.6 | 7.37390817270507 | -0.773908172705071 |
| 38 | 6.4 | 6.63838947116775 | -0.238389471167749 |
| 39 | 6.3 | 6.47673712922 | -0.176737129219994 |
| 40 | 6.2 | 6.46439028349677 | -0.264390283496774 |
| 41 | 6.5 | 6.81067599924576 | -0.310675999245759 |
| 42 | 6.8 | 7.15917891030396 | -0.359178910303962 |
| 43 | 6.8 | 7.23326579527835 | -0.433265795278353 |
| 44 | 6.4 | 7.13592369572628 | -0.735923695726281 |
| 45 | 6.1 | 6.91081432248138 | -0.810814322481376 |
| 46 | 5.8 | 6.63378980058928 | -0.83378980058928 |
| 47 | 6.1 | 6.4521299016972 | -0.352129901697204 |
| 48 | 7.2 | 7.00034904189677 | 0.199650958103235 |
| 49 | 7.3 | 7.46725428479471 | -0.167254284794713 |
| 50 | 6.9 | 6.73279649727778 | 0.167203502722216 |
| 51 | 6.1 | 6.4153432833505 | -0.315343283350501 |
| 52 | 5.8 | 6.18038121449578 | -0.380381214495782 |
| 53 | 6.2 | 6.43049060886978 | -0.230490608869778 |
| 54 | 7.1 | 6.90053445752106 | 0.199465542478940 |
| 55 | 7.7 | 7.23583728879555 | 0.46416271120445 |
| 56 | 7.9 | 7.24602232801415 | 0.65397767198585 |
| 57 | 7.7 | 7.15171151522075 | 0.54828848477925 |
| 58 | 7.4 | 6.84441610439123 | 0.555583895608774 |
| 59 | 7.5 | 6.60293578332908 | 0.897064216670918 |
| 60 | 8 | 7.05722773092433 | 0.94277226907567 |
| 61 | 8.1 | 7.32822766968846 | 0.771772330311541 |
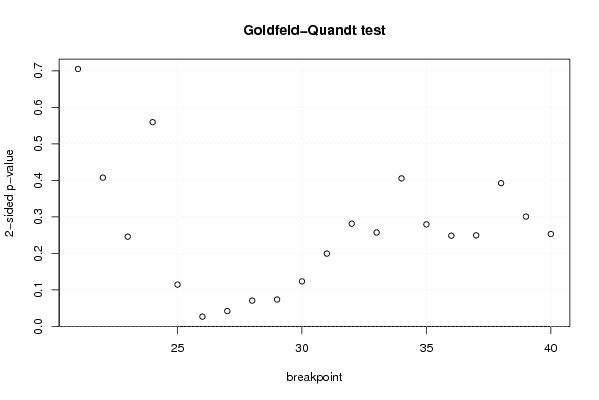
| Goldfeld-Quandt test for Heteroskedasticity | |||
| p-values | Alternative Hypothesis | ||
| breakpoint index | greater | 2-sided | less |
| 21 | 0.352557217605342 | 0.705114435210684 | 0.647442782394658 |
| 22 | 0.203679082961054 | 0.407358165922107 | 0.796320917038946 |
| 23 | 0.122844693637471 | 0.245689387274943 | 0.877155306362529 |
| 24 | 0.720372730835962 | 0.559254538328077 | 0.279627269164038 |
| 25 | 0.942750995311777 | 0.114498009376445 | 0.0572490046882226 |
| 26 | 0.986673544466686 | 0.0266529110666276 | 0.0133264555333138 |
| 27 | 0.979040611942034 | 0.0419187761159323 | 0.0209593880579662 |
| 28 | 0.964673741583314 | 0.0706525168333715 | 0.0353262584166857 |
| 29 | 0.963244333687943 | 0.0735113326241147 | 0.0367556663120573 |
| 30 | 0.938347204651562 | 0.123305590696876 | 0.061652795348438 |
| 31 | 0.90035444321857 | 0.199291113562860 | 0.0996455567814301 |
| 32 | 0.85933773282444 | 0.281324534351121 | 0.140662267175561 |
| 33 | 0.871409642702426 | 0.257180714595149 | 0.128590357297574 |
| 34 | 0.797278346467396 | 0.405443307065208 | 0.202721653532604 |
| 35 | 0.860241250525368 | 0.279517498949264 | 0.139758749474632 |
| 36 | 0.875795297377529 | 0.248409405244942 | 0.124204702622471 |
| 37 | 0.8753871156419 | 0.249225768716199 | 0.124612884358099 |
| 38 | 0.803812534967014 | 0.392374930065972 | 0.196187465032986 |
| 39 | 0.849642372627204 | 0.300715254745591 | 0.150357627372796 |
| 40 | 0.873516560460542 | 0.252966879078916 | 0.126483439539458 |
| Meta Analysis of Goldfeld-Quandt test for Heteroskedasticity | |||
| Description | # significant tests | % significant tests | OK/NOK |
| 1% type I error level | 0 | 0 | OK |
| 5% type I error level | 2 | 0.1 | NOK |
| 10% type I error level | 4 | 0.2 | NOK |