| Multiple Linear Regression - Estimated Regression Equation |
| Y[t] = -169.548966574492 + 0.255796082918873X[t] + 0.0207257906429053Y1[t] + 0.175892072127307Y2[t] + 320.150624530104M1[t] + 352.419180806125M2[t] -53.9281294197686M3[t] + 23.9260159457721M4[t] -86.3569691050612M5[t] + 97.5515370487508M6[t] + 273.292809663731M7[t] + 214.749768916847M8[t] + 411.976430473136M9[t] + 313.631950712519M10[t] + 891.257869708524M11[t] -3.16006754830636t + e[t] |
| Multiple Linear Regression - Ordinary Least Squares | |||||
| Variable | Parameter | S.D. | T-STAT H0: parameter = 0 | 2-tail p-value | 1-tail p-value |
| (Intercept) | -169.548966574492 | 331.386342 | -0.5116 | 0.611524 | 0.305762 |
| X | 0.255796082918873 | 0.03084 | 8.2942 | 0 | 0 |
| Y1 | 0.0207257906429053 | 0.067025 | 0.3092 | 0.758646 | 0.379323 |
| Y2 | 0.175892072127307 | 0.098885 | 1.7787 | 0.082351 | 0.041176 |
| M1 | 320.150624530104 | 156.234546 | 2.0492 | 0.046579 | 0.023289 |
| M2 | 352.419180806125 | 195.810666 | 1.7998 | 0.078912 | 0.039456 |
| M3 | -53.9281294197686 | 153.440499 | -0.3515 | 0.72696 | 0.36348 |
| M4 | 23.9260159457721 | 151.855534 | 0.1576 | 0.875543 | 0.437771 |
| M5 | -86.3569691050612 | 160.753804 | -0.5372 | 0.593899 | 0.296949 |
| M6 | 97.5515370487508 | 166.599475 | 0.5855 | 0.561242 | 0.280621 |
| M7 | 273.292809663731 | 204.91515 | 1.3337 | 0.189328 | 0.094664 |
| M8 | 214.749768916847 | 168.44607 | 1.2749 | 0.209195 | 0.104598 |
| M9 | 411.976430473136 | 152.580136 | 2.7001 | 0.009874 | 0.004937 |
| M10 | 313.631950712519 | 178.803776 | 1.7541 | 0.086546 | 0.043273 |
| M11 | 891.257869708524 | 150.593946 | 5.9183 | 0 | 0 |
| t | -3.16006754830636 | 2.2056 | -1.4327 | 0.159161 | 0.07958 |
| Multiple Linear Regression - Regression Statistics | |
| Multiple R | 0.942613397058808 |
| R-squared | 0.888520016314745 |
| Adjusted R-squared | 0.849631649912912 |
| F-TEST (value) | 22.8479645334977 |
| F-TEST (DF numerator) | 15 |
| F-TEST (DF denominator) | 43 |
| p-value | 1.11022302462516e-15 |
| Multiple Linear Regression - Residual Statistics | |
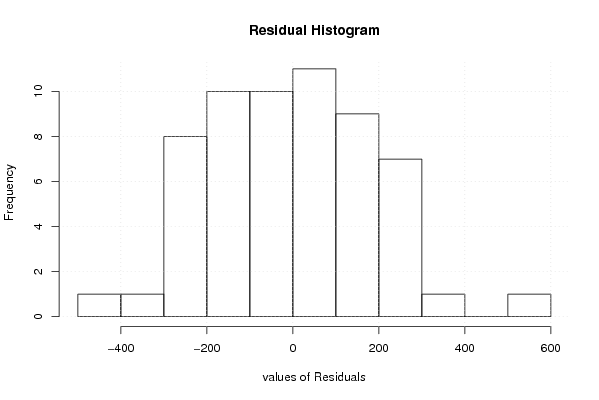
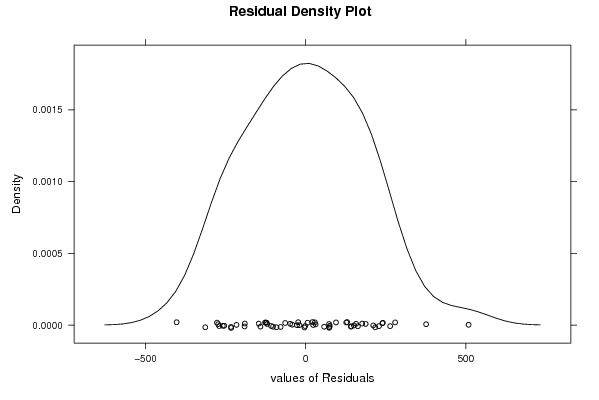
| Residual Standard Deviation | 218.394652553447 |
| Sum Squared Residuals | 2050937.64334946 |
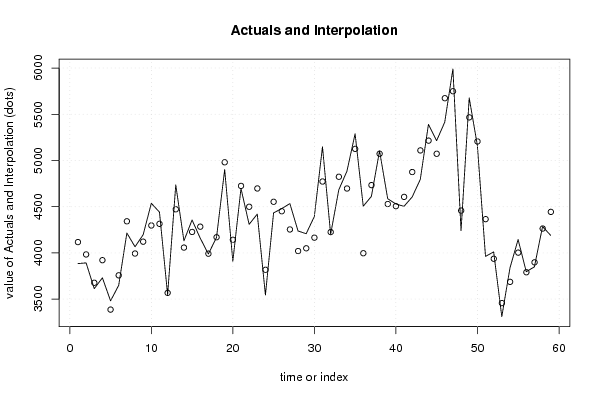
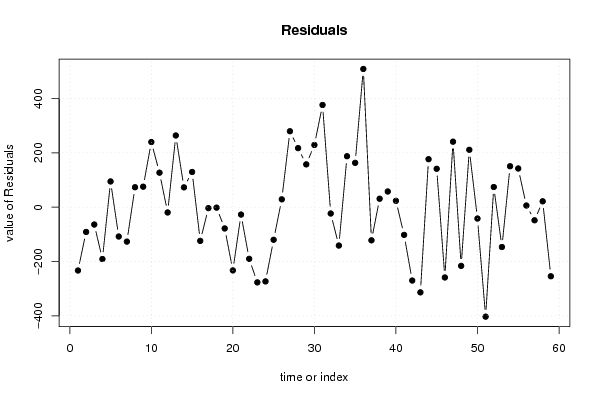
| Multiple Linear Regression - Actuals, Interpolation, and Residuals | |||
| Time or Index | Actuals | Interpolation Forecast | Residuals Prediction Error |
| 1 | 3884.3 | 4117.38148796651 | -233.081487966507 |
| 2 | 3892.2 | 3983.3303986875 | -91.1303986875024 |
| 3 | 3613 | 3676.86689874041 | -63.8668987404131 |
| 4 | 3730.5 | 3921.32152430992 | -190.821524309920 |
| 5 | 3481.3 | 3386.60845230406 | 94.6915476959427 |
| 6 | 3649.5 | 3757.44173092809 | -107.941730928087 |
| 7 | 4215.2 | 4341.90374988156 | -126.703749881557 |
| 8 | 4066.6 | 3993.2487666613 | 73.351233338696 |
| 9 | 4196.8 | 4121.39845100782 | 75.401548992177 |
| 10 | 4536.6 | 4296.85950225748 | 239.740497742519 |
| 11 | 4441.6 | 4314.66684451212 | 126.933155487878 |
| 12 | 3548.3 | 3567.72801715477 | -19.4280171547682 |
| 13 | 4735.9 | 4471.98364584697 | 263.916354153032 |
| 14 | 4130.6 | 4057.63449407374 | 72.9655059262573 |
| 15 | 4356.2 | 4226.56168672141 | 129.638313278585 |
| 16 | 4159.6 | 4283.61965580484 | -124.019655804843 |
| 17 | 3988 | 3991.56235637398 | -3.56235637398397 |
| 18 | 4167.8 | 4169.54013222942 | -1.74013222941856 |
| 19 | 4902.2 | 4980.49003167532 | -78.2900316753234 |
| 20 | 3909.4 | 4142.05715458062 | -232.657154580623 |
| 21 | 4697.6 | 4724.78575967602 | -27.1857596760217 |
| 22 | 4308.9 | 4498.99917264279 | -190.099172642794 |
| 23 | 4420.4 | 4697.22417950188 | -276.824179501877 |
| 24 | 3544.2 | 3817.42907779373 | -273.229077793728 |
| 25 | 4433 | 4553.03982384328 | -120.039823843285 |
| 26 | 4479.7 | 4450.8339968501 | 28.8660031499005 |
| 27 | 4533.2 | 4253.75053421142 | 279.449465788581 |
| 28 | 4237.5 | 4020.24822980012 | 217.251770199882 |
| 29 | 4207.4 | 4049.92462796085 | 157.475372039150 |
| 30 | 4394 | 4164.99663859589 | 229.003361404109 |
| 31 | 5148.4 | 4772.25190159187 | 376.148098408133 |
| 32 | 4202.2 | 4225.4933809926 | -23.2933809926006 |
| 33 | 4682.5 | 4823.75979044380 | -141.259790443795 |
| 34 | 4884.3 | 4696.85801374806 | 187.441986251941 |
| 35 | 5288.9 | 5125.77073530443 | 163.129264695569 |
| 36 | 4505.2 | 3996.48211418025 | 508.717885819751 |
| 37 | 4611.5 | 4733.45015660221 | -121.950156602211 |
| 38 | 5104 | 5072.91460966065 | 31.0853903393505 |
| 39 | 4586.6 | 4528.91944683760 | 57.6805531624048 |
| 40 | 4529.3 | 4505.89593847394 | 23.4040615260632 |
| 41 | 4504.1 | 4606.10195442988 | -102.001954429879 |
| 42 | 4604.9 | 4874.84912309456 | -269.949123094561 |
| 43 | 4795.4 | 5108.92948566271 | -313.52948566271 |
| 44 | 5391.1 | 5214.52006218029 | 176.579937819706 |
| 45 | 5213.9 | 5072.56920895445 | 141.330791045545 |
| 46 | 5415 | 5673.68346228286 | -258.683462282857 |
| 47 | 5990.3 | 5749.30084749589 | 240.999152504114 |
| 48 | 4241.8 | 4457.86079087126 | -216.060790871256 |
| 49 | 5677.6 | 5466.44488574103 | 211.155114258971 |
| 50 | 5164.2 | 5205.98650072801 | -41.7865007280059 |
| 51 | 3962.3 | 4365.20143348916 | -402.901433489158 |
| 52 | 4011 | 3936.81465161118 | 74.1853483888178 |
| 53 | 3310.3 | 3456.90260893123 | -146.602608931230 |
| 54 | 3837.3 | 3686.67237515204 | 150.627624847958 |
| 55 | 4145.3 | 4002.92483118854 | 142.375168811457 |
| 56 | 3796.7 | 3790.68063558518 | 6.01936441482239 |
| 57 | 3849.6 | 3897.88678991791 | -48.2867899179053 |
| 58 | 4285 | 4263.39984906881 | 21.6001509311903 |
| 59 | 4189.6 | 4443.83739318568 | -254.237393185684 |
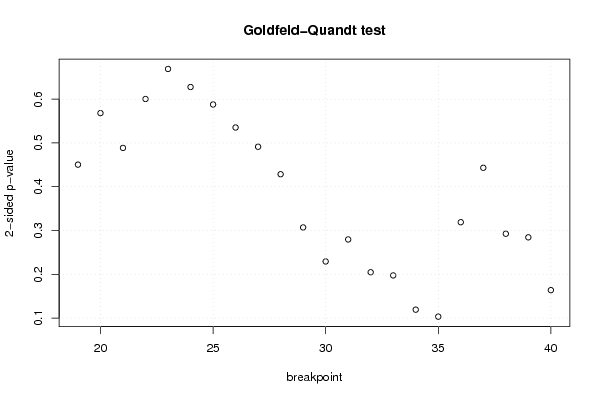
| Goldfeld-Quandt test for Heteroskedasticity | |||
| p-values | Alternative Hypothesis | ||
| breakpoint index | greater | 2-sided | less |
| 19 | 0.225225537374528 | 0.450451074749056 | 0.774774462625472 |
| 20 | 0.284092593344317 | 0.568185186688634 | 0.715907406655683 |
| 21 | 0.244329648484189 | 0.488659296968377 | 0.755670351515811 |
| 22 | 0.300232922010881 | 0.600465844021762 | 0.699767077989119 |
| 23 | 0.334515100023982 | 0.669030200047965 | 0.665484899976017 |
| 24 | 0.313868906733387 | 0.627737813466774 | 0.686131093266613 |
| 25 | 0.293927603235711 | 0.587855206471422 | 0.706072396764289 |
| 26 | 0.267639200126874 | 0.535278400253747 | 0.732360799873126 |
| 27 | 0.245657632933917 | 0.491315265867834 | 0.754342367066083 |
| 28 | 0.214272385725621 | 0.428544771451243 | 0.785727614274379 |
| 29 | 0.153480683708834 | 0.306961367417667 | 0.846519316291166 |
| 30 | 0.114639399228507 | 0.229278798457013 | 0.885360600771493 |
| 31 | 0.139782130726763 | 0.279564261453525 | 0.860217869273237 |
| 32 | 0.102310665905703 | 0.204621331811406 | 0.897689334094297 |
| 33 | 0.098695789670041 | 0.197391579340082 | 0.90130421032996 |
| 34 | 0.0595824742545773 | 0.119164948509155 | 0.940417525745423 |
| 35 | 0.0516022613640218 | 0.103204522728044 | 0.948397738635978 |
| 36 | 0.159481633865599 | 0.318963267731197 | 0.840518366134401 |
| 37 | 0.221626280614618 | 0.443252561229237 | 0.778373719385382 |
| 38 | 0.146284139778011 | 0.292568279556023 | 0.853715860221989 |
| 39 | 0.1422077594679 | 0.2844155189358 | 0.8577922405321 |
| 40 | 0.0818589607725494 | 0.163717921545099 | 0.91814103922745 |
| Meta Analysis of Goldfeld-Quandt test for Heteroskedasticity | |||
| Description | # significant tests | % significant tests | OK/NOK |
| 1% type I error level | 0 | 0 | OK |
| 5% type I error level | 0 | 0 | OK |
| 10% type I error level | 0 | 0 | OK |