| Multiple Linear Regression - Estimated Regression Equation |
| y[t] = + 5484.11077884567 -0.00781049557764782`y(t-1)`[t] -0.0500316807251145`y(t-2)`[t] -268.107247224368x[t] + 401.801063831282M1[t] -75.523500238954M2[t] + 154.704175856594M3[t] + 574.72547869741M4[t] -408.447191845174M5[t] -115.828867203763M6[t] -58.922860146829M7[t] + 265.168418851904M8[t] -366.321599785646M9[t] + 147.774113149871M10[t] + 226.205636064026M11[t] -17.5706708782829t + e[t] |
| Multiple Linear Regression - Ordinary Least Squares | |||||
| Variable | Parameter | S.D. | T-STAT H0: parameter = 0 | 2-tail p-value | 1-tail p-value |
| (Intercept) | 5484.11077884567 | 1294.085959 | 4.2378 | 0.000198 | 9.9e-05 |
| `y(t-1)` | -0.00781049557764782 | 0.17979 | -0.0434 | 0.965637 | 0.482818 |
| `y(t-2)` | -0.0500316807251145 | 0.170746 | -0.293 | 0.771525 | 0.385763 |
| x | -268.107247224368 | 306.975564 | -0.8734 | 0.389392 | 0.194696 |
| M1 | 401.801063831282 | 356.509648 | 1.127 | 0.268659 | 0.13433 |
| M2 | -75.523500238954 | 359.845362 | -0.2099 | 0.835182 | 0.417591 |
| M3 | 154.704175856594 | 373.005121 | 0.4148 | 0.681275 | 0.340638 |
| M4 | 574.72547869741 | 353.226212 | 1.6271 | 0.114181 | 0.05709 |
| M5 | -408.447191845174 | 357.62816 | -1.1421 | 0.262446 | 0.131223 |
| M6 | -115.828867203763 | 386.730221 | -0.2995 | 0.766618 | 0.383309 |
| M7 | -58.922860146829 | 360.07692 | -0.1636 | 0.871112 | 0.435556 |
| M8 | 265.168418851904 | 351.567771 | 0.7542 | 0.456582 | 0.228291 |
| M9 | -366.321599785646 | 347.164088 | -1.0552 | 0.299766 | 0.149883 |
| M10 | 147.774113149871 | 368.082993 | 0.4015 | 0.69092 | 0.34546 |
| M11 | 226.205636064026 | 379.880941 | 0.5955 | 0.555999 | 0.277999 |
| t | -17.5706708782829 | 11.076219 | -1.5863 | 0.123147 | 0.061574 |
| Multiple Linear Regression - Regression Statistics | |
| Multiple R | 0.780756628471302 |
| R-squared | 0.609580912901875 |
| Adjusted R-squared | 0.414371369352813 |
| F-TEST (value) | 3.12270036504987 |
| F-TEST (DF numerator) | 15 |
| F-TEST (DF denominator) | 30 |
| p-value | 0.00385443986214362 |
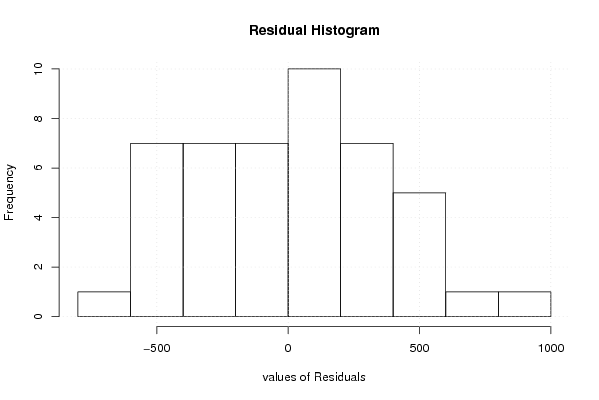
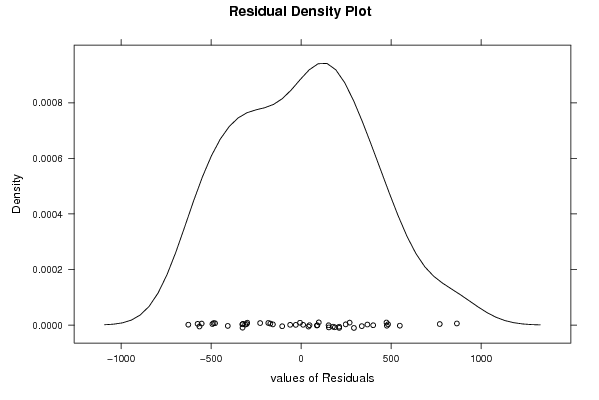
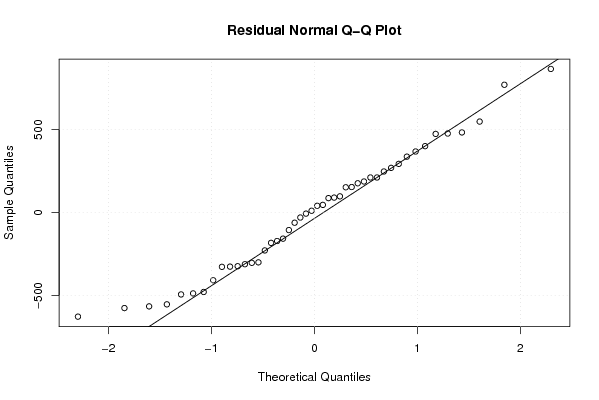
| Multiple Linear Regression - Residual Statistics | |
| Residual Standard Deviation | 453.338138876811 |
| Sum Squared Residuals | 6165464.04480872 |
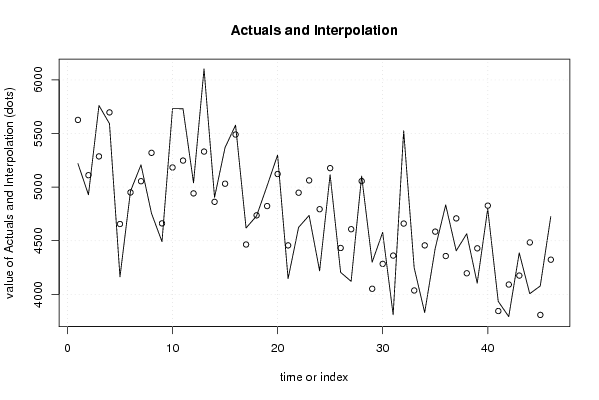
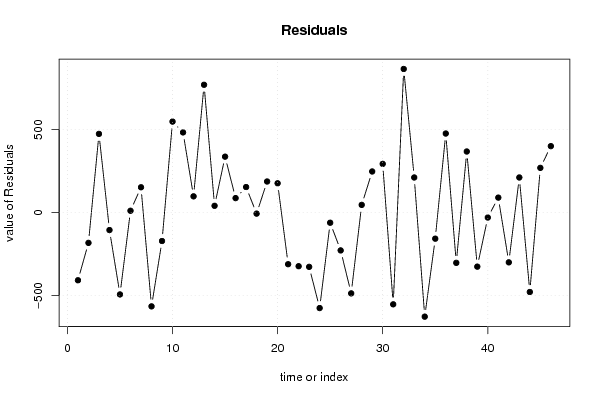
| Multiple Linear Regression - Actuals, Interpolation, and Residuals | |||
| Time or Index | Actuals | Interpolation Forecast | Residuals Prediction Error |
| 1 | 5219 | 5626.46723364111 | -407.467233641110 |
| 2 | 4929 | 5111.09264649887 | -182.092646498871 |
| 3 | 5761 | 5286.48966766081 | 474.510332339187 |
| 4 | 5592 | 5696.95115471303 | -104.951154713028 |
| 5 | 4163 | 4655.90142868149 | -492.901428681486 |
| 6 | 4962 | 4950.56563466762 | 11.4343653323818 |
| 7 | 5208 | 5055.15565663592 | 152.844343364082 |
| 8 | 4755 | 5319.7795699449 | -564.7795699449 |
| 9 | 4491 | 4661.94924146736 | -170.949241467363 |
| 10 | 5732 | 5183.20060572557 | 548.799394274427 |
| 11 | 5731 | 5247.57699646101 | 483.423003538986 |
| 12 | 5040 | 4941.71918423442 | 98.2808157655835 |
| 13 | 6102 | 5331.39666131229 | 770.603338687705 |
| 14 | 4904 | 4862.77857144137 | 41.2214285586316 |
| 15 | 5369 | 5031.65890543058 | 337.341094569416 |
| 16 | 5578 | 5490.4156104582 | 87.5843895418017 |
| 17 | 4619 | 4464.77514392442 | 154.224856075576 |
| 18 | 4731 | 4736.85644167497 | -5.85644167496751 |
| 19 | 5011 | 4823.29738416431 | 187.702615835693 |
| 20 | 5299 | 5122.0275052818 | 176.972494718197 |
| 21 | 4146 | 4456.70852243657 | -310.708522436575 |
| 22 | 4625 | 4947.829941846 | -322.829941846005 |
| 23 | 4736 | 5062.63609437624 | -326.63609437624 |
| 24 | 4219 | 4794.02764735748 | -575.027647357483 |
| 25 | 5116 | 5176.74254996364 | -60.7425499636383 |
| 26 | 4205 | 4432.60043219249 | -227.600432192485 |
| 27 | 4121 | 4607.49438127056 | -486.49438127056 |
| 28 | 5103 | 5056.1799560022 | 46.8200439978051 |
| 29 | 4300 | 4051.96936910499 | 248.030630895013 |
| 30 | 4578 | 4284.15774034490 | 293.842259655096 |
| 31 | 3809 | 4361.49719837524 | -552.497198375236 |
| 32 | 5526 | 4660.11527035332 | 865.884729646685 |
| 33 | 4248 | 4036.11832240827 | 211.881677591726 |
| 34 | 3830 | 4456.72078200872 | -626.720782008721 |
| 35 | 4428 | 4584.78690916275 | -156.786909162746 |
| 36 | 4834 | 4357.2531684081 | 476.746831591899 |
| 37 | 4406 | 4708.39355508296 | -302.393555082958 |
| 38 | 4565 | 4196.52834986728 | 368.471650132725 |
| 39 | 4104 | 4429.35704563804 | -325.357045638043 |
| 40 | 4798 | 4827.45327882658 | -29.4532788265789 |
| 41 | 3935 | 3844.3540582891 | 90.645941710898 |
| 42 | 3792 | 4091.42018331251 | -299.420183312510 |
| 43 | 4387 | 4175.04976082454 | 211.950239175461 |
| 44 | 4006 | 4484.07765441998 | -478.07765441998 |
| 45 | 4078 | 3808.22391368779 | 269.776086312212 |
| 46 | 4724 | 4323.2486704197 | 400.7513295803 |
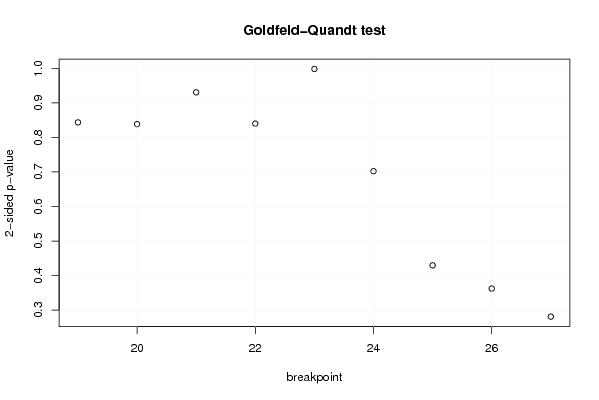
| Goldfeld-Quandt test for Heteroskedasticity | |||
| p-values | Alternative Hypothesis | ||
| breakpoint index | greater | 2-sided | less |
| 19 | 0.57819958748266 | 0.84360082503468 | 0.42180041251734 |
| 20 | 0.580636621940926 | 0.838726756118148 | 0.419363378059074 |
| 21 | 0.465380996011747 | 0.930761992023494 | 0.534619003988253 |
| 22 | 0.579912578763217 | 0.840174842473566 | 0.420087421236783 |
| 23 | 0.499205206192502 | 0.998410412385003 | 0.500794793807498 |
| 24 | 0.35114646989038 | 0.70229293978076 | 0.64885353010962 |
| 25 | 0.214834954356787 | 0.429669908713573 | 0.785165045643213 |
| 26 | 0.181201295978957 | 0.362402591957913 | 0.818798704021043 |
| 27 | 0.140514812572002 | 0.281029625144005 | 0.859485187427998 |
| Meta Analysis of Goldfeld-Quandt test for Heteroskedasticity | |||
| Description | # significant tests | % significant tests | OK/NOK |
| 1% type I error level | 0 | 0 | OK |
| 5% type I error level | 0 | 0 | OK |
| 10% type I error level | 0 | 0 | OK |