| Multiple Linear Regression - Estimated Regression Equation |
| Y[t] = + 527.153964987183 + 0.240954871069374X[t] + 0.0818613967871051`Yt-1`[t] + 0.219375924876468`Yt-2`[t] + 0.0732409941807161`Yt-3`[t] -0.203227371439877`Yt-4 `[t] -376.320123526623M1[t] -566.548733539981M2[t] -453.392933547681M3[t] -284.226352917444M4[t] -102.796221338208M5[t] -229.174297826116M6[t] -101.477955789942M7[t] -162.031792665541M8[t] + 492.054561282492M9[t] -489.494924058148M10[t] -27.2853312979341M11[t] -2.8468762610436t + e[t] |
| Multiple Linear Regression - Ordinary Least Squares | |||||
| Variable | Parameter | S.D. | T-STAT H0: parameter = 0 | 2-tail p-value | 1-tail p-value |
| (Intercept) | 527.153964987183 | 428.001027 | 1.2317 | 0.225449 | 0.112725 |
| X | 0.240954871069374 | 0.032074 | 7.5125 | 0 | 0 |
| `Yt-1` | 0.0818613967871051 | 0.084415 | 0.9697 | 0.338148 | 0.169074 |
| `Yt-2` | 0.219375924876468 | 0.112689 | 1.9467 | 0.058794 | 0.029397 |
| `Yt-3` | 0.0732409941807161 | 0.109214 | 0.6706 | 0.506414 | 0.253207 |
| `Yt-4 ` | -0.203227371439877 | 0.121176 | -1.6771 | 0.101516 | 0.050758 |
| M1 | -376.320123526623 | 223.342297 | -1.6849 | 0.099986 | 0.049993 |
| M2 | -566.548733539981 | 229.555998 | -2.468 | 0.018078 | 0.009039 |
| M3 | -453.392933547681 | 163.563729 | -2.772 | 0.008497 | 0.004249 |
| M4 | -284.226352917444 | 175.825767 | -1.6165 | 0.114043 | 0.057021 |
| M5 | -102.796221338208 | 172.235645 | -0.5968 | 0.554067 | 0.277033 |
| M6 | -229.174297826116 | 207.469621 | -1.1046 | 0.276095 | 0.138047 |
| M7 | -101.477955789942 | 234.645415 | -0.4325 | 0.667779 | 0.33389 |
| M8 | -162.031792665541 | 175.801986 | -0.9217 | 0.362366 | 0.181183 |
| M9 | 492.054561282492 | 198.937744 | 2.4734 | 0.017844 | 0.008922 |
| M10 | -489.494924058148 | 222.378604 | -2.2012 | 0.033709 | 0.016854 |
| M11 | -27.2853312979341 | 202.411735 | -0.1348 | 0.893462 | 0.446731 |
| t | -2.8468762610436 | 2.323603 | -1.2252 | 0.227848 | 0.113924 |
| Multiple Linear Regression - Regression Statistics | |
| Multiple R | 0.947855213102673 |
| R-squared | 0.898429505005913 |
| Adjusted R-squared | 0.854155186675157 |
| F-TEST (value) | 20.2923396424559 |
| F-TEST (DF numerator) | 17 |
| F-TEST (DF denominator) | 39 |
| p-value | 2.86437540353290e-14 |
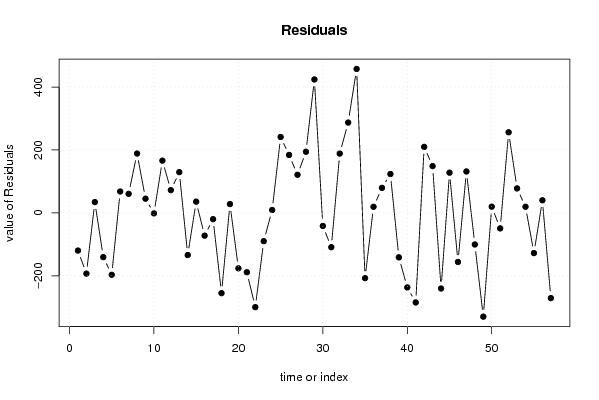
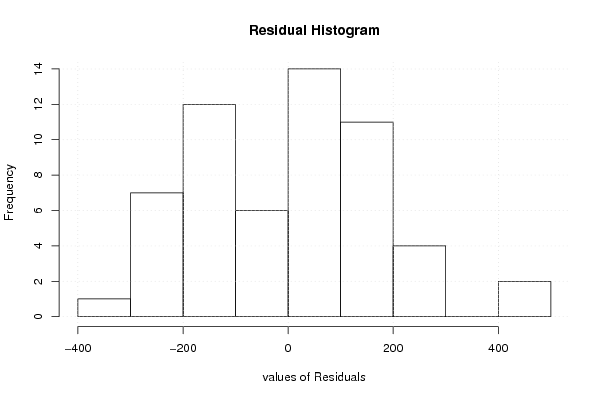
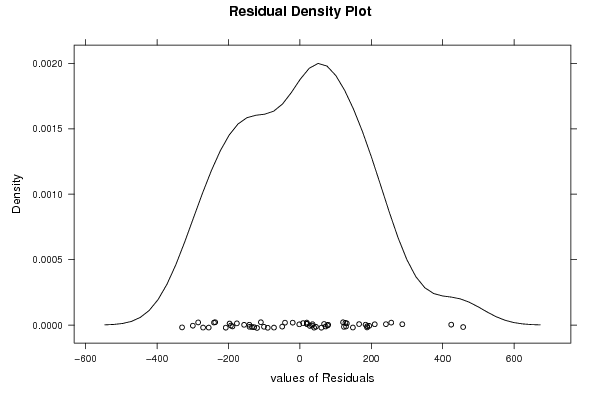
| Multiple Linear Regression - Residual Statistics | |
| Residual Standard Deviation | 215.815377171798 |
| Sum Squared Residuals | 1816474.80392841 |
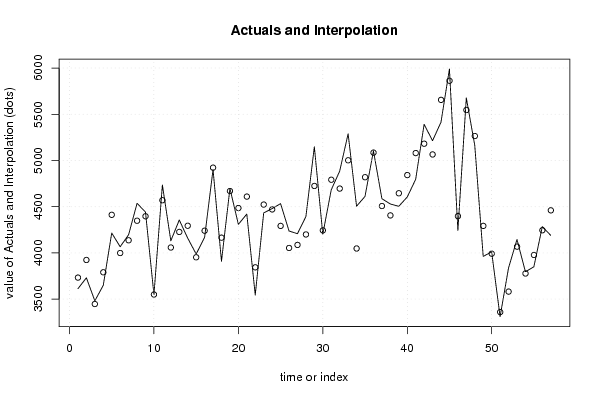
| Multiple Linear Regression - Actuals, Interpolation, and Residuals | |||
| Time or Index | Actuals | Interpolation Forecast | Residuals Prediction Error |
| 1 | 3613 | 3732.86246543437 | -119.862465434367 |
| 2 | 3730.5 | 3923.62816530057 | -193.128165300567 |
| 3 | 3481.3 | 3447.12379137854 | 34.1762086214585 |
| 4 | 3649.5 | 3790.30605815103 | -140.806058151032 |
| 5 | 4215.2 | 4412.03222326646 | -196.832223266460 |
| 6 | 4066.6 | 3998.74740039856 | 67.8525996014425 |
| 7 | 4196.8 | 4136.38765139644 | 60.4123486035631 |
| 8 | 4536.6 | 4348.03457548654 | 188.565424513461 |
| 9 | 4441.6 | 4396.59215607707 | 45.0078439229288 |
| 10 | 3548.3 | 3549.85117744227 | -1.55117744227235 |
| 11 | 4735.9 | 4569.93326978164 | 165.966730218363 |
| 12 | 4130.6 | 4058.45334927771 | 72.1466507222936 |
| 13 | 4356.2 | 4226.86565412097 | 129.334345879032 |
| 14 | 4159.6 | 4293.72933518343 | -134.129335183434 |
| 15 | 3988 | 3952.44542648268 | 35.5545735173243 |
| 16 | 4167.8 | 4240.25557452122 | -72.4555745212196 |
| 17 | 4902.2 | 4922.25190030101 | -20.0519003010127 |
| 18 | 3909.4 | 4164.68032458006 | -255.280324580062 |
| 19 | 4697.6 | 4669.66054484290 | 27.9394551571036 |
| 20 | 4308.9 | 4485.22566579919 | -176.325665799188 |
| 21 | 4420.4 | 4609.14007036491 | -188.740070364910 |
| 22 | 3544.2 | 3843.94060341878 | -299.740603418783 |
| 23 | 4433 | 4523.02311663451 | -90.0231166345052 |
| 24 | 4479.7 | 4470.61085277177 | 9.08914722822901 |
| 25 | 4533.2 | 4292.11266107063 | 241.087338929375 |
| 26 | 4237.5 | 4053.42147700109 | 184.078522998910 |
| 27 | 4207.4 | 4086.37110232052 | 121.028897679482 |
| 28 | 4394 | 4199.67304744946 | 194.326952550539 |
| 29 | 5148.4 | 4724.40286751344 | 423.997132486556 |
| 30 | 4202.2 | 4243.81941451376 | -41.6194145137602 |
| 31 | 4682.5 | 4791.63849824442 | -109.138498244420 |
| 32 | 4884.3 | 4695.96031187812 | 188.339688121877 |
| 33 | 5288.9 | 5001.88640020074 | 287.013599799263 |
| 34 | 4505.2 | 4047.81787133411 | 457.382128665892 |
| 35 | 4611.5 | 4819.01125403667 | -207.511254036666 |
| 36 | 5104 | 5084.71990364185 | 19.28009635815 |
| 37 | 4586.6 | 4507.22621708191 | 79.3737829180911 |
| 38 | 4529.3 | 4405.77487312435 | 123.525126875648 |
| 39 | 4504.1 | 4645.4846927837 | -141.384692783701 |
| 40 | 4604.9 | 4841.97604959047 | -237.076049590472 |
| 41 | 4795.4 | 5080.18846632577 | -284.788466325774 |
| 42 | 5391.1 | 5181.38733059569 | 209.712669404312 |
| 43 | 5213.9 | 5065.29701784031 | 148.602982159690 |
| 44 | 5415 | 5655.4803519969 | -240.480351996901 |
| 45 | 5990.3 | 5862.58043996156 | 127.719560038441 |
| 46 | 4241.8 | 4397.89034780484 | -156.090347804836 |
| 47 | 5677.6 | 5546.03235954719 | 131.567640452809 |
| 48 | 5164.2 | 5264.71589430867 | -100.515894308673 |
| 49 | 3962.3 | 4292.23300229213 | -329.933002292131 |
| 50 | 4011 | 3991.34614939056 | 19.653850609443 |
| 51 | 3310.3 | 3359.67498703456 | -49.3749870345644 |
| 52 | 3837.3 | 3581.28927028782 | 256.010729712184 |
| 53 | 4145.3 | 4067.62454259331 | 77.6754574066904 |
| 54 | 3796.7 | 3777.36552991193 | 19.3344700880675 |
| 55 | 3849.6 | 3977.41628767594 | -127.816287675937 |
| 56 | 4285 | 4245.09909483925 | 39.9009051607516 |
| 57 | 4189.6 | 4460.60093339572 | -271.000933395723 |
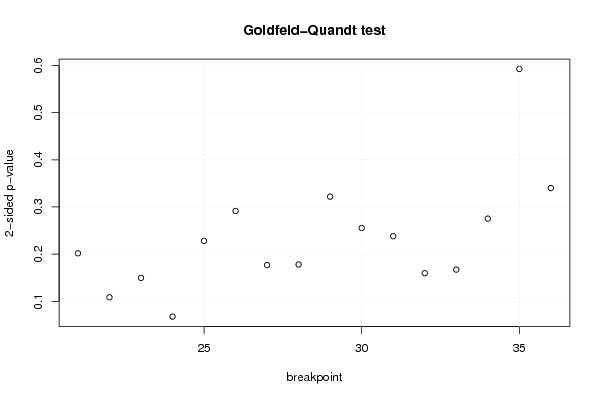
| Goldfeld-Quandt test for Heteroskedasticity | |||
| p-values | Alternative Hypothesis | ||
| breakpoint index | greater | 2-sided | less |
| 21 | 0.100915725245131 | 0.201831450490261 | 0.89908427475487 |
| 22 | 0.0543106822916586 | 0.108621364583317 | 0.945689317708341 |
| 23 | 0.074827835922145 | 0.14965567184429 | 0.925172164077855 |
| 24 | 0.0337921911658902 | 0.0675843823317803 | 0.96620780883411 |
| 25 | 0.11406806267476 | 0.22813612534952 | 0.88593193732524 |
| 26 | 0.145769400869119 | 0.291538801738237 | 0.854230599130881 |
| 27 | 0.0884385642329883 | 0.176877128465977 | 0.911561435767012 |
| 28 | 0.0890531313810226 | 0.178106262762045 | 0.910946868618977 |
| 29 | 0.16090955106892 | 0.32181910213784 | 0.83909044893108 |
| 30 | 0.127717230572220 | 0.255434461144441 | 0.87228276942778 |
| 31 | 0.118998308490131 | 0.237996616980262 | 0.881001691509869 |
| 32 | 0.079788830147394 | 0.159577660294788 | 0.920211169852606 |
| 33 | 0.0836273078149583 | 0.167254615629917 | 0.916372692185042 |
| 34 | 0.137651371888914 | 0.275302743777828 | 0.862348628111086 |
| 35 | 0.296204840467894 | 0.592409680935789 | 0.703795159532106 |
| 36 | 0.169951534002777 | 0.339903068005554 | 0.830048465997223 |
| Meta Analysis of Goldfeld-Quandt test for Heteroskedasticity | |||
| Description | # significant tests | % significant tests | OK/NOK |
| 1% type I error level | 0 | 0 | OK |
| 5% type I error level | 0 | 0 | OK |
| 10% type I error level | 1 | 0.0625 | OK |