| Multiple Linear Regression - Estimated Regression Equation |
| Yt[t] = + 247.380841890874 -1.77464261498657Xt[t] + 78.1125743122356M1[t] + 65.7367308094882M2[t] + 80.5308594646116M3[t] + 68.6751867579987M4[t] + 48.8929798102284M5[t] + 54.0815320866646M6[t] + 32.8446193529302M7[t] + 20.7564387499451M8[t] + 28.3924274457508M9[t] + 45.068078292647M10[t] + 25.0159548712641M11[t] + 0.158264129372544t + e[t] |
| Multiple Linear Regression - Ordinary Least Squares | |||||
| Variable | Parameter | S.D. | T-STAT H0: parameter = 0 | 2-tail p-value | 1-tail p-value |
| (Intercept) | 247.380841890874 | 262.863954 | 0.9411 | 0.351571 | 0.175785 |
| Xt | -1.77464261498657 | 2.47651 | -0.7166 | 0.47725 | 0.238625 |
| M1 | 78.1125743122356 | 6.167986 | 12.6642 | 0 | 0 |
| M2 | 65.7367308094882 | 6.145482 | 10.6968 | 0 | 0 |
| M3 | 80.5308594646116 | 6.171861 | 13.0481 | 0 | 0 |
| M4 | 68.6751867579987 | 6.145933 | 11.1741 | 0 | 0 |
| M5 | 48.8929798102284 | 6.122277 | 7.9861 | 0 | 0 |
| M6 | 54.0815320866646 | 6.117187 | 8.8409 | 0 | 0 |
| M7 | 32.8446193529302 | 6.110394 | 5.3752 | 2e-06 | 1e-06 |
| M8 | 20.7564387499451 | 6.106396 | 3.3991 | 0.001406 | 0.000703 |
| M9 | 28.3924274457508 | 6.104948 | 4.6507 | 2.8e-05 | 1.4e-05 |
| M10 | 45.068078292647 | 6.102417 | 7.3853 | 0 | 0 |
| M11 | 25.0159548712641 | 6.098994 | 4.1017 | 0.000166 | 8.3e-05 |
| t | 0.158264129372544 | 0.264939 | 0.5974 | 0.553196 | 0.276598 |
| Multiple Linear Regression - Regression Statistics | |
| Multiple R | 0.943285641139972 |
| R-squared | 0.889787800780848 |
| Adjusted R-squared | 0.858640874914566 |
| F-TEST (value) | 28.5674356628588 |
| F-TEST (DF numerator) | 13 |
| F-TEST (DF denominator) | 46 |
| p-value | 0 |
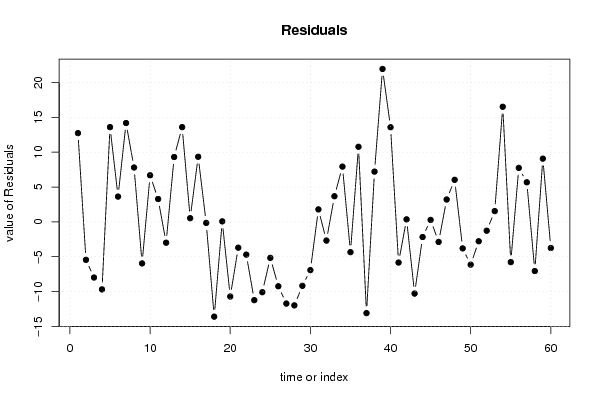
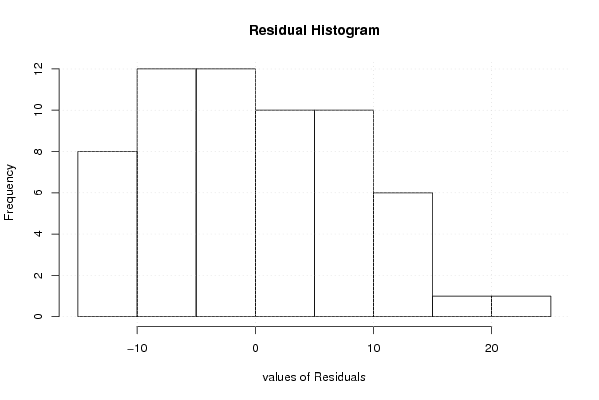
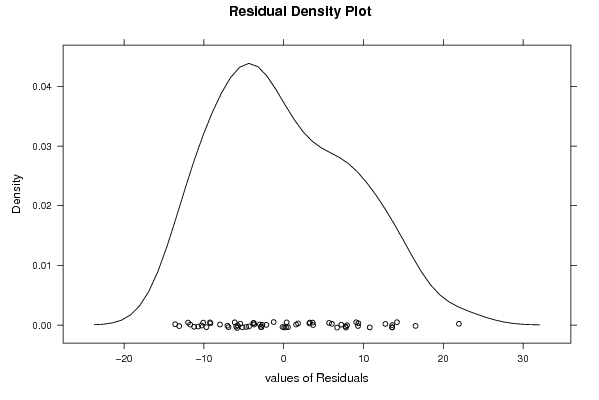
| Multiple Linear Regression - Residual Statistics | |
| Residual Standard Deviation | 9.64255873554797 |
| Sum Squared Residuals | 4277.03119255066 |
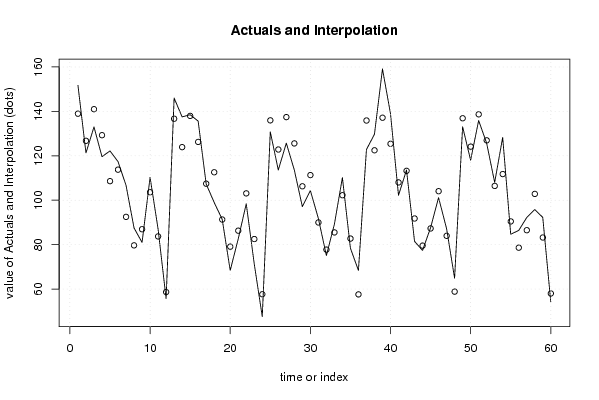
| Multiple Linear Regression - Actuals, Interpolation, and Residuals | |||
| Time or Index | Actuals | Interpolation Forecast | Residuals Prediction Error |
| 1 | 151.7 | 138.959277235895 | 12.7407227641054 |
| 2 | 121.3 | 126.741697862520 | -5.44169786251965 |
| 3 | 133 | 140.984233601021 | -7.98423360102095 |
| 4 | 119.6 | 129.286825023781 | -9.68682502378063 |
| 5 | 122.2 | 108.598096636391 | 13.6019033636092 |
| 6 | 117.4 | 113.767448780701 | 3.63255121929910 |
| 7 | 106.7 | 92.5113359148405 | 14.1886640851595 |
| 8 | 87.5 | 79.6940981337347 | 7.80590186626531 |
| 9 | 81 | 86.9559581744169 | -5.95595817441691 |
| 10 | 110.3 | 103.612408889187 | 6.68759111081307 |
| 11 | 87 | 83.7185495971766 | 3.28145040282337 |
| 12 | 55.7 | 58.6833945937864 | -2.98339459378642 |
| 13 | 146 | 136.688036643147 | 9.31196335685345 |
| 14 | 137.5 | 123.902571632976 | 13.597428367024 |
| 15 | 138.5 | 137.967643109979 | 0.532356890021326 |
| 16 | 135.6 | 126.252488106589 | 9.3475118934115 |
| 17 | 107.3 | 107.444880891084 | -0.144880891084483 |
| 18 | 99 | 112.596486609245 | -13.5964866092447 |
| 19 | 91.4 | 91.3226273172343 | 0.0773726827656793 |
| 20 | 68.4 | 79.108768025224 | -10.7087680252240 |
| 21 | 82.6 | 86.2996423613068 | -3.69964236130678 |
| 22 | 98.4 | 103.098064485276 | -4.69806448527572 |
| 23 | 71.3 | 82.5298409995705 | -11.2298409995705 |
| 24 | 47.6 | 57.6898966838288 | -10.0898966838288 |
| 25 | 130.8 | 135.960735125437 | -5.16073512543691 |
| 26 | 113.6 | 122.838088018419 | -9.23808801841893 |
| 27 | 125.7 | 137.417805853768 | -11.7178058537677 |
| 28 | 113.6 | 125.578425867328 | -11.9784258673285 |
| 29 | 97.1 | 106.273918719628 | -9.17391871962822 |
| 30 | 104.4 | 111.319045880889 | -6.91904588088926 |
| 31 | 91.8 | 90.0096937365792 | 1.79030626342085 |
| 32 | 75.1 | 77.778088018419 | -2.67808801841894 |
| 33 | 89.2 | 85.5191015651476 | 3.68089843485243 |
| 34 | 110.2 | 102.264284410667 | 7.93571558933307 |
| 35 | 78.4 | 82.7431000678038 | -4.34310006780376 |
| 36 | 68.4 | 57.6192129336643 | 10.7807870663358 |
| 37 | 122.8 | 135.890051375272 | -13.0900513752724 |
| 38 | 129.7 | 122.483461449857 | 7.21653855014348 |
| 39 | 159.1 | 137.151911415955 | 21.9480885840454 |
| 40 | 139 | 125.419009986415 | 13.5809900135854 |
| 41 | 102.2 | 108.031116862900 | -5.83111686289982 |
| 42 | 113.6 | 113.235961859510 | 0.364038140490366 |
| 43 | 81.5 | 91.7846383060006 | -10.2846383060006 |
| 44 | 77.4 | 79.5707790139903 | -2.17077901399025 |
| 45 | 87.6 | 87.311792560719 | 0.288207439281084 |
| 46 | 101.2 | 104.074721832388 | -2.87472183238813 |
| 47 | 87.2 | 83.9856518527292 | 3.21434814727076 |
| 48 | 64.9 | 58.8617647185897 | 6.03823528141027 |
| 49 | 133.1 | 136.901899620250 | -3.8018996202496 |
| 50 | 118 | 124.134181036229 | -6.1341810362289 |
| 51 | 135.9 | 138.678406019278 | -2.77840601927798 |
| 52 | 125.7 | 126.963251015888 | -1.26325101588779 |
| 53 | 108 | 106.451986889997 | 1.54801311000334 |
| 54 | 128.3 | 111.781056869656 | 16.5189431303445 |
| 55 | 84.7 | 90.4717047253454 | -5.77170472534544 |
| 56 | 86.4 | 78.6482668086321 | 7.75173319136786 |
| 57 | 92.2 | 86.5135053384098 | 5.68649466159017 |
| 58 | 95.8 | 102.850520382482 | -7.05052038248228 |
| 59 | 92.3 | 83.2228574827199 | 9.0771425172801 |
| 60 | 54.3 | 58.0457310701308 | -3.74573107013079 |
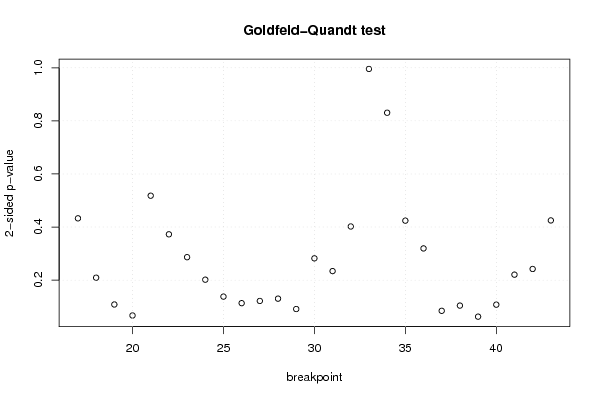
| Goldfeld-Quandt test for Heteroskedasticity | |||
| p-values | Alternative Hypothesis | ||
| breakpoint index | greater | 2-sided | less |
| 17 | 0.216429971759887 | 0.432859943519774 | 0.783570028240113 |
| 18 | 0.104564506953540 | 0.209129013907079 | 0.89543549304646 |
| 19 | 0.0541140938956981 | 0.108228187791396 | 0.945885906104302 |
| 20 | 0.0334247402823049 | 0.0668494805646097 | 0.966575259717695 |
| 21 | 0.259038010175747 | 0.518076020351493 | 0.740961989824253 |
| 22 | 0.186319109823230 | 0.372638219646459 | 0.81368089017677 |
| 23 | 0.143237867082294 | 0.286475734164588 | 0.856762132917706 |
| 24 | 0.100827552130177 | 0.201655104260353 | 0.899172447869823 |
| 25 | 0.068930099092351 | 0.137860198184702 | 0.931069900907649 |
| 26 | 0.0566050765816964 | 0.113210153163393 | 0.943394923418304 |
| 27 | 0.060780564506705 | 0.12156112901341 | 0.939219435493295 |
| 28 | 0.065116785863892 | 0.130233571727784 | 0.934883214136108 |
| 29 | 0.0455646093874829 | 0.0911292187749659 | 0.954435390612517 |
| 30 | 0.141047999970787 | 0.282095999941575 | 0.858952000029213 |
| 31 | 0.117013039181407 | 0.234026078362814 | 0.882986960818593 |
| 32 | 0.201073127543708 | 0.402146255087416 | 0.798926872456292 |
| 33 | 0.502199229976008 | 0.995601540047983 | 0.497800770023992 |
| 34 | 0.584692248936274 | 0.830615502127451 | 0.415307751063726 |
| 35 | 0.787962707135546 | 0.424074585728908 | 0.212037292864454 |
| 36 | 0.840234919535031 | 0.319530160929937 | 0.159765080464969 |
| 37 | 0.957786161255727 | 0.0844276774885454 | 0.0422138387442727 |
| 38 | 0.947951486291878 | 0.104097027416245 | 0.0520485137081223 |
| 39 | 0.96878761837345 | 0.0624247632530994 | 0.0312123816265497 |
| 40 | 0.946224573400444 | 0.107550853199112 | 0.0537754265995561 |
| 41 | 0.889695624402324 | 0.220608751195353 | 0.110304375597676 |
| 42 | 0.878928973320536 | 0.242142053358927 | 0.121071026679464 |
| 43 | 0.787526801025403 | 0.424946397949195 | 0.212473198974597 |
| Meta Analysis of Goldfeld-Quandt test for Heteroskedasticity | |||
| Description | # significant tests | % significant tests | OK/NOK |
| 1% type I error level | 0 | 0 | OK |
| 5% type I error level | 0 | 0 | OK |
| 10% type I error level | 4 | 0.148148148148148 | NOK |