| Multiple Linear Regression - Estimated Regression Equation |
| Y[t] = + 16.3381031035382 -0.0223985047378945X[t] + e[t] |
| Multiple Linear Regression - Ordinary Least Squares | |||||
| Variable | Parameter | S.D. | T-STAT H0: parameter = 0 | 2-tail p-value | 1-tail p-value |
| (Intercept) | 16.3381031035382 | 2.625954 | 6.2218 | 0 | 0 |
| X | -0.0223985047378945 | 0.203793 | -0.1099 | 0.912862 | 0.456431 |
| Multiple Linear Regression - Regression Statistics | |
| Multiple R | 0.0144301357461699 |
| R-squared | 0.000208228817652892 |
| Adjusted R-squared | -0.0170295603406634 |
| F-TEST (value) | 0.0120797867835872 |
| F-TEST (DF numerator) | 1 |
| F-TEST (DF denominator) | 58 |
| p-value | 0.91286168172439 |
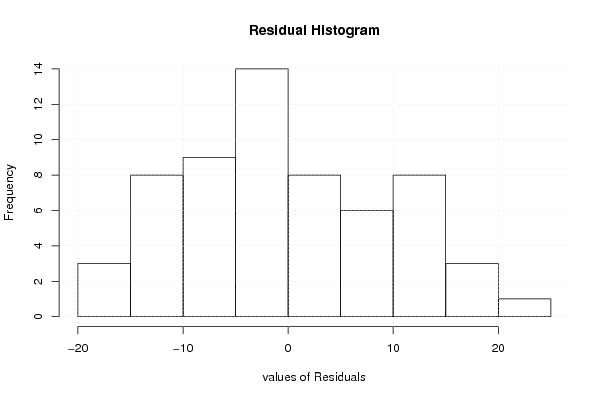
| Multiple Linear Regression - Residual Statistics | |
| Residual Standard Deviation | 9.77484659466084 |
| Sum Squared Residuals | 5541.76230505086 |
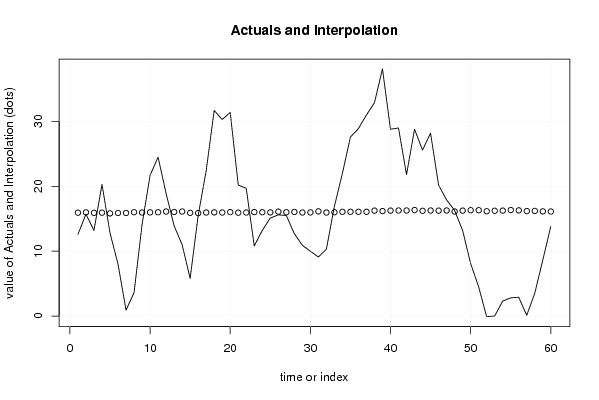
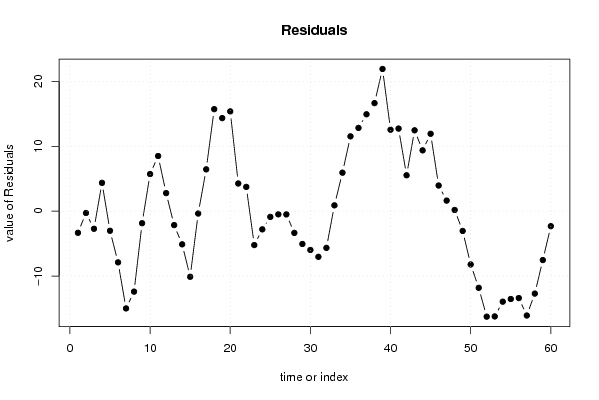
| Multiple Linear Regression - Actuals, Interpolation, and Residuals | |||
| Time or Index | Actuals | Interpolation Forecast | Residuals Prediction Error |
| 1 | 12.6 | 15.9349300182561 | -3.33493001825614 |
| 2 | 15.7 | 15.9797270277319 | -0.27972702773189 |
| 3 | 13.2 | 15.9125315135182 | -2.71253151351821 |
| 4 | 20.3 | 15.9349300182561 | 4.36506998174390 |
| 5 | 12.8 | 15.8229374945666 | -3.02293749456663 |
| 6 | 8 | 15.8901330087803 | -7.89013300878032 |
| 7 | 0.9 | 15.8901330087803 | -14.9901330087803 |
| 8 | 3.6 | 16.0021255324698 | -12.4021255324698 |
| 9 | 14.1 | 15.957328522994 | -1.857328522994 |
| 10 | 21.7 | 15.9797270277319 | 5.7202729722681 |
| 11 | 24.5 | 16.0021255324698 | 8.49787446753021 |
| 12 | 18.9 | 16.1141180561593 | 2.78588194384074 |
| 13 | 13.9 | 16.0469225419456 | -2.14692254194558 |
| 14 | 11 | 16.1141180561593 | -5.11411805615926 |
| 15 | 5.8 | 15.9125315135182 | -10.1125315135182 |
| 16 | 15.5 | 15.8677345040424 | -0.367734504042422 |
| 17 | 22.4 | 15.957328522994 | 6.442671477006 |
| 18 | 31.7 | 15.9797270277319 | 15.7202729722681 |
| 19 | 30.3 | 15.957328522994 | 14.342671477006 |
| 20 | 31.4 | 16.0245240372077 | 15.3754759627923 |
| 21 | 20.2 | 15.9349300182561 | 4.26506998174389 |
| 22 | 19.7 | 15.957328522994 | 3.742671477006 |
| 23 | 10.8 | 16.0245240372077 | -5.22452403720768 |
| 24 | 13.2 | 16.0021255324698 | -2.80212553246979 |
| 25 | 15.1 | 15.9797270277319 | -0.879727027731895 |
| 26 | 15.6 | 16.0917195514214 | -0.491719551421368 |
| 27 | 15.5 | 16.0021255324698 | -0.502125532469789 |
| 28 | 12.7 | 16.0469225419456 | -3.34692254194558 |
| 29 | 10.9 | 15.957328522994 | -5.057328522994 |
| 30 | 10 | 15.9797270277319 | -5.9797270277319 |
| 31 | 9.1 | 16.1365165608972 | -7.03651656089716 |
| 32 | 10.3 | 15.957328522994 | -5.657328522994 |
| 33 | 16.9 | 16.0021255324698 | 0.897874467530209 |
| 34 | 22 | 16.0693210466835 | 5.93067895331653 |
| 35 | 27.6 | 16.0693210466835 | 11.5306789533165 |
| 36 | 28.9 | 16.0693210466835 | 12.8306789533165 |
| 37 | 31 | 16.0693210466835 | 14.9306789533165 |
| 38 | 32.9 | 16.2485090845866 | 16.6514909154134 |
| 39 | 38.1 | 16.1813135703729 | 21.9186864296271 |
| 40 | 28.8 | 16.2485090845866 | 12.5514909154134 |
| 41 | 29 | 16.2709075893245 | 12.7290924106755 |
| 42 | 21.8 | 16.2709075893245 | 5.52909241067548 |
| 43 | 28.8 | 16.3381031035382 | 12.4618968964618 |
| 44 | 25.6 | 16.2261105798487 | 9.37388942015127 |
| 45 | 28.2 | 16.2709075893245 | 11.9290924106755 |
| 46 | 20.2 | 16.2485090845866 | 3.95149091541337 |
| 47 | 17.9 | 16.2709075893245 | 1.62909241067547 |
| 48 | 16.3 | 16.1141180561593 | 0.185881943840738 |
| 49 | 13.2 | 16.2485090845866 | -3.04850908458663 |
| 50 | 8.1 | 16.3157045988003 | -8.21570459880031 |
| 51 | 4.5 | 16.3157045988003 | -11.8157045988003 |
| 52 | -0.1 | 16.1589150656350 | -16.2589150656351 |
| 53 | 0 | 16.2261105798487 | -16.2261105798487 |
| 54 | 2.3 | 16.2485090845866 | -13.9485090845866 |
| 55 | 2.8 | 16.3381031035382 | -13.5381031035382 |
| 56 | 2.9 | 16.2933060940624 | -13.3933060940624 |
| 57 | 0.1 | 16.1813135703729 | -16.0813135703729 |
| 58 | 3.5 | 16.2037120751108 | -12.7037120751108 |
| 59 | 8.6 | 16.1365165608972 | -7.53651656089716 |
| 60 | 13.8 | 16.1141180561593 | -2.31411805615926 |
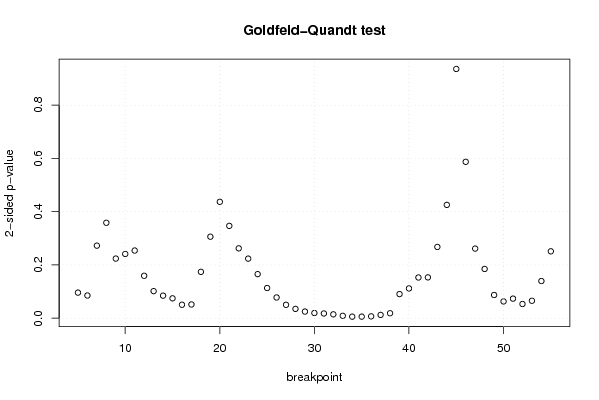
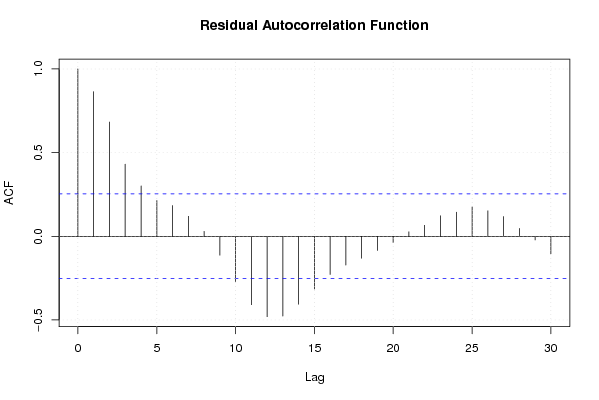
| Goldfeld-Quandt test for Heteroskedasticity | |||
| p-values | Alternative Hypothesis | ||
| breakpoint index | greater | 2-sided | less |
| 5 | 0.0479969243628798 | 0.0959938487257597 | 0.95200307563712 |
| 6 | 0.0425829529105371 | 0.0851659058210742 | 0.957417047089463 |
| 7 | 0.136165740584832 | 0.272331481169665 | 0.863834259415168 |
| 8 | 0.179109584571582 | 0.358219169143164 | 0.820890415428418 |
| 9 | 0.111895721287303 | 0.223791442574606 | 0.888104278712697 |
| 10 | 0.120569295625676 | 0.241138591251352 | 0.879430704374324 |
| 11 | 0.126991441958739 | 0.253982883917478 | 0.873008558041261 |
| 12 | 0.0795711852848176 | 0.159142370569635 | 0.920428814715182 |
| 13 | 0.0507390852357371 | 0.101478170471474 | 0.949260914764263 |
| 14 | 0.0423179586592831 | 0.0846359173185663 | 0.957682041340717 |
| 15 | 0.0372781151676596 | 0.0745562303353192 | 0.96272188483234 |
| 16 | 0.0252087320213632 | 0.0504174640427265 | 0.974791267978637 |
| 17 | 0.0257522748187763 | 0.0515045496375527 | 0.974247725181224 |
| 18 | 0.086977246541168 | 0.173954493082336 | 0.913022753458832 |
| 19 | 0.152964513520119 | 0.305929027040238 | 0.847035486479881 |
| 20 | 0.218477246901837 | 0.436954493803675 | 0.781522753098163 |
| 21 | 0.173325412388386 | 0.346650824776772 | 0.826674587611614 |
| 22 | 0.131119401336548 | 0.262238802673097 | 0.868880598663452 |
| 23 | 0.111773711634645 | 0.223547423269291 | 0.888226288365355 |
| 24 | 0.0826879777859096 | 0.165375955571819 | 0.91731202221409 |
| 25 | 0.0566229398369335 | 0.113245879673867 | 0.943377060163066 |
| 26 | 0.0388791628474526 | 0.0777583256949052 | 0.961120837152547 |
| 27 | 0.0250601048982752 | 0.0501202097965504 | 0.974939895101725 |
| 28 | 0.0174524351866797 | 0.0349048703733595 | 0.98254756481332 |
| 29 | 0.0124238428855349 | 0.0248476857710698 | 0.987576157114465 |
| 30 | 0.0096639673065342 | 0.0193279346130684 | 0.990336032693466 |
| 31 | 0.00883831973226955 | 0.0176766394645391 | 0.99116168026773 |
| 32 | 0.00720438611631419 | 0.0144087722326284 | 0.992795613883686 |
| 33 | 0.00443836947233736 | 0.00887673894467473 | 0.995561630527663 |
| 34 | 0.0028583516466127 | 0.0057167032932254 | 0.997141648353387 |
| 35 | 0.00290495034277539 | 0.00580990068555078 | 0.997095049657225 |
| 36 | 0.00341726715843991 | 0.00683453431687982 | 0.99658273284156 |
| 37 | 0.00611363862089939 | 0.0122272772417988 | 0.9938863613791 |
| 38 | 0.00925927312818902 | 0.0185185462563780 | 0.99074072687181 |
| 39 | 0.0452521109546697 | 0.0905042219093394 | 0.95474788904533 |
| 40 | 0.0558856422620579 | 0.111771284524116 | 0.944114357737942 |
| 41 | 0.0763956939943117 | 0.152791387988623 | 0.923604306005688 |
| 42 | 0.0766120217054494 | 0.153224043410899 | 0.92338797829455 |
| 43 | 0.133766036592175 | 0.26753207318435 | 0.866233963407825 |
| 44 | 0.212748538300310 | 0.425497076600619 | 0.78725146169969 |
| 45 | 0.532059577922575 | 0.93588084415485 | 0.467940422077425 |
| 46 | 0.706437071955735 | 0.58712585608853 | 0.293562928044265 |
| 47 | 0.869323139941292 | 0.261353720117415 | 0.130676860058708 |
| 48 | 0.907545753564205 | 0.18490849287159 | 0.092454246435795 |
| 49 | 0.956482795743348 | 0.0870344085133033 | 0.0435172042566517 |
| 50 | 0.968548427222066 | 0.0629031455558683 | 0.0314515727779342 |
| 51 | 0.96331665177452 | 0.0733666964509591 | 0.0366833482254796 |
| 52 | 0.973393300572818 | 0.0532133988543636 | 0.0266066994271818 |
| 53 | 0.967301239018985 | 0.0653975219620293 | 0.0326987609810146 |
| 54 | 0.93029552024689 | 0.139408959506221 | 0.0697044797531104 |
| 55 | 0.874453894506665 | 0.251092210986670 | 0.125546105493335 |
| Meta Analysis of Goldfeld-Quandt test for Heteroskedasticity | |||
| Description | # significant tests | % significant tests | OK/NOK |
| 1% type I error level | 4 | 0.0784313725490196 | NOK |
| 5% type I error level | 11 | 0.215686274509804 | NOK |
| 10% type I error level | 25 | 0.490196078431373 | NOK |