| Multiple Linear Regression - Estimated Regression Equation |
| Broodprijzen[t] = + 1.4814 + 0.1465X[t] -0.0127000000000015M1[t] + 0.00730000000000005M2[t] + 0.00930000000000006M3[t] + 0.0113000000000000M4[t] + 0.0113000000000000M5[t] + 0.0113M6[t] -0.014M7[t] -0.00399999999999999M8[t] -0.00199999999999998M9[t] + 1.17154354015985e-17M10[t] + 8.22851594197665e-18M11[t] + e[t] |
| Multiple Linear Regression - Ordinary Least Squares | |||||
| Variable | Parameter | S.D. | T-STAT H0: parameter = 0 | 2-tail p-value | 1-tail p-value |
| (Intercept) | 1.4814 | 0.017383 | 85.2203 | 0 | 0 |
| X | 0.1465 | 0.010864 | 13.4843 | 0 | 0 |
| M1 | -0.0127000000000015 | 0.023902 | -0.5313 | 0.597686 | 0.298843 |
| M2 | 0.00730000000000005 | 0.023902 | 0.3054 | 0.761399 | 0.380699 |
| M3 | 0.00930000000000006 | 0.023902 | 0.3891 | 0.698966 | 0.349483 |
| M4 | 0.0113000000000000 | 0.023902 | 0.4728 | 0.638568 | 0.319284 |
| M5 | 0.0113000000000000 | 0.023902 | 0.4728 | 0.638568 | 0.319284 |
| M6 | 0.0113 | 0.023902 | 0.4728 | 0.638568 | 0.319284 |
| M7 | -0.014 | 0.023803 | -0.5882 | 0.559239 | 0.279619 |
| M8 | -0.00399999999999999 | 0.023803 | -0.168 | 0.867268 | 0.433634 |
| M9 | -0.00199999999999998 | 0.023803 | -0.084 | 0.933395 | 0.466697 |
| M10 | 1.17154354015985e-17 | 0.023803 | 0 | 1 | 0.5 |
| M11 | 8.22851594197665e-18 | 0.023803 | 0 | 1 | 0.5 |
| Multiple Linear Regression - Regression Statistics | |
| Multiple R | 0.894438385879152 |
| R-squared | 0.800020026134103 |
| Adjusted R-squared | 0.748961309402385 |
| F-TEST (value) | 15.6686277553294 |
| F-TEST (DF numerator) | 12 |
| F-TEST (DF denominator) | 47 |
| p-value | 1.39666056497845e-12 |
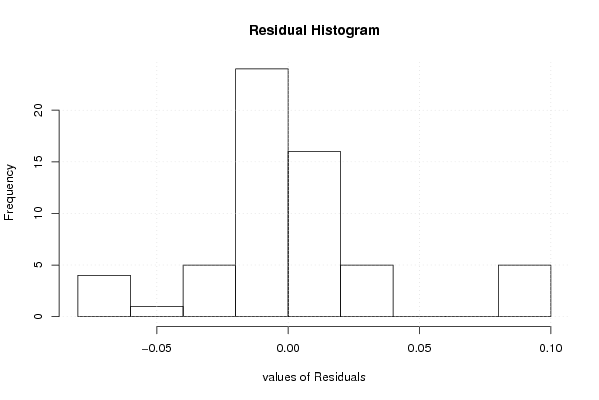
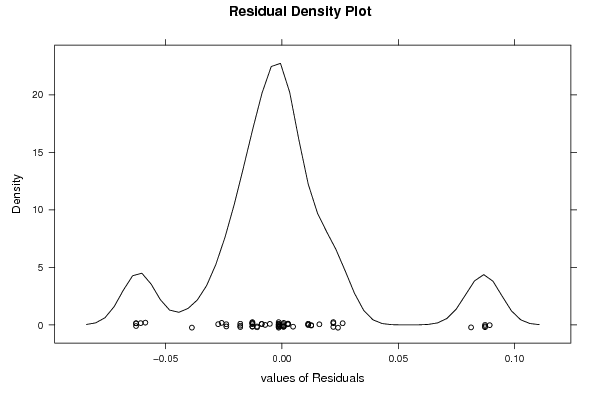
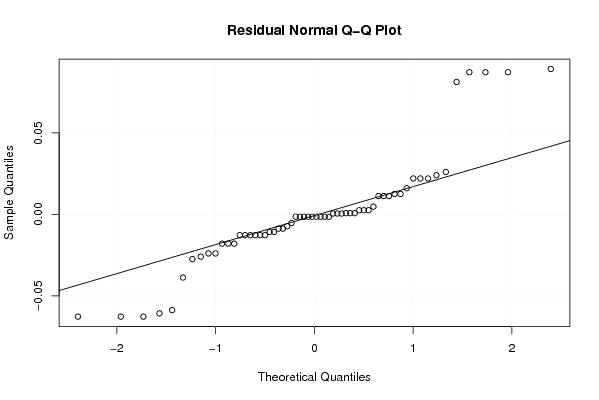
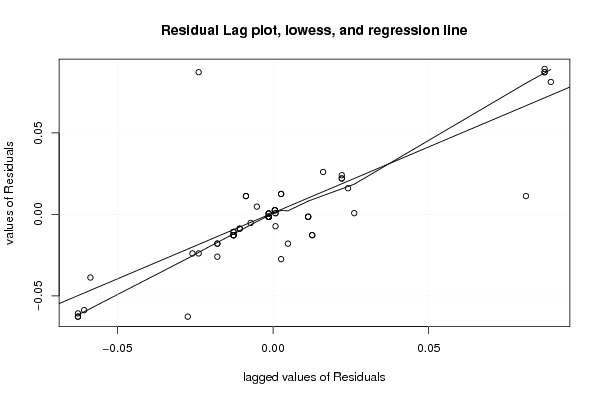
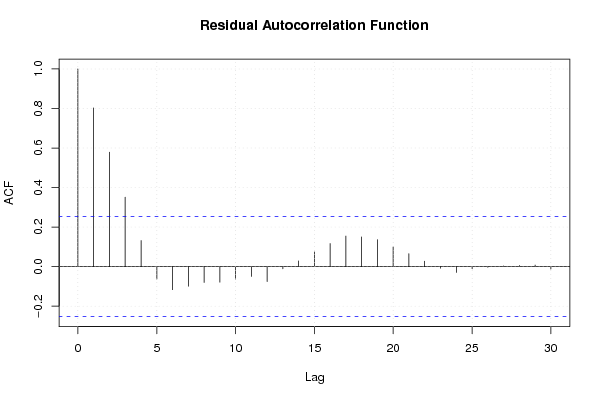
| Multiple Linear Regression - Residual Statistics | |
| Residual Standard Deviation | 0.0376357118772935 |
| Sum Squared Residuals | 0.0665730000000007 |
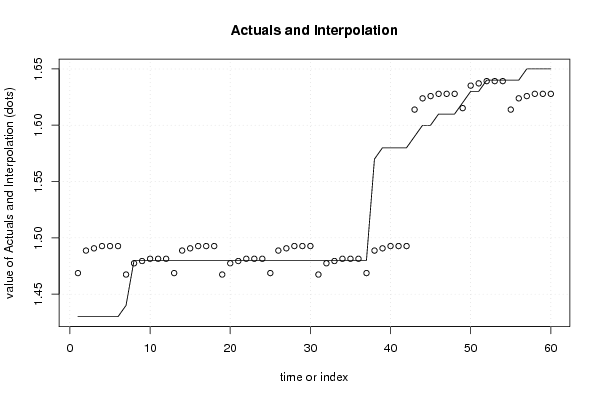
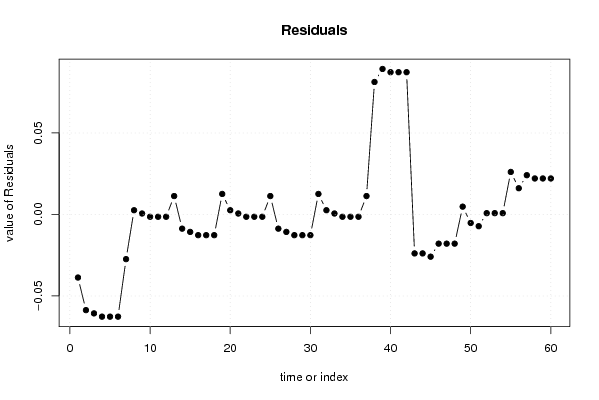
| Multiple Linear Regression - Actuals, Interpolation, and Residuals | |||
| Time or Index | Actuals | Interpolation Forecast | Residuals Prediction Error |
| 1 | 1.43 | 1.46870000000001 | -0.0387000000000059 |
| 2 | 1.43 | 1.4887 | -0.0587000000000001 |
| 3 | 1.43 | 1.4907 | -0.0607 |
| 4 | 1.43 | 1.4927 | -0.0627000000000001 |
| 5 | 1.43 | 1.4927 | -0.0627 |
| 6 | 1.43 | 1.4927 | -0.0627 |
| 7 | 1.44 | 1.4674 | -0.0274 |
| 8 | 1.48 | 1.4774 | 0.00260000000000006 |
| 9 | 1.48 | 1.4794 | 0.00060000000000003 |
| 10 | 1.48 | 1.4814 | -0.00139999999999997 |
| 11 | 1.48 | 1.4814 | -0.00139999999999997 |
| 12 | 1.48 | 1.4814 | -0.00139999999999995 |
| 13 | 1.48 | 1.4687 | 0.0113000000000015 |
| 14 | 1.48 | 1.4887 | -0.00869999999999997 |
| 15 | 1.48 | 1.4907 | -0.0107 |
| 16 | 1.48 | 1.4927 | -0.0127000000000000 |
| 17 | 1.48 | 1.4927 | -0.0127000000000000 |
| 18 | 1.48 | 1.4927 | -0.0127000000000000 |
| 19 | 1.48 | 1.4674 | 0.0126000000000000 |
| 20 | 1.48 | 1.4774 | 0.00260000000000005 |
| 21 | 1.48 | 1.4794 | 0.000600000000000037 |
| 22 | 1.48 | 1.4814 | -0.00139999999999996 |
| 23 | 1.48 | 1.4814 | -0.00139999999999995 |
| 24 | 1.48 | 1.4814 | -0.00139999999999994 |
| 25 | 1.48 | 1.4687 | 0.0113000000000015 |
| 26 | 1.48 | 1.4887 | -0.00869999999999997 |
| 27 | 1.48 | 1.4907 | -0.0107 |
| 28 | 1.48 | 1.4927 | -0.0127000000000000 |
| 29 | 1.48 | 1.4927 | -0.0127000000000000 |
| 30 | 1.48 | 1.4927 | -0.0127000000000000 |
| 31 | 1.48 | 1.4674 | 0.0126000000000000 |
| 32 | 1.48 | 1.4774 | 0.00260000000000005 |
| 33 | 1.48 | 1.4794 | 0.000600000000000037 |
| 34 | 1.48 | 1.4814 | -0.00139999999999996 |
| 35 | 1.48 | 1.4814 | -0.00139999999999995 |
| 36 | 1.48 | 1.4814 | -0.00139999999999994 |
| 37 | 1.48 | 1.4687 | 0.0113000000000015 |
| 38 | 1.57 | 1.4887 | 0.0813000000000001 |
| 39 | 1.58 | 1.4907 | 0.0893 |
| 40 | 1.58 | 1.4927 | 0.0873000000000002 |
| 41 | 1.58 | 1.4927 | 0.0873000000000001 |
| 42 | 1.58 | 1.4927 | 0.0873000000000002 |
| 43 | 1.59 | 1.6139 | -0.0239000000000000 |
| 44 | 1.6 | 1.6239 | -0.0239 |
| 45 | 1.6 | 1.6259 | -0.0259 |
| 46 | 1.61 | 1.6279 | -0.0179000000000000 |
| 47 | 1.61 | 1.6279 | -0.0179000000000000 |
| 48 | 1.61 | 1.6279 | -0.0179000000000000 |
| 49 | 1.62 | 1.6152 | 0.00480000000000148 |
| 50 | 1.63 | 1.6352 | -0.00520000000000016 |
| 51 | 1.63 | 1.6372 | -0.0072000000000002 |
| 52 | 1.64 | 1.6392 | 0.000799999999999853 |
| 53 | 1.64 | 1.6392 | 0.000799999999999835 |
| 54 | 1.64 | 1.6392 | 0.000799999999999856 |
| 55 | 1.64 | 1.6139 | 0.0260999999999999 |
| 56 | 1.64 | 1.6239 | 0.0160999999999999 |
| 57 | 1.65 | 1.6259 | 0.0240999999999999 |
| 58 | 1.65 | 1.6279 | 0.0220999999999998 |
| 59 | 1.65 | 1.6279 | 0.0220999999999999 |
| 60 | 1.65 | 1.6279 | 0.0220999999999999 |
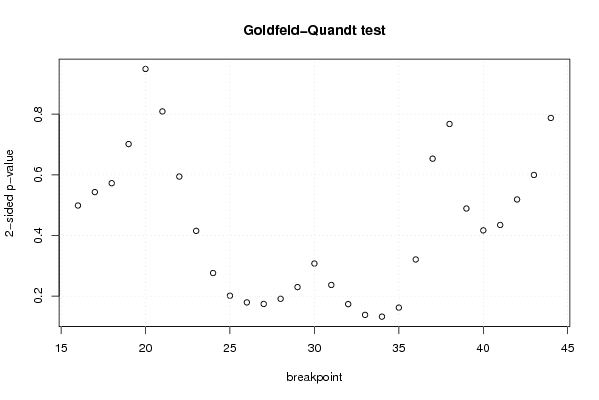
| Goldfeld-Quandt test for Heteroskedasticity | |||
| p-values | Alternative Hypothesis | ||
| breakpoint index | greater | 2-sided | less |
| 16 | 0.750523794598804 | 0.498952410802391 | 0.249476205401196 |
| 17 | 0.728412019662652 | 0.543175960674695 | 0.271587980337348 |
| 18 | 0.713750278946885 | 0.57249944210623 | 0.286249721053115 |
| 19 | 0.649221008337855 | 0.701557983324291 | 0.350778991662145 |
| 20 | 0.525325056973346 | 0.949349886053309 | 0.474674943026654 |
| 21 | 0.404661402273339 | 0.809322804546677 | 0.595338597726661 |
| 22 | 0.297176086226124 | 0.594352172452248 | 0.702823913773876 |
| 23 | 0.207652370269801 | 0.415304740539603 | 0.792347629730199 |
| 24 | 0.138113998572900 | 0.276227997145800 | 0.8618860014271 |
| 25 | 0.100735445353483 | 0.201470890706965 | 0.899264554646517 |
| 26 | 0.0897001275046123 | 0.179400255009225 | 0.910299872495388 |
| 27 | 0.0871285771738437 | 0.174257154347687 | 0.912871422826156 |
| 28 | 0.0956243735937527 | 0.191248747187505 | 0.904375626406247 |
| 29 | 0.114939664134799 | 0.229879328269599 | 0.8850603358652 |
| 30 | 0.153758472436869 | 0.307516944873738 | 0.846241527563131 |
| 31 | 0.118443197012218 | 0.236886394024436 | 0.881556802987782 |
| 32 | 0.086824388934521 | 0.173648777869042 | 0.91317561106548 |
| 33 | 0.0690789344651016 | 0.138157868930203 | 0.930921065534898 |
| 34 | 0.0661757506482803 | 0.132351501296561 | 0.93382424935172 |
| 35 | 0.081094167115097 | 0.162188334230194 | 0.918905832884903 |
| 36 | 0.160480376220501 | 0.320960752441003 | 0.839519623779499 |
| 37 | 0.32671885784092 | 0.65343771568184 | 0.67328114215908 |
| 38 | 0.616101005523176 | 0.767797988953648 | 0.383898994476824 |
| 39 | 0.755491827992885 | 0.489016344014231 | 0.244508172007115 |
| 40 | 0.791531257438814 | 0.416937485122372 | 0.208468742561186 |
| 41 | 0.782628394783673 | 0.434743210432655 | 0.217371605216327 |
| 42 | 0.740544571721749 | 0.518910856556502 | 0.259455428278251 |
| 43 | 0.700185881556137 | 0.599628236887726 | 0.299814118443863 |
| 44 | 0.606171509122721 | 0.787656981754558 | 0.393828490877279 |
| Meta Analysis of Goldfeld-Quandt test for Heteroskedasticity | |||
| Description | # significant tests | % significant tests | OK/NOK |
| 1% type I error level | 0 | 0 | OK |
| 5% type I error level | 0 | 0 | OK |
| 10% type I error level | 0 | 0 | OK |