| Multiple Linear Regression - Estimated Regression Equation |
| WLMan[t] = + 3.65718934610865 + 0.395497505499312WLVrouw[t] + 0.191002977382953`Yt-1`[t] -0.138059867944866`Yt-2`[t] -0.099406851289696M1[t] -0.148951401377357M2[t] -0.234467327975613M3[t] -0.471178750524076M4[t] -0.448031656398712M5[t] -0.708998951622607M6[t] -0.565548945759982M7[t] -0.499274537665341M8[t] -0.394140575303057M9[t] -0.195156370453495M10[t] -0.0142767368236248M11[t] -0.00669916588971114t + e[t] |
| Multiple Linear Regression - Ordinary Least Squares | |||||
| Variable | Parameter | S.D. | T-STAT H0: parameter = 0 | 2-tail p-value | 1-tail p-value |
| (Intercept) | 3.65718934610865 | 1.264152 | 2.893 | 0.006024 | 0.003012 |
| WLVrouw | 0.395497505499312 | 0.254641 | 1.5532 | 0.12789 | 0.063945 |
| `Yt-1` | 0.191002977382953 | 0.406998 | 0.4693 | 0.641285 | 0.320642 |
| `Yt-2` | -0.138059867944866 | 0.255103 | -0.5412 | 0.591235 | 0.295617 |
| M1 | -0.099406851289696 | 0.278415 | -0.357 | 0.722845 | 0.361422 |
| M2 | -0.148951401377357 | 0.285278 | -0.5221 | 0.604325 | 0.302163 |
| M3 | -0.234467327975613 | 0.290255 | -0.8078 | 0.423759 | 0.21188 |
| M4 | -0.471178750524076 | 0.292672 | -1.6099 | 0.114906 | 0.057453 |
| M5 | -0.448031656398712 | 0.366738 | -1.2217 | 0.228647 | 0.114323 |
| M6 | -0.708998951622607 | 0.32784 | -2.1626 | 0.036311 | 0.018156 |
| M7 | -0.565548945759982 | 0.285832 | -1.9786 | 0.054443 | 0.027222 |
| M8 | -0.499274537665341 | 0.290653 | -1.7178 | 0.093205 | 0.046602 |
| M9 | -0.394140575303057 | 0.29421 | -1.3397 | 0.18756 | 0.09378 |
| M10 | -0.195156370453495 | 0.306503 | -0.6367 | 0.527763 | 0.263882 |
| M11 | -0.0142767368236248 | 0.292262 | -0.0488 | 0.961271 | 0.480636 |
| t | -0.00669916588971114 | 0.006096 | -1.099 | 0.278048 | 0.139024 |
| Multiple Linear Regression - Regression Statistics | |
| Multiple R | 0.844394446216218 |
| R-squared | 0.713001980800794 |
| Adjusted R-squared | 0.610502688229648 |
| F-TEST (value) | 6.95616489553717 |
| F-TEST (DF numerator) | 15 |
| F-TEST (DF denominator) | 42 |
| p-value | 3.1064643501999e-07 |
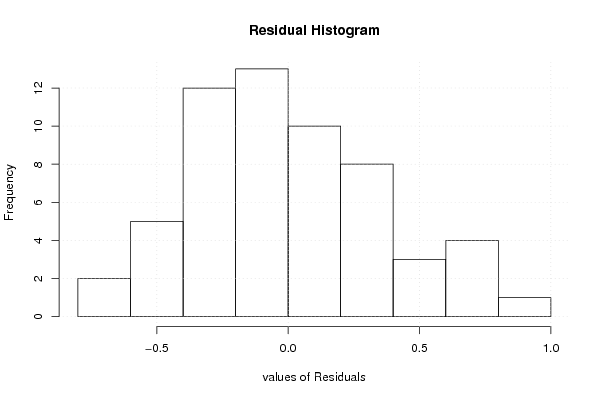
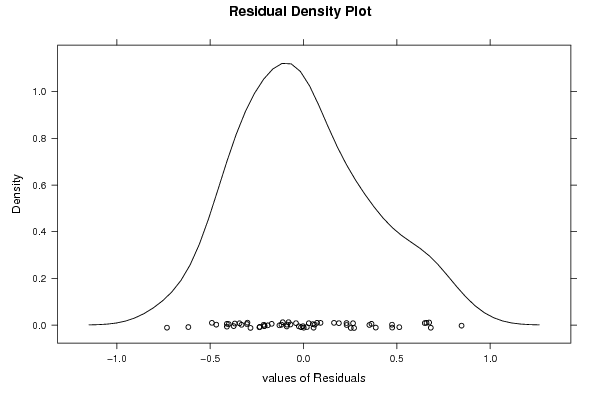
| Multiple Linear Regression - Residual Statistics | |
| Residual Standard Deviation | 0.409325621372292 |
| Sum Squared Residuals | 7.03699350109613 |
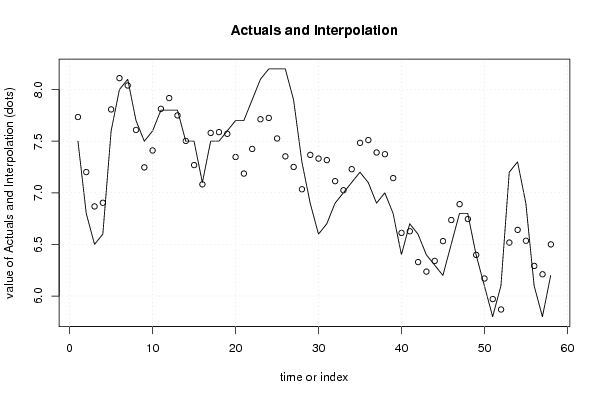
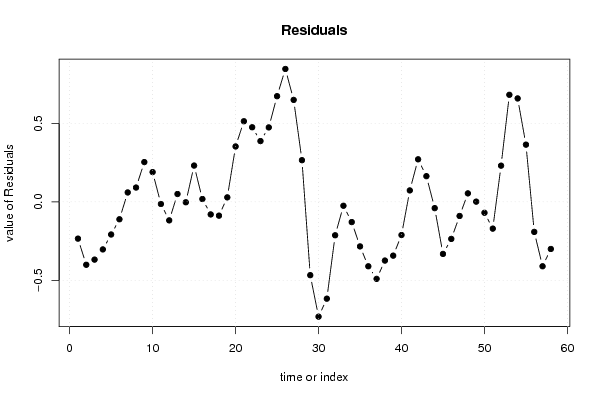
| Multiple Linear Regression - Actuals, Interpolation, and Residuals | |||
| Time or Index | Actuals | Interpolation Forecast | Residuals Prediction Error |
| 1 | 7.5 | 7.73424661577162 | -0.234246615771617 |
| 2 | 6.8 | 7.20080989239794 | -0.400809892397944 |
| 3 | 6.5 | 6.86797250484966 | -0.367972504849663 |
| 4 | 6.6 | 6.90306964389112 | -0.303069643891124 |
| 5 | 7.6 | 7.8078822816504 | -0.207882281650406 |
| 6 | 8 | 8.1109397974415 | -0.110939797441497 |
| 7 | 8.1 | 8.03997947138737 | 0.0600205286126291 |
| 8 | 7.7 | 7.60876445560492 | 0.0912355443950769 |
| 9 | 7.5 | 7.24651054162236 | 0.253489458377639 |
| 10 | 7.6 | 7.41024707982623 | 0.189752920173772 |
| 11 | 7.8 | 7.81352469357208 | -0.0135246935720755 |
| 12 | 7.8 | 7.9179529082708 | -0.117952908270805 |
| 13 | 7.8 | 7.7499794778963 | 0.0500205221036976 |
| 14 | 7.5 | 7.50263047518642 | -0.00263047518642345 |
| 15 | 7.5 | 7.2687206774399 | 0.231279322560101 |
| 16 | 7.1 | 7.08188319125301 | 0.0181168087469879 |
| 17 | 7.5 | 7.58009064686518 | -0.080090646865176 |
| 18 | 7.5 | 7.5878209751782 | -0.0878209751781949 |
| 19 | 7.6 | 7.57135680533842 | 0.0286431946615845 |
| 20 | 7.7 | 7.34692127291649 | 0.353078727083511 |
| 21 | 7.7 | 7.18636126755405 | 0.513638732445948 |
| 22 | 7.9 | 7.42463078687757 | 0.475369213122428 |
| 23 | 8.1 | 7.7126852500839 | 0.387314749916095 |
| 24 | 8.2 | 7.72555713196163 | 0.474442868038372 |
| 25 | 8.2 | 7.52654562688787 | 0.673454373112129 |
| 26 | 8.2 | 7.35300181433405 | 0.846998185665954 |
| 27 | 7.9 | 7.25019809995846 | 0.649801900041539 |
| 28 | 7.3 | 7.03439948510926 | 0.265600514890740 |
| 29 | 6.9 | 7.36724541774436 | -0.467245417744362 |
| 30 | 6.6 | 7.33148083963698 | -0.731480839636982 |
| 31 | 6.7 | 7.31688487963073 | -0.61688487963073 |
| 32 | 6.9 | 7.11289880002044 | -0.212898800020441 |
| 33 | 7 | 7.02479482974072 | -0.0247948297407169 |
| 34 | 7.1 | 7.22880890945811 | -0.128808909458114 |
| 35 | 7.2 | 7.48395708813166 | -0.283957088131664 |
| 36 | 7.1 | 7.51063495680387 | -0.410634956803873 |
| 37 | 6.9 | 7.39072295282998 | -0.490722952829979 |
| 38 | 7 | 7.37402898740254 | -0.374028987402538 |
| 39 | 6.8 | 7.14271519045314 | -0.342715190453143 |
| 40 | 6.4 | 6.61134867151764 | -0.211348671517644 |
| 41 | 6.7 | 6.6270688087897 | 0.0729311912103026 |
| 42 | 6.6 | 6.32888332773703 | 0.271116672262974 |
| 43 | 6.4 | 6.23632828550084 | 0.163671714499158 |
| 44 | 6.3 | 6.34001979823591 | -0.0400197982359138 |
| 45 | 6.2 | 6.53187913736302 | -0.331879137363024 |
| 46 | 6.5 | 6.73610195328383 | -0.236101953283832 |
| 47 | 6.8 | 6.88983296821236 | -0.0898329682123556 |
| 48 | 6.8 | 6.74585500296369 | 0.0541449970363064 |
| 49 | 6.4 | 6.39850532661423 | 0.00149467338576981 |
| 50 | 6.1 | 6.16952883067905 | -0.0695288306790485 |
| 51 | 5.8 | 5.97039352729883 | -0.170393527298835 |
| 52 | 6.1 | 5.86929900822896 | 0.230700991771041 |
| 53 | 7.2 | 6.51771284495036 | 0.682287155049642 |
| 54 | 7.3 | 6.6408750600063 | 0.659124939993699 |
| 55 | 6.9 | 6.53545055814264 | 0.364549441857359 |
| 56 | 6.1 | 6.29139567322223 | -0.191395673222233 |
| 57 | 5.8 | 6.21045422371985 | -0.410454223719846 |
| 58 | 6.2 | 6.50021127055425 | -0.300211270554254 |
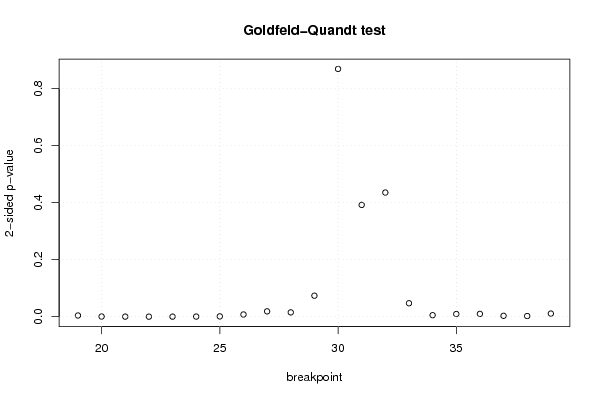
| Goldfeld-Quandt test for Heteroskedasticity | |||
| p-values | Alternative Hypothesis | ||
| breakpoint index | greater | 2-sided | less |
| 19 | 0.00203712757715894 | 0.00407425515431788 | 0.99796287242284 |
| 20 | 0.000193269212546471 | 0.000386538425092942 | 0.999806730787454 |
| 21 | 3.23686810988154e-05 | 6.47373621976308e-05 | 0.999967631318901 |
| 22 | 6.40359514837804e-06 | 1.28071902967561e-05 | 0.999993596404852 |
| 23 | 2.85492669698133e-06 | 5.70985339396266e-06 | 0.999997145073303 |
| 24 | 0.000141514788643273 | 0.000283029577286546 | 0.999858485211357 |
| 25 | 0.000476534041134436 | 0.000953068082268871 | 0.999523465958866 |
| 26 | 0.00379999030208807 | 0.00759998060417615 | 0.996200009697912 |
| 27 | 0.00932078254622554 | 0.0186415650924511 | 0.990679217453774 |
| 28 | 0.00751343079785643 | 0.0150268615957129 | 0.992486569202144 |
| 29 | 0.0367458405798868 | 0.0734916811597736 | 0.963254159420113 |
| 30 | 0.434397536781352 | 0.868795073562704 | 0.565602463218648 |
| 31 | 0.804040814449024 | 0.391918371101953 | 0.195959185550976 |
| 32 | 0.782367246478276 | 0.435265507043448 | 0.217632753521724 |
| 33 | 0.976501149066028 | 0.0469977018679448 | 0.0234988509339724 |
| 34 | 0.997460403594263 | 0.00507919281147393 | 0.00253959640573697 |
| 35 | 0.995399982953186 | 0.00920003409362781 | 0.00460001704681391 |
| 36 | 0.995166709872065 | 0.00966658025587057 | 0.00483329012793528 |
| 37 | 0.9985213113519 | 0.00295737729620157 | 0.00147868864810078 |
| 38 | 0.998926683991556 | 0.00214663201688754 | 0.00107331600844377 |
| 39 | 0.994611337200477 | 0.0107773255990460 | 0.00538866279952299 |
| Meta Analysis of Goldfeld-Quandt test for Heteroskedasticity | |||
| Description | # significant tests | % significant tests | OK/NOK |
| 1% type I error level | 13 | 0.619047619047619 | NOK |
| 5% type I error level | 17 | 0.80952380952381 | NOK |
| 10% type I error level | 18 | 0.857142857142857 | NOK |