| Multiple Linear Regression - Estimated Regression Equation |
| wngb[t] = + 1681.39441980409 + 25.6802893156051`<25`[t] + 239.567189564934M1[t] -205.134354973182M2[t] -371.241281120370M3[t] -214.467917951953M4[t] -184.300659681619M5[t] -507.106189838661M6[t] -196.569557234498M7[t] -13.2281651345211M8[t] -189.659561461919M9[t] + 175.472311646427M10[t] -88.4135078262194M11[t] + 8.90827154945574t + e[t] |
| Multiple Linear Regression - Ordinary Least Squares | |||||
| Variable | Parameter | S.D. | T-STAT H0: parameter = 0 | 2-tail p-value | 1-tail p-value |
| (Intercept) | 1681.39441980409 | 447.084896 | 3.7608 | 0.000477 | 0.000239 |
| `<25` | 25.6802893156051 | 23.578262 | 1.0892 | 0.28176 | 0.14088 |
| M1 | 239.567189564934 | 179.370945 | 1.3356 | 0.188252 | 0.094126 |
| M2 | -205.134354973182 | 201.199127 | -1.0196 | 0.31327 | 0.156635 |
| M3 | -371.241281120370 | 211.048258 | -1.759 | 0.085222 | 0.042611 |
| M4 | -214.467917951953 | 209.10242 | -1.0257 | 0.310416 | 0.155208 |
| M5 | -184.300659681619 | 196.018195 | -0.9402 | 0.352015 | 0.176007 |
| M6 | -507.106189838661 | 185.82202 | -2.729 | 0.008969 | 0.004485 |
| M7 | -196.569557234498 | 183.297603 | -1.0724 | 0.289132 | 0.144566 |
| M8 | -13.2281651345211 | 181.885959 | -0.0727 | 0.942338 | 0.471169 |
| M9 | -189.659561461919 | 180.497621 | -1.0508 | 0.298858 | 0.149429 |
| M10 | 175.472311646427 | 178.65198 | 0.9822 | 0.331138 | 0.165569 |
| M11 | -88.4135078262194 | 178.147494 | -0.4963 | 0.62205 | 0.311025 |
| t | 8.90827154945574 | 2.194401 | 4.0595 | 0.000189 | 9.5e-05 |
| Multiple Linear Regression - Regression Statistics | |
| Multiple R | 0.705597659500331 |
| R-squared | 0.497868057092345 |
| Adjusted R-squared | 0.355961203661921 |
| F-TEST (value) | 3.50841446383311 |
| F-TEST (DF numerator) | 13 |
| F-TEST (DF denominator) | 46 |
| p-value | 0.000797409462064635 |
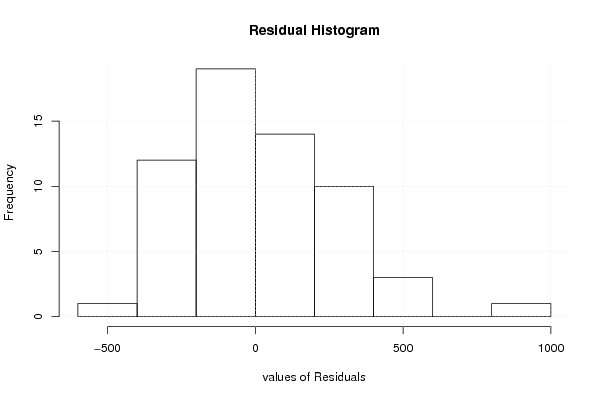
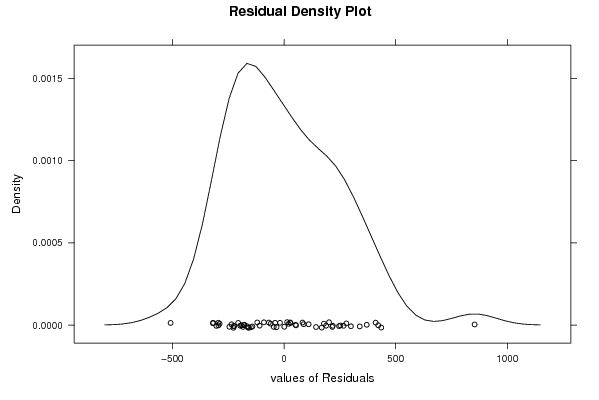
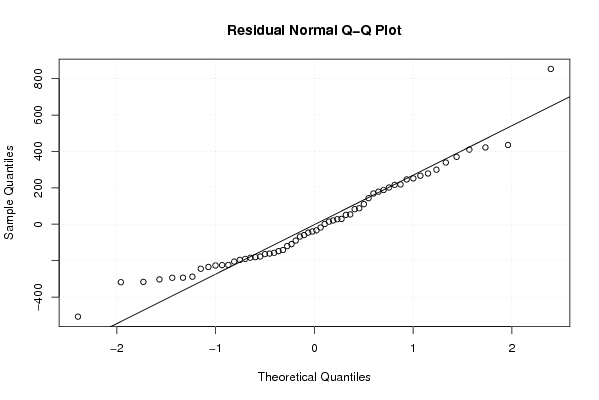
| Multiple Linear Regression - Residual Statistics | |
| Residual Standard Deviation | 280.638436043883 |
| Sum Squared Residuals | 3622864.86211721 |
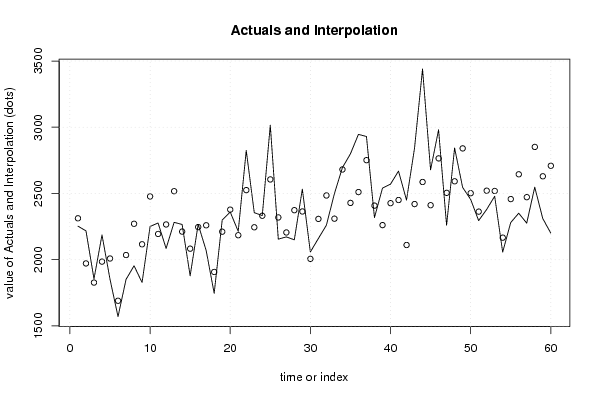
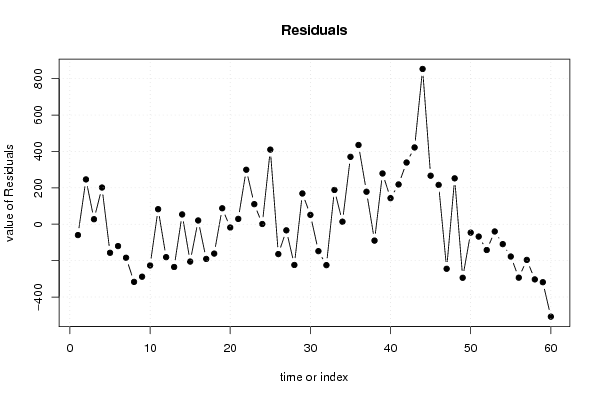
| Multiple Linear Regression - Actuals, Interpolation, and Residuals | |||
| Time or Index | Actuals | Interpolation Forecast | Residuals Prediction Error |
| 1 | 2253 | 2312.50619172101 | -59.506191721009 |
| 2 | 2218 | 1971.72998920007 | 246.270010799925 |
| 3 | 1855 | 1827.37147926014 | 27.628520739855 |
| 4 | 2187 | 1985.34902718334 | 201.650972816664 |
| 5 | 1852 | 2009.01638341376 | -157.016383413763 |
| 6 | 1570 | 1689.98306694306 | -119.983066943056 |
| 7 | 1851 | 2035.10826041228 | -184.108260412278 |
| 8 | 1954 | 2271.01441589824 | -317.01441589824 |
| 9 | 1828 | 2116.3314357781 | -288.331435778101 |
| 10 | 2251 | 2477.5314357781 | -226.531435778101 |
| 11 | 2277 | 2194.30556960774 | 82.6944303922565 |
| 12 | 2085 | 2265.94705966781 | -180.947059667814 |
| 13 | 2282 | 2516.99054971376 | -234.990549713764 |
| 14 | 2266 | 2212.16675223469 | 53.83324776531 |
| 15 | 1878 | 2083.21641588412 | -205.216415884124 |
| 16 | 2267 | 2246.33002167044 | 20.6699783295644 |
| 17 | 2069 | 2259.72526217462 | -190.725262174620 |
| 18 | 1746 | 1907.30756959363 | -161.307569593627 |
| 19 | 2299 | 2211.34430015788 | 87.6556998421186 |
| 20 | 2360 | 2377.91367449171 | -17.9136744917094 |
| 21 | 2214 | 2184.71026039816 | 29.2897396018383 |
| 22 | 2825 | 2525.36602894568 | 299.633971054322 |
| 23 | 2355 | 2244.70819170688 | 110.291808293119 |
| 24 | 2333 | 2331.75785535631 | 1.24214464368536 |
| 25 | 3016 | 2605.91360578631 | 410.08639421369 |
| 26 | 2155 | 2319.06601082816 | -164.066010828159 |
| 27 | 2172 | 2205.52384806696 | -33.5238480669555 |
| 28 | 2150 | 2373.77351171639 | -223.773511716389 |
| 29 | 2533 | 2364.05649183653 | 168.943508163471 |
| 30 | 2058 | 2006.50274139241 | 51.4972586075861 |
| 31 | 2160 | 2307.97144302511 | -147.971443025108 |
| 32 | 2260 | 2484.81293308518 | -224.812933085178 |
| 33 | 2498 | 2309.58572151255 | 188.414278487446 |
| 34 | 2695 | 2681.05783723880 | 13.9421627612039 |
| 35 | 2799 | 2428.64831824717 | 370.351681752835 |
| 36 | 2946 | 2510.56192403348 | 435.438075966522 |
| 37 | 2930 | 2751.33329835319 | 178.666701646814 |
| 38 | 2318 | 2407.98906690070 | -89.9890669007047 |
| 39 | 2540 | 2261.06252802921 | 278.937471970786 |
| 40 | 2570 | 2426.74416274709 | 143.255837252913 |
| 41 | 2669 | 2450.41151897751 | 218.588481022486 |
| 42 | 2450 | 2110.83397105432 | 339.166028945678 |
| 43 | 2842 | 2420.0067594817 | 421.993240518302 |
| 44 | 3440 | 2586.57613381553 | 853.423866184474 |
| 45 | 2678 | 2411.3489222429 | 266.651077757098 |
| 46 | 2981 | 2764.84483544822 | 216.155164551780 |
| 47 | 2260 | 2504.73122966191 | -244.731229661908 |
| 48 | 2844 | 2591.78089331134 | 252.219106688658 |
| 49 | 2546 | 2840.25635442573 | -294.256354425731 |
| 50 | 2456 | 2502.04818083637 | -46.0481808363711 |
| 51 | 2295 | 2362.82572875956 | -67.8257287595621 |
| 52 | 2379 | 2520.80327668275 | -141.803276682753 |
| 53 | 2479 | 2518.79034359757 | -39.7903435975746 |
| 54 | 2057 | 2166.37265101658 | -109.372651016581 |
| 55 | 2280 | 2457.56923692303 | -177.569236923033 |
| 56 | 2351 | 2644.68284270935 | -293.682842709345 |
| 57 | 2276 | 2472.02366006828 | -196.023660068282 |
| 58 | 2548 | 2851.19986258921 | -303.199862589206 |
| 59 | 2311 | 2629.6066907763 | -318.606690776301 |
| 60 | 2201 | 2708.95226763105 | -507.952267631052 |
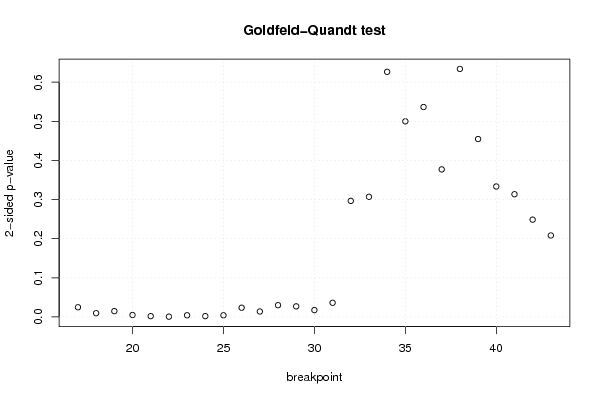
| Goldfeld-Quandt test for Heteroskedasticity | |||
| p-values | Alternative Hypothesis | ||
| breakpoint index | greater | 2-sided | less |
| 17 | 0.0122714684640087 | 0.0245429369280174 | 0.987728531535991 |
| 18 | 0.00467562608789218 | 0.00935125217578435 | 0.995324373912108 |
| 19 | 0.00730777224341425 | 0.0146155444868285 | 0.992692227756586 |
| 20 | 0.00238398147275534 | 0.00476796294551067 | 0.997616018527245 |
| 21 | 0.000893201919487399 | 0.00178640383897480 | 0.999106798080513 |
| 22 | 0.000255973840357365 | 0.00051194768071473 | 0.999744026159643 |
| 23 | 0.00202214512579558 | 0.00404429025159117 | 0.997977854874204 |
| 24 | 0.000900160310208833 | 0.00180032062041767 | 0.999099839689791 |
| 25 | 0.00200439462415734 | 0.00400878924831469 | 0.997995605375843 |
| 26 | 0.0116893276450563 | 0.0233786552901126 | 0.988310672354944 |
| 27 | 0.00682241270253931 | 0.0136448254050786 | 0.99317758729746 |
| 28 | 0.0149191901277135 | 0.029838380255427 | 0.985080809872287 |
| 29 | 0.0134278246762566 | 0.0268556493525132 | 0.986572175323743 |
| 30 | 0.00864828109283326 | 0.0172965621856665 | 0.991351718907167 |
| 31 | 0.0179797122940492 | 0.0359594245880984 | 0.98202028770595 |
| 32 | 0.148337422636536 | 0.296674845273073 | 0.851662577363464 |
| 33 | 0.153466859354944 | 0.306933718709888 | 0.846533140645056 |
| 34 | 0.313335911794254 | 0.626671823588508 | 0.686664088205746 |
| 35 | 0.249999985497752 | 0.499999970995503 | 0.750000014502249 |
| 36 | 0.268308160898679 | 0.536616321797358 | 0.73169183910132 |
| 37 | 0.188521712988226 | 0.377043425976452 | 0.811478287011774 |
| 38 | 0.316994731609651 | 0.633989463219302 | 0.683005268390349 |
| 39 | 0.227374726726845 | 0.454749453453691 | 0.772625273273154 |
| 40 | 0.166681883524300 | 0.333363767048600 | 0.8333181164757 |
| 41 | 0.156795255271400 | 0.313590510542799 | 0.8432047447286 |
| 42 | 0.124309853424319 | 0.248619706848638 | 0.875690146575681 |
| 43 | 0.104058699430530 | 0.208117398861060 | 0.89594130056947 |
| Meta Analysis of Goldfeld-Quandt test for Heteroskedasticity | |||
| Description | # significant tests | % significant tests | OK/NOK |
| 1% type I error level | 7 | 0.259259259259259 | NOK |
| 5% type I error level | 15 | 0.555555555555556 | NOK |
| 10% type I error level | 15 | 0.555555555555556 | NOK |