| Multiple Linear Regression - Estimated Regression Equation |
| Y[t] = + 1677.68894339794 + 0.586252193687844X[t] + 273.970572539457M1[t] -629.564052274936M2[t] + 82.4442739799037M3[t] -175.120587025784M4[t] -456.435752915417M5[t] -281.343885814236M6[t] -737.70923779068M7[t] -147.638849728842M8[t] -3.03609424816335M9[t] -187.498457097383M10[t] + 5.70781212665605M11[t] + e[t] |
| Multiple Linear Regression - Ordinary Least Squares | |||||
| Variable | Parameter | S.D. | T-STAT H0: parameter = 0 | 2-tail p-value | 1-tail p-value |
| (Intercept) | 1677.68894339794 | 309.74801 | 5.4163 | 2e-06 | 1e-06 |
| X | 0.586252193687844 | 0.054589 | 10.7393 | 0 | 0 |
| M1 | 273.970572539457 | 180.456973 | 1.5182 | 0.135522 | 0.067761 |
| M2 | -629.564052274936 | 188.524052 | -3.3394 | 0.00163 | 0.000815 |
| M3 | 82.4442739799037 | 187.195071 | 0.4404 | 0.661611 | 0.330805 |
| M4 | -175.120587025784 | 187.007064 | -0.9364 | 0.353735 | 0.176868 |
| M5 | -456.435752915417 | 186.972198 | -2.4412 | 0.018377 | 0.009188 |
| M6 | -281.343885814236 | 188.6593 | -1.4913 | 0.142431 | 0.071216 |
| M7 | -737.70923779068 | 187.021625 | -3.9445 | 0.00026 | 0.00013 |
| M8 | -147.638849728842 | 190.777478 | -0.7739 | 0.442797 | 0.221398 |
| M9 | -3.03609424816335 | 187.003763 | -0.0162 | 0.987114 | 0.493557 |
| M10 | -187.498457097383 | 188.136532 | -0.9966 | 0.323952 | 0.161976 |
| M11 | 5.70781212665605 | 187.583098 | 0.0304 | 0.975852 | 0.487926 |
| Multiple Linear Regression - Regression Statistics | |
| Multiple R | 0.889456603915496 |
| R-squared | 0.791133050248887 |
| Adjusted R-squared | 0.738916312811109 |
| F-TEST (value) | 15.1509475518574 |
| F-TEST (DF numerator) | 12 |
| F-TEST (DF denominator) | 48 |
| p-value | 1.84519066692701e-12 |
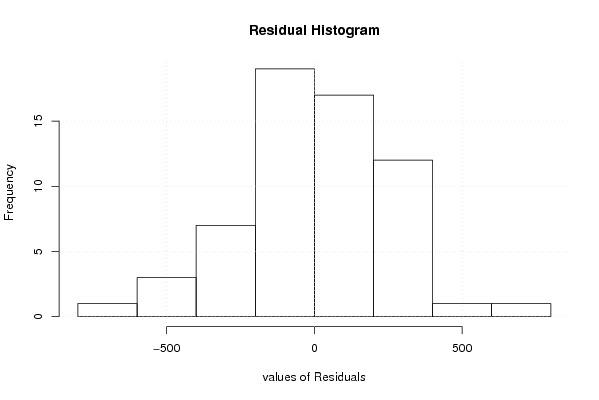
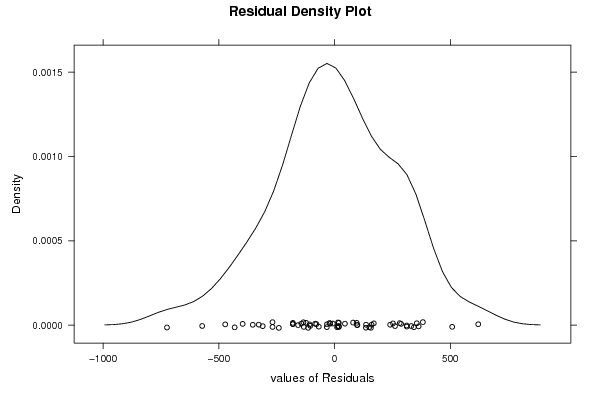
| Multiple Linear Regression - Residual Statistics | |
| Residual Standard Deviation | 295.615397185516 |
| Sum Squared Residuals | 4194646.22655121 |
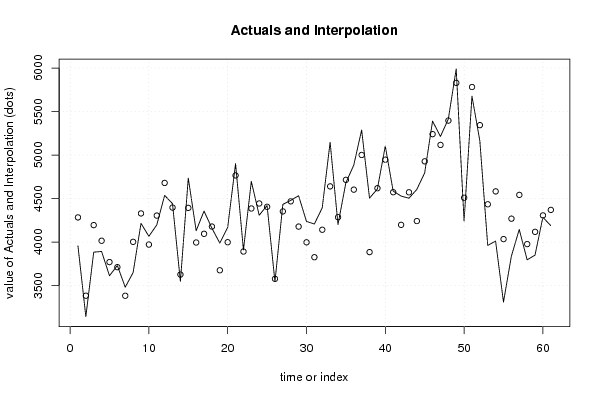
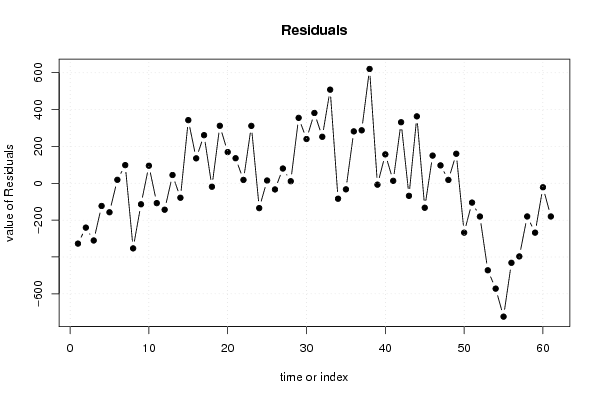
| Multiple Linear Regression - Actuals, Interpolation, and Residuals | |||
| Time or Index | Actuals | Interpolation Forecast | Residuals Prediction Error |
| 1 | 3956.2 | 4283.59486676954 | -327.394866769543 |
| 2 | 3142.7 | 3383.40187945917 | -240.701879459166 |
| 3 | 3884.3 | 4194.77995254410 | -310.479952544095 |
| 4 | 3892.2 | 4015.30388373763 | -123.103883737629 |
| 5 | 3613 | 3770.33635385664 | -157.336353856642 |
| 6 | 3730.5 | 3711.63084611511 | 18.8691538848887 |
| 7 | 3481.3 | 3382.71672104640 | 98.5832789535953 |
| 8 | 3649.5 | 4002.80322142506 | -353.30322142506 |
| 9 | 4215.2 | 4329.32003260708 | -114.120032607077 |
| 10 | 4066.6 | 3971.32702042626 | 95.2729795737447 |
| 11 | 4196.8 | 4304.47168828358 | -107.671688283582 |
| 12 | 4536.6 | 4680.00367771213 | -143.403677712131 |
| 13 | 4441.6 | 4396.80016537066 | 44.7998346293384 |
| 14 | 3548.3 | 3626.81379027836 | -78.5137902783593 |
| 15 | 4735.9 | 4393.22632010743 | 342.673679892569 |
| 16 | 4130.6 | 3995.19543349414 | 135.404566505865 |
| 17 | 4356.2 | 4095.00281872097 | 261.19718127903 |
| 18 | 4159.6 | 4178.22896707127 | -18.6289670712657 |
| 19 | 3988 | 3675.96006832906 | 312.039931670936 |
| 20 | 4167.8 | 3998.4063299724 | 169.393670027599 |
| 21 | 4902.2 | 4766.312417782 | 135.887582218004 |
| 22 | 3909.4 | 3891.06909511039 | 18.3309048896106 |
| 23 | 4697.6 | 4386.07799364493 | 311.52200635507 |
| 24 | 4308.9 | 4443.68541843656 | -134.785418436562 |
| 25 | 4420.4 | 4405.41807261787 | 14.9819273821264 |
| 26 | 3544.2 | 3577.62723122795 | -33.4272312279492 |
| 27 | 4433 | 4352.89216918171 | 80.1078308182923 |
| 28 | 4479.7 | 4468.5354546777 | 11.1645453222989 |
| 29 | 4533.2 | 4178.07475456654 | 355.125245433462 |
| 30 | 4237.5 | 3997.3115400992 | 240.188459900802 |
| 31 | 4207.4 | 3825.86475425505 | 381.535245744953 |
| 32 | 4394 | 4141.68636610971 | 252.313633890290 |
| 33 | 5148.4 | 4640.32682135848 | 508.073178641522 |
| 34 | 4202.2 | 4285.96857277852 | -83.7685727785211 |
| 35 | 4682.5 | 4715.37585083939 | -32.8758508393926 |
| 36 | 4884.3 | 4602.67701336471 | 281.622986635295 |
| 37 | 5288.9 | 5001.40205272094 | 287.497947279064 |
| 38 | 4505.2 | 3884.64750506227 | 620.552494937727 |
| 39 | 4611.5 | 4618.99203989662 | -7.49203989661987 |
| 40 | 5104 | 4947.09312038509 | 156.906879614912 |
| 41 | 4586.6 | 4573.38460877025 | 13.2153912297498 |
| 42 | 4529.3 | 4197.92704077918 | 331.372959220822 |
| 43 | 4504.1 | 4572.33967247778 | -68.2396724777777 |
| 44 | 4604.9 | 4241.70099035286 | 363.199009647144 |
| 45 | 4795.4 | 4928.23527367858 | -132.835273678579 |
| 46 | 5391.1 | 5240.79752063791 | 150.302479362087 |
| 47 | 5213.9 | 5116.8999782962 | 97.000021703803 |
| 48 | 5415 | 5396.75560971489 | 18.2443902851101 |
| 49 | 5990.3 | 5830.01090327933 | 160.289096720666 |
| 50 | 4241.8 | 4509.70959397225 | -267.909593972253 |
| 51 | 5677.6 | 5782.40951827015 | -104.809518270146 |
| 52 | 5164.2 | 5344.57210770545 | -180.372107705446 |
| 53 | 3962.3 | 4434.5014640856 | -472.2014640856 |
| 54 | 4011 | 4582.80160593525 | -571.801605935248 |
| 55 | 3310.3 | 4034.21878389171 | -723.918783891706 |
| 56 | 3837.3 | 4268.90309213997 | -431.603092139972 |
| 57 | 4145.3 | 4542.30545457387 | -397.00545457387 |
| 58 | 3796.7 | 3976.83779104692 | -180.137791046921 |
| 59 | 3849.6 | 4117.5744889359 | -267.974488935898 |
| 60 | 4285 | 4306.67828077171 | -21.6782807717122 |
| 61 | 4189.6 | 4369.77393924165 | -180.173939241652 |
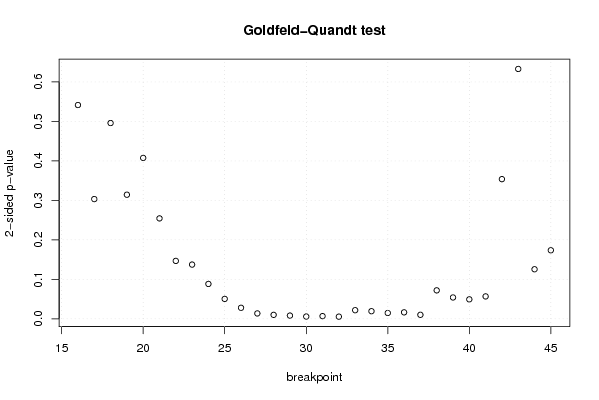
| Goldfeld-Quandt test for Heteroskedasticity | |||
| p-values | Alternative Hypothesis | ||
| breakpoint index | greater | 2-sided | less |
| 16 | 0.270722889029574 | 0.541445778059148 | 0.729277110970426 |
| 17 | 0.151622012065559 | 0.303244024131118 | 0.84837798793444 |
| 18 | 0.247921303582830 | 0.495842607165660 | 0.75207869641717 |
| 19 | 0.157151153771992 | 0.314302307543985 | 0.842848846228008 |
| 20 | 0.203745614972483 | 0.407491229944967 | 0.796254385027517 |
| 21 | 0.127206590666521 | 0.254413181333042 | 0.872793409333479 |
| 22 | 0.0733345749852377 | 0.146669149970475 | 0.926665425014762 |
| 23 | 0.0686811262079924 | 0.137362252415985 | 0.931318873792008 |
| 24 | 0.0441841343275634 | 0.0883682686551268 | 0.955815865672437 |
| 25 | 0.0252304322535084 | 0.0504608645070169 | 0.974769567746492 |
| 26 | 0.0139594264910380 | 0.0279188529820759 | 0.986040573508962 |
| 27 | 0.00684000463085306 | 0.0136800092617061 | 0.993159995369147 |
| 28 | 0.00503414700169722 | 0.0100682940033944 | 0.994965852998303 |
| 29 | 0.00409440560121735 | 0.0081888112024347 | 0.995905594398783 |
| 30 | 0.00289271985870217 | 0.00578543971740433 | 0.997107280141298 |
| 31 | 0.00342068496937366 | 0.00684136993874733 | 0.996579315030626 |
| 32 | 0.00274492079308503 | 0.00548984158617007 | 0.997255079206915 |
| 33 | 0.0109170902748189 | 0.0218341805496377 | 0.989082909725181 |
| 34 | 0.00965492488814803 | 0.0193098497762961 | 0.990345075111852 |
| 35 | 0.00739186518183625 | 0.0147837303636725 | 0.992608134818164 |
| 36 | 0.00820096284288892 | 0.0164019256857778 | 0.99179903715711 |
| 37 | 0.00507987820133806 | 0.0101597564026761 | 0.994920121798662 |
| 38 | 0.0360454057871903 | 0.0720908115743805 | 0.96395459421281 |
| 39 | 0.0270516421175059 | 0.0541032842350117 | 0.972948357882494 |
| 40 | 0.0246543706547390 | 0.0493087413094781 | 0.97534562934526 |
| 41 | 0.0283715483308167 | 0.0567430966616334 | 0.971628451669183 |
| 42 | 0.176889601822002 | 0.353779203644004 | 0.823110398177998 |
| 43 | 0.31641573611604 | 0.63283147223208 | 0.68358426388396 |
| 44 | 0.937226582306678 | 0.125546835386644 | 0.0627734176933219 |
| 45 | 0.913186303531024 | 0.173627392937952 | 0.086813696468976 |
| Meta Analysis of Goldfeld-Quandt test for Heteroskedasticity | |||
| Description | # significant tests | % significant tests | OK/NOK |
| 1% type I error level | 4 | 0.133333333333333 | NOK |
| 5% type I error level | 13 | 0.433333333333333 | NOK |
| 10% type I error level | 18 | 0.6 | NOK |