| Multiple Linear Regression - Estimated Regression Equation |
| Y[t] = + 249.278046103183 + 1.72722283205269X[t] + 0.672557628979011M1[t] -1.25466520307351M2[t] -39.6530186608123M3[t] -48.85268935236M4[t] -51.2527991218441M5[t] -37.3987925356751M6[t] -28.3992316136114M7[t] -17.6175631174533M8[t] -10.9085620197585M9[t] -6.92689352360042M10[t] -2.63622392974752M11[t] + e[t] |
| Multiple Linear Regression - Ordinary Least Squares | |||||
| Variable | Parameter | S.D. | T-STAT H0: parameter = 0 | 2-tail p-value | 1-tail p-value |
| (Intercept) | 249.278046103183 | 14.948085 | 16.6763 | 0 | 0 |
| X | 1.72722283205269 | 0.129112 | 13.3778 | 0 | 0 |
| M1 | 0.672557628979011 | 8.259952 | 0.0814 | 0.935451 | 0.467725 |
| M2 | -1.25466520307351 | 8.254097 | -0.152 | 0.879834 | 0.439917 |
| M3 | -39.6530186608123 | 9.145656 | -4.3357 | 7.6e-05 | 3.8e-05 |
| M4 | -48.85268935236 | 9.544759 | -5.1183 | 6e-06 | 3e-06 |
| M5 | -51.2527991218441 | 9.40503 | -5.4495 | 2e-06 | 1e-06 |
| M6 | -37.3987925356751 | 8.820238 | -4.2401 | 0.000104 | 5.2e-05 |
| M7 | -28.3992316136114 | 8.484545 | -3.3472 | 0.001614 | 0.000807 |
| M8 | -17.6175631174533 | 8.402217 | -2.0968 | 0.041421 | 0.020711 |
| M9 | -10.9085620197585 | 8.361048 | -1.3047 | 0.198351 | 0.099176 |
| M10 | -6.92689352360042 | 8.30644 | -0.8339 | 0.408545 | 0.204273 |
| M11 | -2.63622392974752 | 8.256197 | -0.3193 | 0.750912 | 0.375456 |
| Multiple Linear Regression - Regression Statistics | |
| Multiple R | 0.896840328544436 |
| R-squared | 0.804322574903692 |
| Adjusted R-squared | 0.75436238126208 |
| F-TEST (value) | 16.0992685631585 |
| F-TEST (DF numerator) | 12 |
| F-TEST (DF denominator) | 47 |
| p-value | 8.59312621059871e-13 |
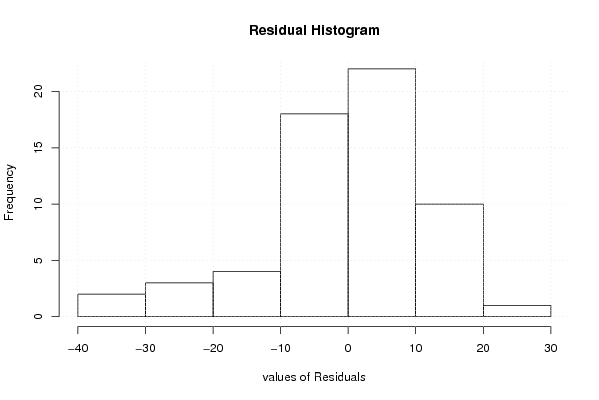
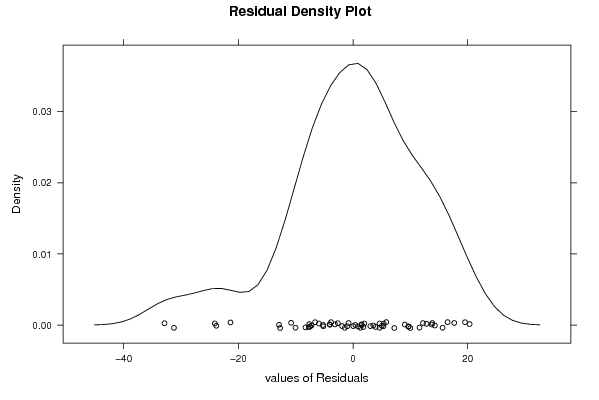
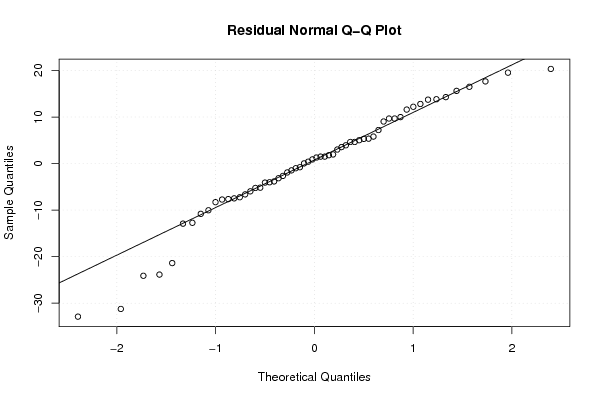
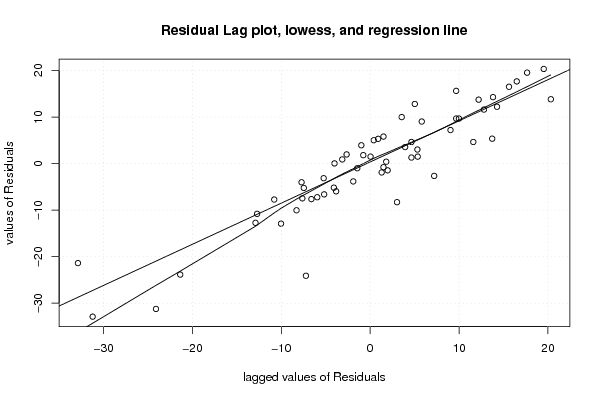
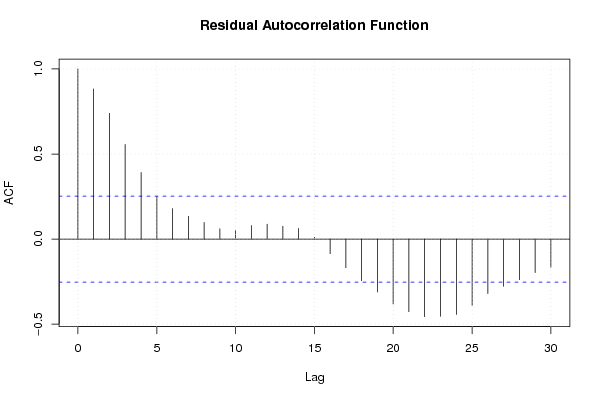
| Multiple Linear Regression - Residual Statistics | |
| Residual Standard Deviation | 13.0416734552831 |
| Sum Squared Residuals | 7994.00658616908 |
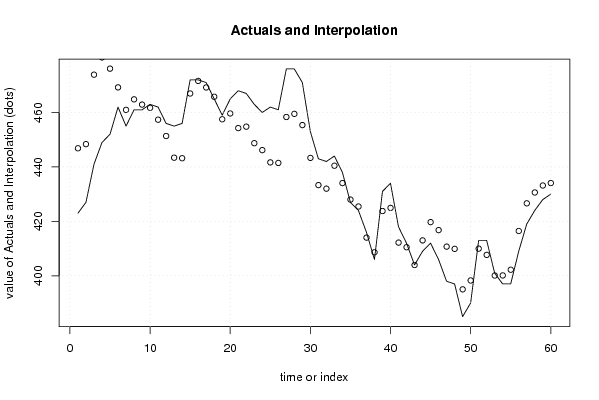
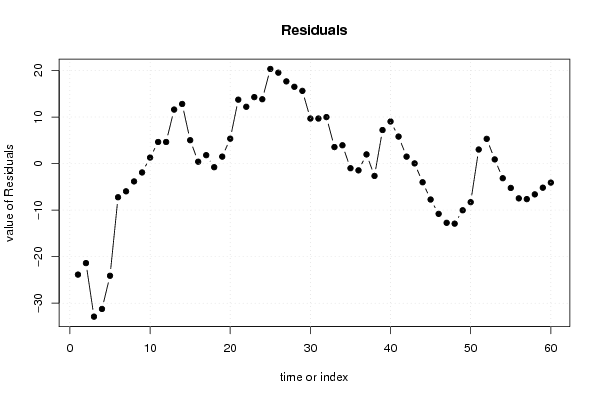
| Multiple Linear Regression - Actuals, Interpolation, and Residuals | |||
| Time or Index | Actuals | Interpolation Forecast | Residuals Prediction Error |
| 1 | 423 | 446.854006586170 | -23.8540065861696 |
| 2 | 427 | 448.381229418222 | -21.3812294182216 |
| 3 | 441 | 473.890120746433 | -32.8901207464325 |
| 4 | 449 | 480.235455543359 | -31.2354555433589 |
| 5 | 452 | 476.108122941822 | -24.1081229418222 |
| 6 | 462 | 469.235455543359 | -7.23545554335892 |
| 7 | 455 | 460.962788144896 | -5.9627881448957 |
| 8 | 461 | 464.835565312843 | -3.83556531284300 |
| 9 | 461 | 462.908452250274 | -1.90845225027441 |
| 10 | 463 | 461.708452250274 | 1.29154774972559 |
| 11 | 462 | 457.363007683864 | 4.63699231613612 |
| 12 | 456 | 451.363117453348 | 4.63688254665204 |
| 13 | 455 | 443.399560922064 | 11.6004390779365 |
| 14 | 456 | 443.199560922064 | 12.8004390779363 |
| 15 | 472 | 466.981229418222 | 5.01877058177828 |
| 16 | 472 | 471.599341383095 | 0.400658616904519 |
| 17 | 471 | 469.199231613611 | 1.80076838638860 |
| 18 | 465 | 465.781009879254 | -0.781009879253558 |
| 19 | 459 | 457.50834248079 | 1.49165751920967 |
| 20 | 465 | 459.653896816685 | 5.34610318331505 |
| 21 | 468 | 454.272338090011 | 13.7276619099890 |
| 22 | 467 | 454.799560922064 | 12.2004390779363 |
| 23 | 463 | 448.7268935236 | 14.2731064763996 |
| 24 | 460 | 446.18144895719 | 13.8185510428101 |
| 25 | 462 | 441.672338090011 | 20.3276619099892 |
| 26 | 461 | 441.472338090011 | 19.527661909989 |
| 27 | 476 | 458.345115257958 | 17.6548847420417 |
| 28 | 476 | 459.508781558727 | 16.4912184412733 |
| 29 | 471 | 455.38144895719 | 15.6185510428101 |
| 30 | 453 | 443.327113062569 | 9.6728869374314 |
| 31 | 443 | 433.327222832053 | 9.67277716794731 |
| 32 | 442 | 432.018331503842 | 9.98166849615806 |
| 33 | 444 | 440.454555433589 | 3.54544456641054 |
| 34 | 438 | 434.072886937431 | 3.9271130625686 |
| 35 | 427 | 428.000219538968 | -1.00021953896817 |
| 36 | 424 | 425.454774972558 | -1.45477497255762 |
| 37 | 416 | 414.036772777168 | 1.96322722283220 |
| 38 | 406 | 408.65510428101 | -2.65510428100992 |
| 39 | 431 | 423.800658616905 | 7.1993413830955 |
| 40 | 434 | 424.964324917673 | 9.03567508232711 |
| 41 | 418 | 412.200878155873 | 5.79912184412733 |
| 42 | 412 | 410.509879253568 | 1.49012074643247 |
| 43 | 404 | 403.964434687157 | 0.0355653128430213 |
| 44 | 409 | 413.018880351262 | -4.01888035126236 |
| 45 | 412 | 419.727881448957 | -7.72788144895719 |
| 46 | 406 | 416.800658616905 | -10.8006586169045 |
| 47 | 398 | 410.727991218441 | -12.7279912184413 |
| 48 | 397 | 409.909769484083 | -12.9097694840834 |
| 49 | 385 | 395.037321624588 | -10.0373216245882 |
| 50 | 390 | 398.291767288694 | -8.29176728869379 |
| 51 | 413 | 409.982875960483 | 3.01712403951701 |
| 52 | 413 | 407.692096597146 | 5.30790340285399 |
| 53 | 401 | 400.110318331504 | 0.889681668496137 |
| 54 | 397 | 400.146542261251 | -3.1465422612514 |
| 55 | 397 | 402.237211855104 | -5.2372118551043 |
| 56 | 409 | 416.473326015368 | -7.47332601536774 |
| 57 | 419 | 426.636772777168 | -7.63677277716795 |
| 58 | 424 | 430.618441273326 | -6.61844127332602 |
| 59 | 428 | 433.181888035126 | -5.18188803512624 |
| 60 | 430 | 434.090889132821 | -4.09088913282107 |
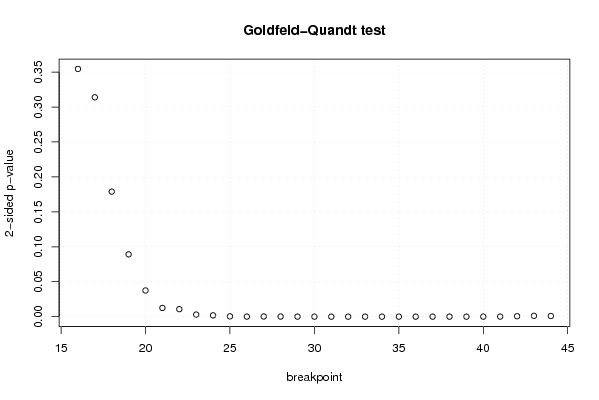
| Goldfeld-Quandt test for Heteroskedasticity | |||
| p-values | Alternative Hypothesis | ||
| breakpoint index | greater | 2-sided | less |
| 16 | 0.822774092680115 | 0.354451814639770 | 0.177225907319885 |
| 17 | 0.843066406760073 | 0.313867186479855 | 0.156933593239927 |
| 18 | 0.910536822597323 | 0.178926354805353 | 0.0894631774026766 |
| 19 | 0.95543775907487 | 0.089124481850259 | 0.0445622409251295 |
| 20 | 0.981281106216034 | 0.0374377875679309 | 0.0187188937839655 |
| 21 | 0.993762031933417 | 0.0124759361331656 | 0.00623796806658282 |
| 22 | 0.994632738048926 | 0.0107345239021483 | 0.00536726195107413 |
| 23 | 0.998509907921172 | 0.00298018415765596 | 0.00149009207882798 |
| 24 | 0.99907506990515 | 0.00184986018970020 | 0.000924930094850099 |
| 25 | 0.99977529973006 | 0.000449400539878131 | 0.000224700269939066 |
| 26 | 0.999952265890444 | 9.54682191113312e-05 | 4.77341095556656e-05 |
| 27 | 0.999892641387798 | 0.000214717224403220 | 0.000107358612201610 |
| 28 | 0.99993517937495 | 0.000129641250098083 | 6.48206250490413e-05 |
| 29 | 0.999975397971088 | 4.92040578248489e-05 | 2.46020289124245e-05 |
| 30 | 0.999998930119707 | 2.13976058567414e-06 | 1.06988029283707e-06 |
| 31 | 0.999999229378057 | 1.54124388674602e-06 | 7.70621943373008e-07 |
| 32 | 0.999999768055438 | 4.6388912463921e-07 | 2.31944562319605e-07 |
| 33 | 0.999999558119687 | 8.83760626570498e-07 | 4.41880313285249e-07 |
| 34 | 0.999999915768556 | 1.68462887994463e-07 | 8.42314439972317e-08 |
| 35 | 0.99999995227226 | 9.5455478169989e-08 | 4.77277390849945e-08 |
| 36 | 0.999999977080932 | 4.58381359462264e-08 | 2.29190679731132e-08 |
| 37 | 0.99999997705549 | 4.58890186888941e-08 | 2.29445093444471e-08 |
| 38 | 0.99999989280515 | 2.1438970039435e-07 | 1.07194850197175e-07 |
| 39 | 0.999999052144334 | 1.89571133181989e-06 | 9.47855665909943e-07 |
| 40 | 0.999993927436394 | 1.21451272126162e-05 | 6.0725636063081e-06 |
| 41 | 0.999954768448811 | 9.0463102376881e-05 | 4.52315511884405e-05 |
| 42 | 0.999703912921787 | 0.000592174156425752 | 0.000296087078212876 |
| 43 | 0.999409790047642 | 0.00118041990471695 | 0.000590209952358475 |
| 44 | 0.999534872564838 | 0.00093025487032365 | 0.000465127435161825 |
| Meta Analysis of Goldfeld-Quandt test for Heteroskedasticity | |||
| Description | # significant tests | % significant tests | OK/NOK |
| 1% type I error level | 22 | 0.758620689655172 | NOK |
| 5% type I error level | 25 | 0.862068965517241 | NOK |
| 10% type I error level | 26 | 0.896551724137931 | NOK |