| Multiple Linear Regression - Estimated Regression Equation |
| Y[t] = + 18.5409969905715 -8.0136453659114X[t] + 0.225676466959048Y2[t] + 0.498893804159903Y3[t] + 18.3064593889371M1[t] + 28.6879785879254M2[t] + 13.2859080260186M3[t] -1.80667924380932M4[t] -0.136043592039938M5[t] + 6.07029217326375M6[t] + 18.5460854982676M7[t] + 11.8823072850028M8[t] + 8.60168591430853M9[t] + 14.7499723635447M10[t] -9.35028017631675M11[t] + 0.0761286399636236t + e[t] |
| Multiple Linear Regression - Ordinary Least Squares | |||||
| Variable | Parameter | S.D. | T-STAT H0: parameter = 0 | 2-tail p-value | 1-tail p-value |
| (Intercept) | 18.5409969905715 | 15.852145 | 1.1696 | 0.248749 | 0.124374 |
| X | -8.0136453659114 | 2.365898 | -3.3871 | 0.001544 | 0.000772 |
| Y2 | 0.225676466959048 | 0.112752 | 2.0015 | 0.051823 | 0.025912 |
| Y3 | 0.498893804159903 | 0.1159 | 4.3045 | 9.8e-05 | 4.9e-05 |
| M1 | 18.3064593889371 | 3.91496 | 4.676 | 3e-05 | 1.5e-05 |
| M2 | 28.6879785879254 | 3.198447 | 8.9693 | 0 | 0 |
| M3 | 13.2859080260186 | 2.456033 | 5.4095 | 3e-06 | 1e-06 |
| M4 | -1.80667924380932 | 2.657664 | -0.6798 | 0.500361 | 0.250181 |
| M5 | -0.136043592039938 | 2.73368 | -0.0498 | 0.960545 | 0.480272 |
| M6 | 6.07029217326375 | 2.839008 | 2.1382 | 0.038365 | 0.019183 |
| M7 | 18.5460854982676 | 2.807387 | 6.6062 | 0 | 0 |
| M8 | 11.8823072850028 | 2.746246 | 4.3267 | 9.2e-05 | 4.6e-05 |
| M9 | 8.60168591430853 | 2.425351 | 3.5466 | 0.000975 | 0.000487 |
| M10 | 14.7499723635447 | 2.700259 | 5.4624 | 2e-06 | 1e-06 |
| M11 | -9.35028017631675 | 2.661259 | -3.5135 | 0.001073 | 0.000537 |
| t | 0.0761286399636236 | 0.052053 | 1.4625 | 0.151043 | 0.075522 |
| Multiple Linear Regression - Regression Statistics | |
| Multiple R | 0.94385972161455 |
| R-squared | 0.890871174086295 |
| Adjusted R-squared | 0.851896593402829 |
| F-TEST (value) | 22.8577487804564 |
| F-TEST (DF numerator) | 15 |
| F-TEST (DF denominator) | 42 |
| p-value | 1.77635683940025e-15 |
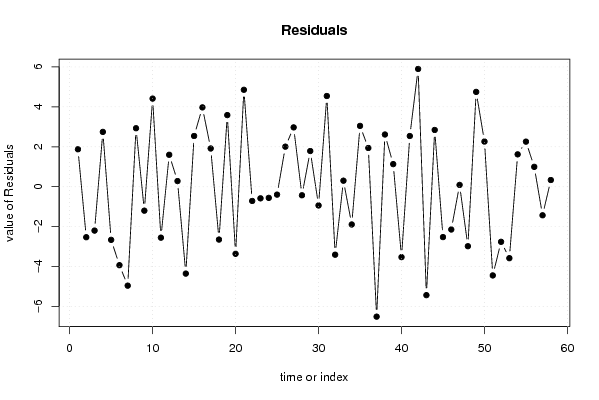
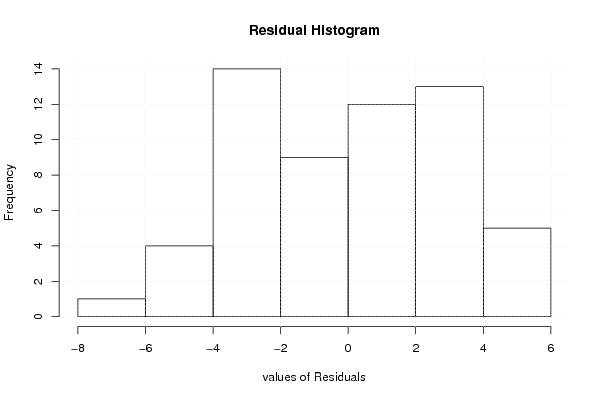
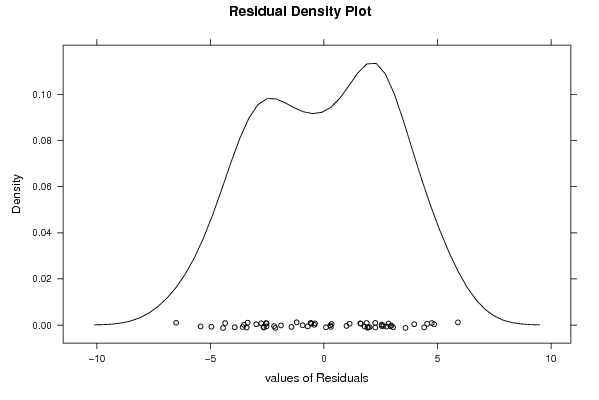
| Multiple Linear Regression - Residual Statistics | |
| Residual Standard Deviation | 3.50314977912597 |
| Sum Squared Residuals | 515.426451749593 |
| Multiple Linear Regression - Actuals, Interpolation, and Residuals | |||
| Time or Index | Actuals | Interpolation Forecast | Residuals Prediction Error |
| 1 | 114.1 | 112.224478015106 | 1.87552198489374 |
| 2 | 110.3 | 112.830033343636 | -2.53003334363553 |
| 3 | 103.9 | 106.097896059187 | -2.19789605918694 |
| 4 | 101.6 | 98.8547296668446 | 2.74527033315539 |
| 5 | 94.6 | 97.261368114232 | -2.66136811423205 |
| 6 | 95.9 | 99.8318562988702 | -3.93185629887019 |
| 7 | 104.7 | 109.656587245557 | -4.95658724555654 |
| 8 | 102.8 | 99.8700604501829 | 2.92993954981713 |
| 9 | 98.1 | 99.3000825740997 | -1.20008257409967 |
| 10 | 113.9 | 109.485977852684 | 4.41402214731561 |
| 11 | 80.9 | 83.4532763301753 | -2.55327633017525 |
| 12 | 95.7 | 94.100572444857 | 1.59942755514298 |
| 13 | 113.2 | 112.918359169836 | 0.281640830164382 |
| 14 | 105.9 | 110.252523182505 | -4.35252318250465 |
| 15 | 108.8 | 106.259547733911 | 2.54045226608862 |
| 16 | 102.3 | 98.3262924680444 | 3.97370753195563 |
| 17 | 99 | 97.0855937435913 | 1.91440625640868 |
| 18 | 100.7 | 103.347953145689 | -2.64795314568853 |
| 19 | 115.5 | 111.912333042652 | 3.58766695734823 |
| 20 | 100.7 | 104.061983909453 | -3.36198390945335 |
| 21 | 109.9 | 105.045622356788 | 4.8543776432116 |
| 22 | 114.6 | 115.313654036561 | -0.713654036560848 |
| 23 | 85.4 | 85.9821253311197 | -0.582125331119699 |
| 24 | 100.5 | 101.059036540379 | -0.559036540378706 |
| 25 | 114.8 | 115.196672613627 | -0.396672613626765 |
| 26 | 116.5 | 114.494336022191 | 2.00566397780888 |
| 27 | 112.9 | 109.928864020577 | 2.97113597942311 |
| 28 | 102 | 102.430236784030 | -0.430236784029603 |
| 29 | 106 | 104.212685261782 | 1.78731473821812 |
| 30 | 105.3 | 106.239258482220 | -0.939258482219917 |
| 31 | 118.8 | 114.255943849681 | 4.54405615031937 |
| 32 | 106.1 | 109.505895966148 | -3.40589596614779 |
| 33 | 109.3 | 108.998809876452 | 0.301190123547688 |
| 34 | 117.2 | 119.092200191431 | -1.89220019143086 |
| 35 | 92.5 | 89.4542896729712 | 3.04571032702876 |
| 36 | 104.2 | 102.260002751540 | 1.93999724846023 |
| 37 | 112.5 | 119.009643099415 | -6.50964309941524 |
| 38 | 122.4 | 119.785028639038 | 2.61497136096161 |
| 39 | 113.3 | 112.169258901526 | 1.13074109847380 |
| 40 | 100 | 103.527815869084 | -3.5278158690837 |
| 41 | 110.7 | 108.159972972672 | 2.54002702732759 |
| 42 | 112.8 | 106.901006749529 | 5.89899325047074 |
| 43 | 109.8 | 115.232379315632 | -5.43237931563184 |
| 44 | 117.3 | 114.456814027456 | 2.84318597254432 |
| 45 | 109.1 | 111.622968884584 | -2.52296888458364 |
| 46 | 115.9 | 118.043276063497 | -2.14327606349656 |
| 47 | 96 | 95.9103086657338 | 0.0896913342661778 |
| 48 | 99.8 | 102.780388263225 | -2.98038826322451 |
| 49 | 116.8 | 112.050847102016 | 4.74915289798389 |
| 50 | 115.7 | 113.438078812630 | 2.26192118736969 |
| 51 | 99.4 | 103.844433284799 | -4.44443328479859 |
| 52 | 94.3 | 97.0609252119977 | -2.76092521199773 |
| 53 | 91 | 94.5803799077223 | -3.58037990772235 |
| 54 | 93.2 | 91.5799253236921 | 1.62007467630791 |
| 55 | 103.1 | 100.842756546479 | 2.25724345352080 |
| 56 | 94.1 | 93.1052456467603 | 0.994754353239697 |
| 57 | 91.8 | 93.232516308076 | -1.43251630807598 |
| 58 | 102.7 | 102.364891855827 | 0.335108144172656 |
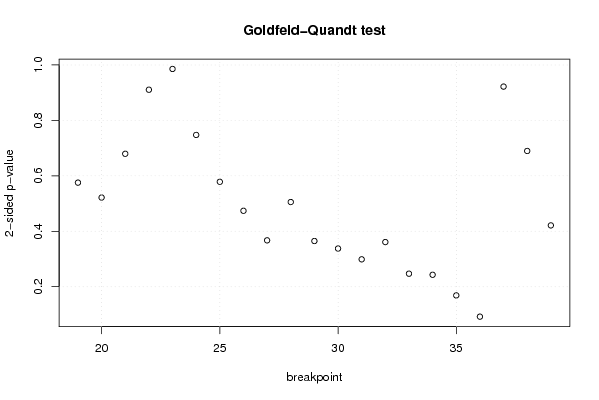
| Goldfeld-Quandt test for Heteroskedasticity | |||
| p-values | Alternative Hypothesis | ||
| breakpoint index | greater | 2-sided | less |
| 19 | 0.287696747345666 | 0.575393494691332 | 0.712303252654334 |
| 20 | 0.739188098298449 | 0.521623803403103 | 0.260811901701551 |
| 21 | 0.660282321708552 | 0.679435356582896 | 0.339717678291448 |
| 22 | 0.544702404801202 | 0.910595190397597 | 0.455297595198798 |
| 23 | 0.492792836413224 | 0.985585672826448 | 0.507207163586776 |
| 24 | 0.373731873895802 | 0.747463747791604 | 0.626268126104198 |
| 25 | 0.289211651401221 | 0.578423302802441 | 0.71078834859878 |
| 26 | 0.236922357185493 | 0.473844714370987 | 0.763077642814507 |
| 27 | 0.183594730143523 | 0.367189460287045 | 0.816405269856477 |
| 28 | 0.252708837189676 | 0.505417674379351 | 0.747291162810324 |
| 29 | 0.182376757131332 | 0.364753514262663 | 0.817623242868668 |
| 30 | 0.168823884921462 | 0.337647769842923 | 0.831176115078538 |
| 31 | 0.149364864214165 | 0.298729728428329 | 0.850635135785835 |
| 32 | 0.180490895824978 | 0.360981791649955 | 0.819509104175022 |
| 33 | 0.123429724244347 | 0.246859448488694 | 0.876570275755653 |
| 34 | 0.121501546956418 | 0.243003093912836 | 0.878498453043582 |
| 35 | 0.0842901828891745 | 0.168580365778349 | 0.915709817110826 |
| 36 | 0.0459485009618291 | 0.0918970019236582 | 0.95405149903817 |
| 37 | 0.460943463167483 | 0.921886926334967 | 0.539056536832517 |
| 38 | 0.344836771865477 | 0.689673543730954 | 0.655163228134523 |
| 39 | 0.210579891507467 | 0.421159783014934 | 0.789420108492533 |
| Meta Analysis of Goldfeld-Quandt test for Heteroskedasticity | |||
| Description | # significant tests | % significant tests | OK/NOK |
| 1% type I error level | 0 | 0 | OK |
| 5% type I error level | 0 | 0 | OK |
| 10% type I error level | 1 | 0.0476190476190476 | OK |