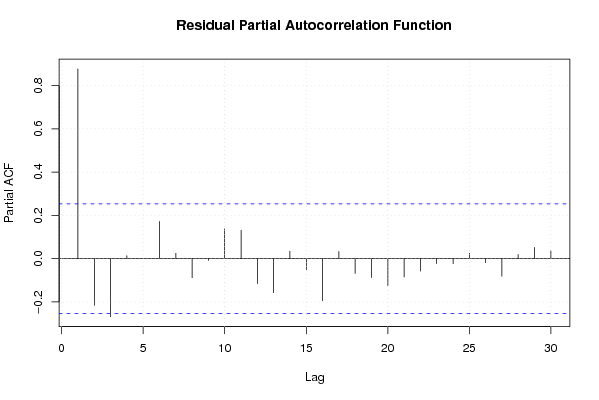
| Multiple Linear Regression - Estimated Regression Equation |
| Y[t] = + 210.097277375847 + 2.01219960132561X[t] + 4.33105354315315M1[t] + 1.87434713285987M2[t] -46.1727465198532M3[t] -57.4977706975701M4[t] -59.5154383836216M5[t] -42.8281894982728M6[t] -31.5653398155752M7[t] -20.1732478205662M8[t] -13.195795347148M9[t] -8.60370335213898M10[t] -3.18965207474387M11[t] + 0.244506808967836t + e[t] |
| Multiple Linear Regression - Ordinary Least Squares | |||||
| Variable | Parameter | S.D. | T-STAT H0: parameter = 0 | 2-tail p-value | 1-tail p-value |
| (Intercept) | 210.097277375847 | 38.65252 | 5.4355 | 2e-06 | 1e-06 |
| X | 2.01219960132561 | 0.289594 | 6.9484 | 0 | 0 |
| M1 | 4.33105354315315 | 8.888965 | 0.4872 | 0.628403 | 0.314201 |
| M2 | 1.87434713285987 | 8.714392 | 0.2151 | 0.830651 | 0.415325 |
| M3 | -46.1727465198532 | 10.885047 | -4.2419 | 0.000106 | 5.3e-05 |
| M4 | -57.4977706975701 | 12.353443 | -4.6544 | 2.8e-05 | 1.4e-05 |
| M5 | -59.5154383836216 | 12.025613 | -4.9491 | 1e-05 | 5e-06 |
| M6 | -42.8281894982728 | 10.093164 | -4.2433 | 0.000106 | 5.3e-05 |
| M7 | -31.5653398155752 | 8.942847 | -3.5297 | 0.000957 | 0.000479 |
| M8 | -20.1732478205662 | 8.700421 | -2.3187 | 0.024911 | 0.012456 |
| M9 | -13.195795347148 | 8.598451 | -1.5347 | 0.131715 | 0.065857 |
| M10 | -8.60370335213898 | 8.427509 | -1.0209 | 0.312638 | 0.156319 |
| M11 | -3.18965207474387 | 8.253434 | -0.3865 | 0.700935 | 0.350468 |
| t | 0.244506808967836 | 0.222528 | 1.0988 | 0.277587 | 0.138794 |
| Multiple Linear Regression - Regression Statistics | |
| Multiple R | 0.899625961873798 |
| R-squared | 0.809326871277356 |
| Adjusted R-squared | 0.75544098707313 |
| F-TEST (value) | 15.0192742167882 |
| F-TEST (DF numerator) | 13 |
| F-TEST (DF denominator) | 46 |
| p-value | 2.02726724296554e-12 |
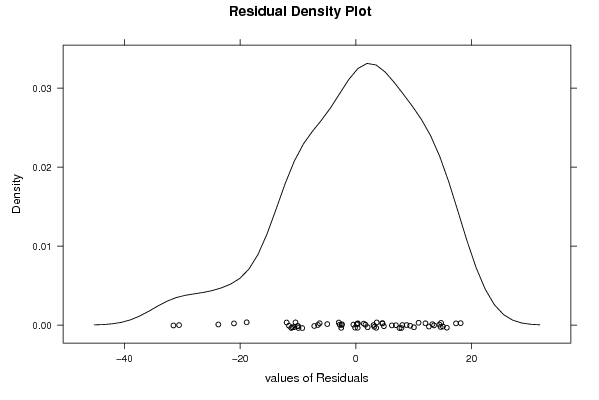
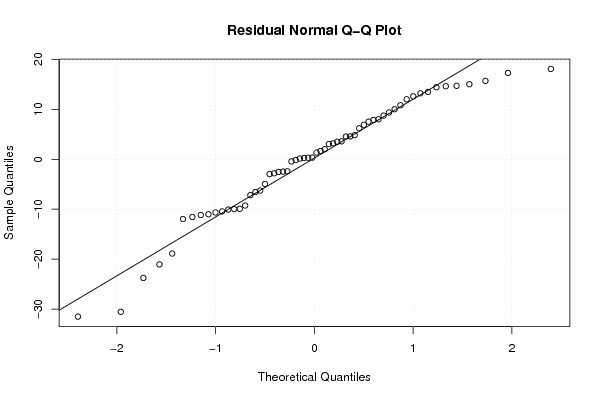
| Multiple Linear Regression - Residual Statistics | |
| Residual Standard Deviation | 13.0130086667657 |
| Sum Squared Residuals | 7789.5661498207 |
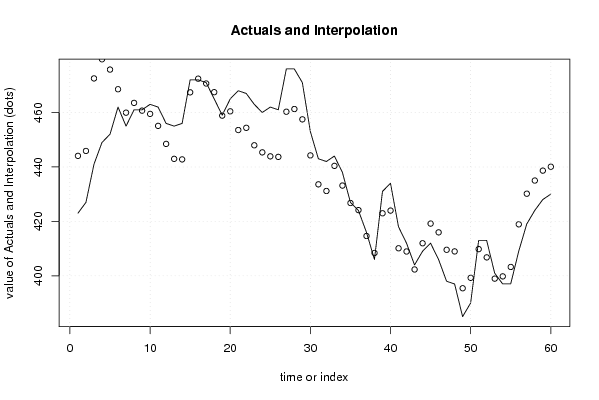
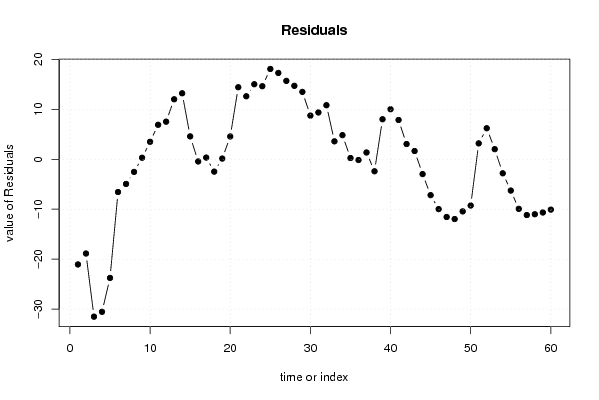
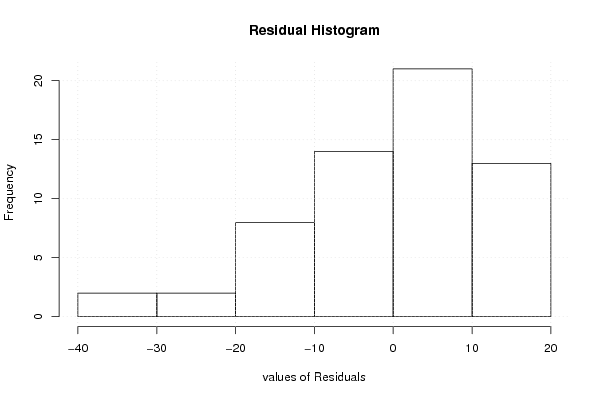
| Multiple Linear Regression - Actuals, Interpolation, and Residuals | |||
| Time or Index | Actuals | Interpolation Forecast | Residuals Prediction Error |
| 1 | 423 | 444.063592279089 | -21.0635922790891 |
| 2 | 427 | 445.875791880414 | -18.875791880414 |
| 3 | 441 | 472.524590285717 | -31.5245902857167 |
| 4 | 449 | 479.553869328898 | -30.5538693288981 |
| 5 | 452 | 475.768508850489 | -23.7685088504889 |
| 6 | 462 | 468.553869328898 | -6.55386932889807 |
| 7 | 455 | 459.939229807307 | -4.93922980730737 |
| 8 | 461 | 463.527030205982 | -2.52703020598172 |
| 9 | 461 | 460.68799148174 | 0.312008518260225 |
| 10 | 463 | 459.48799148174 | 3.51200851826021 |
| 11 | 462 | 455.085551561475 | 6.91444843852534 |
| 12 | 456 | 448.458712438558 | 7.54128756144169 |
| 13 | 455 | 442.973274784051 | 12.0267252159488 |
| 14 | 456 | 442.773274784051 | 13.2267252159486 |
| 15 | 472 | 467.409873588028 | 4.5901264119718 |
| 16 | 472 | 472.426953029884 | -0.42695302988406 |
| 17 | 471 | 470.6537921528 | 0.346207847199586 |
| 18 | 465 | 467.463551833861 | -2.46355183386091 |
| 19 | 459 | 458.84891231227 | 0.151087687729826 |
| 20 | 465 | 460.424513109619 | 4.57548689038106 |
| 21 | 468 | 453.561075182726 | 14.4389248172743 |
| 22 | 467 | 454.373274784051 | 12.6267252159486 |
| 23 | 463 | 447.958635262461 | 15.0413647375394 |
| 24 | 460 | 445.356195342196 | 14.6438046578045 |
| 25 | 462 | 443.89515689034 | 18.1048431096604 |
| 26 | 461 | 443.69515689034 | 17.3048431096602 |
| 27 | 476 | 460.282957289014 | 15.7170427109858 |
| 28 | 476 | 461.275637528219 | 14.7243624717812 |
| 29 | 471 | 457.490277049810 | 13.5097229501905 |
| 30 | 453 | 444.239038724242 | 8.76096127575803 |
| 31 | 443 | 433.612199601326 | 9.38780039867439 |
| 32 | 442 | 431.163401196023 | 10.8365988039768 |
| 33 | 444 | 440.397560079735 | 3.60243992026513 |
| 34 | 438 | 433.160961275758 | 4.83903872424196 |
| 35 | 427 | 426.746321754167 | 0.253678245832703 |
| 36 | 424 | 424.143881833902 | -0.143881833902165 |
| 37 | 416 | 414.634044976744 | 1.36595502325616 |
| 38 | 406 | 408.397446172767 | -2.39744617276718 |
| 39 | 431 | 422.973046970116 | 8.02695302988407 |
| 40 | 434 | 423.965727209321 | 10.0342727906794 |
| 41 | 418 | 410.119368724283 | 7.88063127571678 |
| 42 | 412 | 408.941328006669 | 3.05867199333065 |
| 43 | 404 | 402.338888086404 | 1.66111191359578 |
| 44 | 409 | 411.963287289055 | -2.96328728905545 |
| 45 | 412 | 419.185246571442 | -7.18524657144154 |
| 46 | 406 | 415.973046970116 | -9.97304697011593 |
| 47 | 398 | 409.558407448525 | -11.5584074485252 |
| 48 | 397 | 408.968167129586 | -11.9681671295857 |
| 49 | 385 | 395.433931069776 | -10.4339310697761 |
| 50 | 390 | 399.258330272428 | -9.25833027242754 |
| 51 | 413 | 409.809531867125 | 3.19046813287494 |
| 52 | 413 | 406.777812903678 | 6.22218709632153 |
| 53 | 401 | 398.968053222618 | 2.03194677738203 |
| 54 | 397 | 399.80221210633 | -2.8022121063297 |
| 55 | 397 | 403.260770192693 | -6.26077019269264 |
| 56 | 409 | 418.921768199321 | -9.92176819932071 |
| 57 | 419 | 430.168126684358 | -11.1681266843580 |
| 58 | 424 | 435.004725488335 | -11.0047254883349 |
| 59 | 428 | 438.651083973372 | -10.6510839733722 |
| 60 | 430 | 440.073043255758 | -10.0730432557583 |
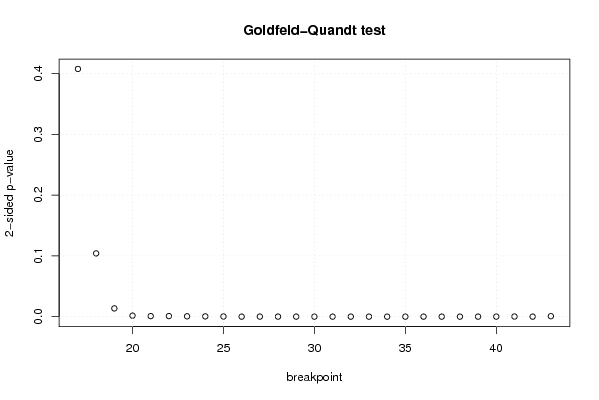
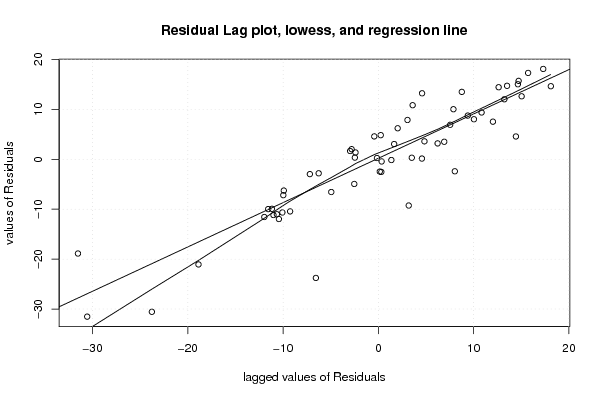
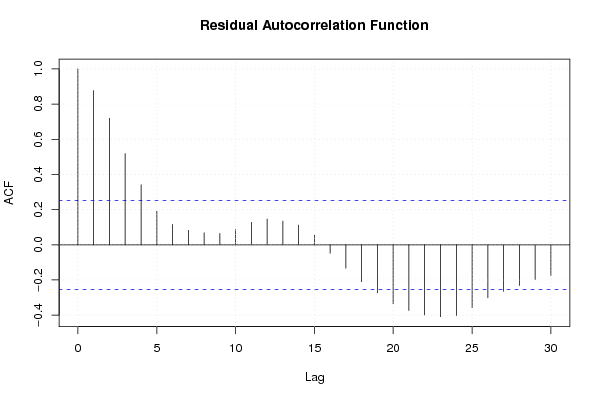
| Goldfeld-Quandt test for Heteroskedasticity | |||
| p-values | Alternative Hypothesis | ||
| breakpoint index | greater | 2-sided | less |
| 17 | 0.203860561261707 | 0.407721122523413 | 0.796139438738293 |
| 18 | 0.947924487538912 | 0.104151024922176 | 0.0520755124610878 |
| 19 | 0.993215065415365 | 0.0135698691692694 | 0.0067849345846347 |
| 20 | 0.999178363433336 | 0.00164327313332895 | 0.000821636566664476 |
| 21 | 0.999557350251942 | 0.000885299496116107 | 0.000442649748058053 |
| 22 | 0.999531968932488 | 0.000936062135024819 | 0.000468031067512409 |
| 23 | 0.999720503396542 | 0.000558993206915858 | 0.000279496603457929 |
| 24 | 0.999765079180705 | 0.000469841638589092 | 0.000234920819294546 |
| 25 | 0.99986907963005 | 0.000261840739900887 | 0.000130920369950443 |
| 26 | 0.999982131685213 | 3.57366295740064e-05 | 1.78683147870032e-05 |
| 27 | 0.999948457969302 | 0.00010308406139658 | 5.154203069829e-05 |
| 28 | 0.99994792676719 | 0.000104146465621301 | 5.20732328106504e-05 |
| 29 | 0.99996808247702 | 6.38350459611116e-05 | 3.19175229805558e-05 |
| 30 | 0.99999596473287 | 8.07053426188669e-06 | 4.03526713094334e-06 |
| 31 | 0.999995986271414 | 8.02745717195955e-06 | 4.01372858597977e-06 |
| 32 | 0.999996207025988 | 7.58594802362209e-06 | 3.79297401181105e-06 |
| 33 | 0.999997162797819 | 5.67440436255619e-06 | 2.83720218127809e-06 |
| 34 | 0.99999897631518 | 2.04736963938165e-06 | 1.02368481969082e-06 |
| 35 | 0.999998695651274 | 2.60869745158581e-06 | 1.30434872579290e-06 |
| 36 | 0.99999851642368 | 2.96715264074869e-06 | 1.48357632037435e-06 |
| 37 | 0.99999808242185 | 3.8351562993739e-06 | 1.91757814968695e-06 |
| 38 | 0.99998954801883 | 2.09039623387719e-05 | 1.04519811693860e-05 |
| 39 | 0.999961555546264 | 7.68889074714701e-05 | 3.84444537357351e-05 |
| 40 | 0.999967087104287 | 6.58257914263479e-05 | 3.29128957131740e-05 |
| 41 | 0.99989938329164 | 0.000201233416721552 | 0.000100616708360776 |
| 42 | 0.999980649510907 | 3.87009781866758e-05 | 1.93504890933379e-05 |
| 43 | 0.999623458638953 | 0.000753082722094944 | 0.000376541361047472 |
| Meta Analysis of Goldfeld-Quandt test for Heteroskedasticity | |||
| Description | # significant tests | % significant tests | OK/NOK |
| 1% type I error level | 24 | 0.888888888888889 | NOK |
| 5% type I error level | 25 | 0.925925925925926 | NOK |
| 10% type I error level | 25 | 0.925925925925926 | NOK |