| Multiple Linear Regression - Estimated Regression Equation |
| gk[t] = + 16.7330571428571 + 4.87594285714285cr[t] + e[t] |
| Multiple Linear Regression - Ordinary Least Squares | |||||
| Variable | Parameter | S.D. | T-STAT H0: parameter = 0 | 2-tail p-value | 1-tail p-value |
| (Intercept) | 16.7330571428571 | 0.273751 | 61.1251 | 0 | 0 |
| cr | 4.87594285714285 | 0.541768 | 9 | 0 | 0 |
| Multiple Linear Regression - Regression Statistics | |
| Multiple R | 0.80178529439649 |
| R-squared | 0.642859658310467 |
| Adjusted R-squared | 0.634923206272922 |
| F-TEST (value) | 81.0008874581833 |
| F-TEST (DF numerator) | 1 |
| F-TEST (DF denominator) | 45 |
| p-value | 1.26689769786026e-11 |
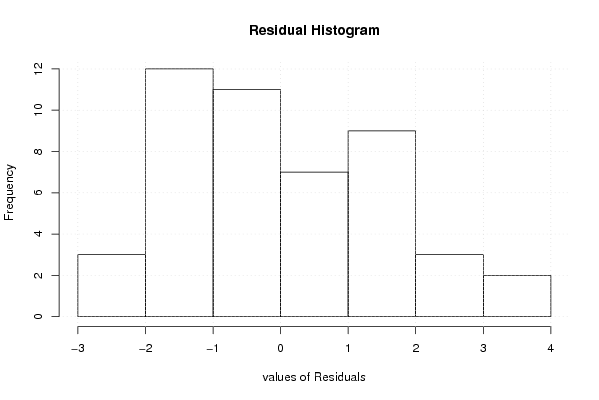
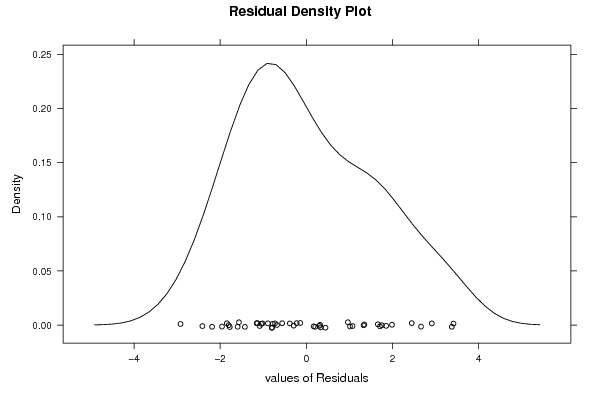
| Multiple Linear Regression - Residual Statistics | |
| Residual Standard Deviation | 1.61953163247015 |
| Sum Squared Residuals | 118.029721885714 |
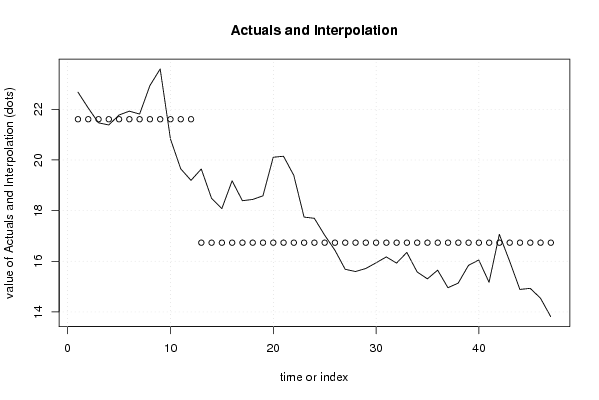
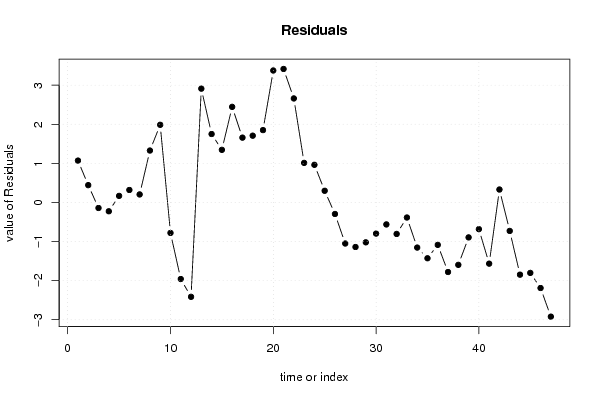
| Multiple Linear Regression - Actuals, Interpolation, and Residuals | |||
| Time or Index | Actuals | Interpolation Forecast | Residuals Prediction Error |
| 1 | 22.68 | 21.6090000000000 | 1.07100000000003 |
| 2 | 22.052 | 21.609 | 0.442999999999986 |
| 3 | 21.467 | 21.609 | -0.142000000000002 |
| 4 | 21.383 | 21.609 | -0.226000000000002 |
| 5 | 21.777 | 21.609 | 0.168000000000000 |
| 6 | 21.928 | 21.609 | 0.319 |
| 7 | 21.814 | 21.609 | 0.204999999999999 |
| 8 | 22.937 | 21.609 | 1.328 |
| 9 | 23.595 | 21.609 | 1.986 |
| 10 | 20.83 | 21.609 | -0.779000000000002 |
| 11 | 19.65 | 21.609 | -1.95900000000000 |
| 12 | 19.195 | 21.609 | -2.414 |
| 13 | 19.644 | 16.7330571428571 | 2.91094285714286 |
| 14 | 18.483 | 16.7330571428571 | 1.74994285714286 |
| 15 | 18.079 | 16.7330571428571 | 1.34594285714286 |
| 16 | 19.178 | 16.7330571428571 | 2.44494285714286 |
| 17 | 18.391 | 16.7330571428571 | 1.65794285714286 |
| 18 | 18.441 | 16.7330571428571 | 1.70794285714286 |
| 19 | 18.584 | 16.7330571428571 | 1.85094285714286 |
| 20 | 20.108 | 16.7330571428571 | 3.37494285714286 |
| 21 | 20.148 | 16.7330571428571 | 3.41494285714286 |
| 22 | 19.394 | 16.7330571428571 | 2.66094285714286 |
| 23 | 17.745 | 16.7330571428571 | 1.01194285714286 |
| 24 | 17.696 | 16.7330571428571 | 0.96294285714286 |
| 25 | 17.032 | 16.7330571428571 | 0.298942857142857 |
| 26 | 16.438 | 16.7330571428571 | -0.295057142857144 |
| 27 | 15.683 | 16.7330571428571 | -1.05005714285714 |
| 28 | 15.594 | 16.7330571428571 | -1.13905714285714 |
| 29 | 15.713 | 16.7330571428571 | -1.02005714285714 |
| 30 | 15.937 | 16.7330571428571 | -0.796057142857143 |
| 31 | 16.171 | 16.7330571428571 | -0.562057142857143 |
| 32 | 15.928 | 16.7330571428571 | -0.805057142857142 |
| 33 | 16.348 | 16.7330571428571 | -0.385057142857144 |
| 34 | 15.579 | 16.7330571428571 | -1.15405714285714 |
| 35 | 15.305 | 16.7330571428571 | -1.42805714285714 |
| 36 | 15.648 | 16.7330571428571 | -1.08505714285714 |
| 37 | 14.954 | 16.7330571428571 | -1.77905714285714 |
| 38 | 15.137 | 16.7330571428571 | -1.59605714285714 |
| 39 | 15.839 | 16.7330571428571 | -0.894057142857142 |
| 40 | 16.05 | 16.7330571428571 | -0.683057142857142 |
| 41 | 15.168 | 16.7330571428571 | -1.56505714285714 |
| 42 | 17.064 | 16.7330571428571 | 0.330942857142857 |
| 43 | 16.005 | 16.7330571428571 | -0.728057142857144 |
| 44 | 14.886 | 16.7330571428571 | -1.84705714285714 |
| 45 | 14.931 | 16.7330571428571 | -1.80205714285714 |
| 46 | 14.544 | 16.7330571428571 | -2.18905714285714 |
| 47 | 13.812 | 16.7330571428571 | -2.92105714285714 |
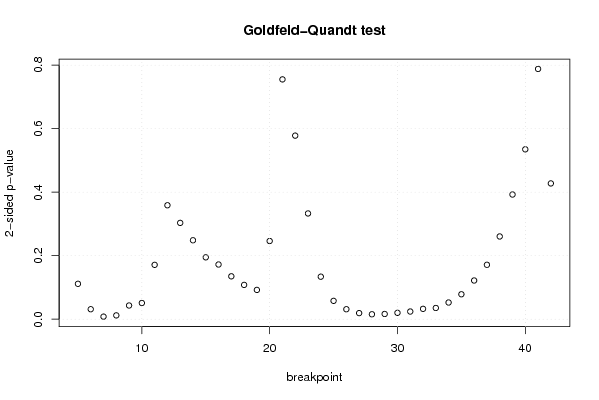
| Goldfeld-Quandt test for Heteroskedasticity | |||
| p-values | Alternative Hypothesis | ||
| breakpoint index | greater | 2-sided | less |
| 5 | 0.0556968813137954 | 0.111393762627591 | 0.944303118686205 |
| 6 | 0.0157062396142837 | 0.0314124792285674 | 0.984293760385716 |
| 7 | 0.00400102778264000 | 0.00800205556527999 | 0.99599897221736 |
| 8 | 0.00598958740391464 | 0.0119791748078293 | 0.994010412596085 |
| 9 | 0.0215659496157015 | 0.043131899231403 | 0.978434050384299 |
| 10 | 0.0255011487879593 | 0.0510022975759186 | 0.97449885121204 |
| 11 | 0.085604802353275 | 0.17120960470655 | 0.914395197646725 |
| 12 | 0.179399017805131 | 0.358798035610261 | 0.82060098219487 |
| 13 | 0.151671086800775 | 0.30334217360155 | 0.848328913199225 |
| 14 | 0.124264909817968 | 0.248529819635936 | 0.875735090182032 |
| 15 | 0.0974309924534262 | 0.194861984906852 | 0.902569007546574 |
| 16 | 0.0861082150067885 | 0.172216430013577 | 0.913891784993212 |
| 17 | 0.0675246864066339 | 0.135049372813268 | 0.932475313593366 |
| 18 | 0.053991806744863 | 0.107983613489726 | 0.946008193255137 |
| 19 | 0.0460950847058376 | 0.0921901694116753 | 0.953904915294162 |
| 20 | 0.123097284423403 | 0.246194568846806 | 0.876902715576597 |
| 21 | 0.377599581009504 | 0.755199162019007 | 0.622400418990496 |
| 22 | 0.710989148588829 | 0.578021702822343 | 0.289010851411171 |
| 23 | 0.833502529508184 | 0.332994940983632 | 0.166497470491816 |
| 24 | 0.933081245439411 | 0.133837509121178 | 0.0669187545605889 |
| 25 | 0.971118277036932 | 0.0577634459261352 | 0.0288817229630676 |
| 26 | 0.984318094821548 | 0.0313638103569051 | 0.0156819051784525 |
| 27 | 0.990416503032685 | 0.0191669939346304 | 0.00958349696731518 |
| 28 | 0.992245711864365 | 0.0155085762712692 | 0.0077542881356346 |
| 29 | 0.99177718066185 | 0.0164456386763007 | 0.00822281933815035 |
| 30 | 0.989958202218674 | 0.0200835955626516 | 0.0100417977813258 |
| 31 | 0.98789806948432 | 0.0242038610313605 | 0.0121019305156802 |
| 32 | 0.983715987747445 | 0.0325680245051095 | 0.0162840122525547 |
| 33 | 0.982346467171078 | 0.0353070656578434 | 0.0176535328289217 |
| 34 | 0.973741052613904 | 0.0525178947721914 | 0.0262589473860957 |
| 35 | 0.960764415845663 | 0.0784711683086734 | 0.0392355841543367 |
| 36 | 0.939075733265088 | 0.121848533469825 | 0.0609242667349124 |
| 37 | 0.914345445018403 | 0.171309109963194 | 0.085654554981597 |
| 38 | 0.869724769962485 | 0.260550460075029 | 0.130275230037515 |
| 39 | 0.803673394666245 | 0.39265321066751 | 0.196326605333755 |
| 40 | 0.732523602577037 | 0.534952794845926 | 0.267476397422963 |
| 41 | 0.605973209167648 | 0.788053581664704 | 0.394026790832352 |
| 42 | 0.786220271167824 | 0.427559457664352 | 0.213779728832176 |
| Meta Analysis of Goldfeld-Quandt test for Heteroskedasticity | |||
| Description | # significant tests | % significant tests | OK/NOK |
| 1% type I error level | 1 | 0.0263157894736842 | NOK |
| 5% type I error level | 12 | 0.315789473684211 | NOK |
| 10% type I error level | 17 | 0.447368421052632 | NOK |