| Multiple Linear Regression - Estimated Regression Equation |
| Werkl[t] = + 134.166581923486 -0.248752759833069Infl[t] -0.0497111330965682t + e[t] |
| Multiple Linear Regression - Ordinary Least Squares | |||||
| Variable | Parameter | S.D. | T-STAT H0: parameter = 0 | 2-tail p-value | 1-tail p-value |
| (Intercept) | 134.166581923486 | 5.760827 | 23.2895 | 0 | 0 |
| Infl | -0.248752759833069 | 0.056039 | -4.4389 | 4.2e-05 | 2.1e-05 |
| t | -0.0497111330965682 | 0.005107 | -9.733 | 0 | 0 |
| Multiple Linear Regression - Regression Statistics | |
| Multiple R | 0.802844482462342 |
| R-squared | 0.644559263020225 |
| Adjusted R-squared | 0.632087658213917 |
| F-TEST (value) | 51.6821429984872 |
| F-TEST (DF numerator) | 2 |
| F-TEST (DF denominator) | 57 |
| p-value | 1.57429624891847e-13 |
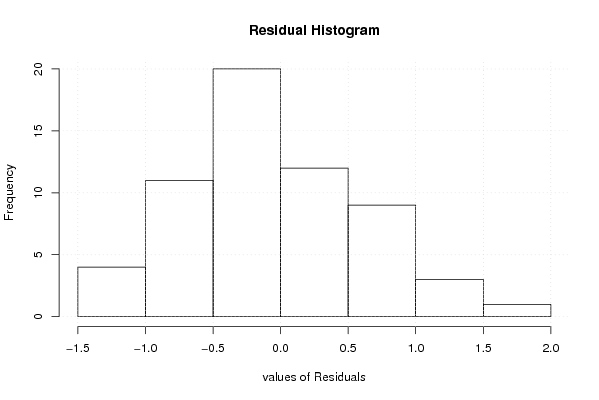
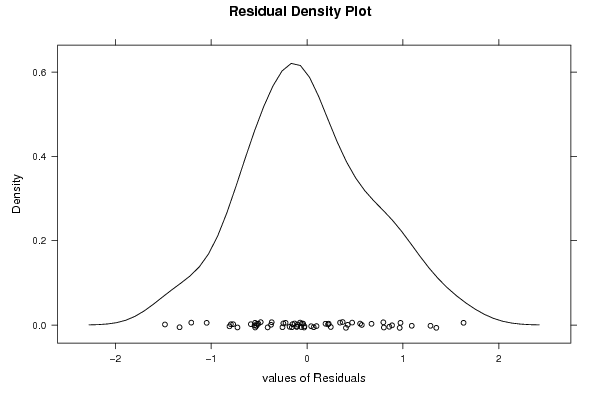
| Multiple Linear Regression - Residual Statistics | |
| Residual Standard Deviation | 0.676541126903235 |
| Sum Squared Residuals | 26.0893500943154 |
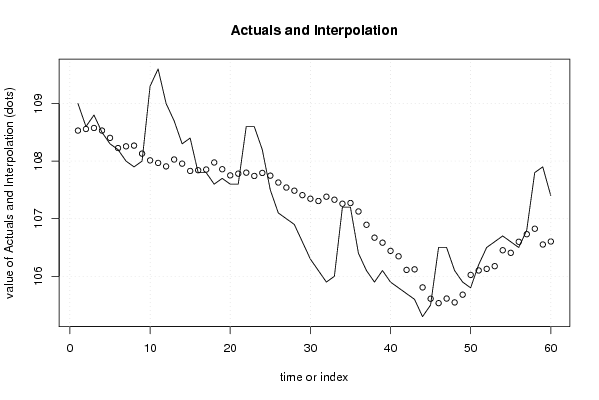
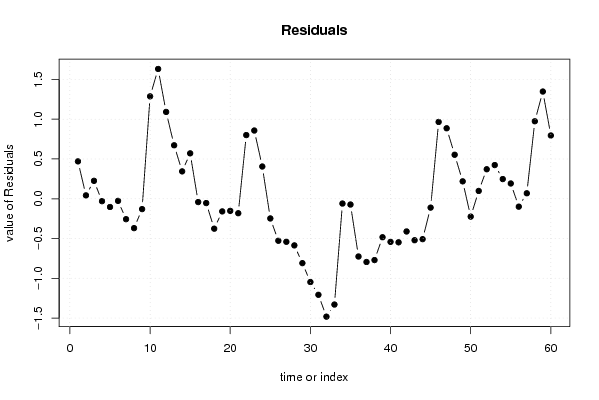
| Multiple Linear Regression - Actuals, Interpolation, and Residuals | |||
| Time or Index | Actuals | Interpolation Forecast | Residuals Prediction Error |
| 1 | 109 | 108.530161913960 | 0.469838086039677 |
| 2 | 108.6 | 108.557564136412 | 0.0424358635880709 |
| 3 | 108.8 | 108.575016248470 | 0.224983751529717 |
| 4 | 108.5 | 108.530280170570 | -0.0302801705703741 |
| 5 | 108.3 | 108.403455681926 | -0.103455681925560 |
| 6 | 108.2 | 108.226880641314 | -0.0268806413141198 |
| 7 | 108 | 108.256770391364 | -0.256770391364135 |
| 8 | 107.9 | 108.269247448226 | -0.369247448225828 |
| 9 | 108 | 108.129985321589 | -0.129985321589361 |
| 10 | 109.3 | 108.013110943338 | 1.28688905666213 |
| 11 | 109.6 | 107.968374865438 | 1.63162513456204 |
| 12 | 109 | 107.908713621948 | 1.09128637805193 |
| 13 | 108.7 | 108.028154365538 | 0.671845634462018 |
| 14 | 108.3 | 107.956055484056 | 0.343944515943554 |
| 15 | 108.4 | 107.829230995412 | 0.570769004588383 |
| 16 | 107.8 | 107.841708052273 | -0.0417080522733249 |
| 17 | 107.8 | 107.854185109135 | -0.054185109135024 |
| 18 | 107.6 | 107.976113380323 | -0.376113380323276 |
| 19 | 107.7 | 107.859239002072 | -0.159239002071771 |
| 20 | 107.6 | 107.752314734214 | -0.152314734213605 |
| 21 | 107.6 | 107.782204484264 | -0.182204484263617 |
| 22 | 108.6 | 107.799656596322 | 0.80034340367802 |
| 23 | 108.6 | 107.742482880430 | 0.85751711956958 |
| 24 | 108.2 | 107.794760378865 | 0.4052396211346 |
| 25 | 107.5 | 107.747536773367 | -0.247536773367167 |
| 26 | 107.1 | 107.628174867517 | -0.528174867517344 |
| 27 | 107 | 107.541150820446 | -0.541150820445809 |
| 28 | 106.9 | 107.486464632153 | -0.586464632152574 |
| 29 | 106.6 | 107.409390695474 | -0.80939069547438 |
| 30 | 106.3 | 107.347241924386 | -1.04724192438616 |
| 31 | 106.1 | 107.307480901683 | -1.20748090168291 |
| 32 | 105.9 | 107.382146148503 | -1.48214614850287 |
| 33 | 106 | 107.329947487808 | -1.32994748780797 |
| 34 | 107.2 | 107.260336133925 | -0.060336133924756 |
| 35 | 107.2 | 107.272813190786 | -0.0728131907864551 |
| 36 | 106.4 | 107.126088481355 | -0.726088481354987 |
| 37 | 106.1 | 106.894787833580 | -0.794787833580292 |
| 38 | 105.9 | 106.670949768601 | -0.770949768600563 |
| 39 | 106.1 | 106.583925721529 | -0.483925721529045 |
| 40 | 105.9 | 106.442176067294 | -0.542176067294232 |
| 41 | 105.8 | 106.347689437428 | -0.547689437427718 |
| 42 | 105.7 | 106.111413734456 | -0.411413734456342 |
| 43 | 105.6 | 106.121403263720 | -0.521403263719718 |
| 44 | 105.3 | 105.8080142052 | -0.508014205200097 |
| 45 | 105.5 | 105.611538943802 | -0.111538943802013 |
| 46 | 106.5 | 105.534465007124 | 0.965534992876192 |
| 47 | 106.5 | 105.614105309140 | 0.885894690859565 |
| 48 | 106.1 | 105.546981482856 | 0.553018517144441 |
| 49 | 105.9 | 105.681347392035 | 0.218652607964551 |
| 50 | 105.8 | 106.024665619475 | -0.224665619475139 |
| 51 | 106.2 | 106.101818393893 | 0.0981816061065688 |
| 52 | 106.5 | 106.129220616345 | 0.370779383654882 |
| 53 | 106.6 | 106.176523059583 | 0.423476940416551 |
| 54 | 106.7 | 106.452678041868 | 0.247321958131807 |
| 55 | 106.6 | 106.407941963968 | 0.192058036031702 |
| 56 | 106.5 | 106.599521007910 | -0.0995210079098005 |
| 57 | 106.8 | 106.731399389491 | 0.0686006105086267 |
| 58 | 107.8 | 106.825964857098 | 0.974035142902012 |
| 59 | 107.9 | 106.552376240152 | 1.34762375984835 |
| 60 | 107.4 | 106.604653738587 | 0.795346261413363 |
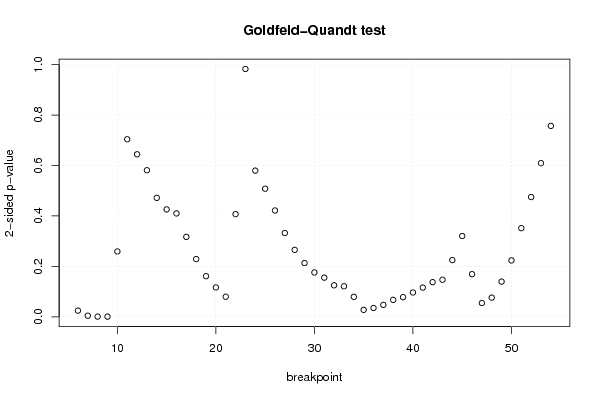
| Goldfeld-Quandt test for Heteroskedasticity | |||
| p-values | Alternative Hypothesis | ||
| breakpoint index | greater | 2-sided | less |
| 6 | 0.0121872065289217 | 0.0243744130578433 | 0.987812793471078 |
| 7 | 0.00209941317038817 | 0.00419882634077634 | 0.997900586829612 |
| 8 | 0.000321487143166575 | 0.00064297428633315 | 0.999678512856833 |
| 9 | 0.000206676336357391 | 0.000413352672714782 | 0.999793323663643 |
| 10 | 0.129524551554590 | 0.259049103109180 | 0.87047544844541 |
| 11 | 0.352075061546939 | 0.704150123093877 | 0.647924938453061 |
| 12 | 0.322211087263191 | 0.644422174526383 | 0.677788912736809 |
| 13 | 0.290625591054494 | 0.581251182108987 | 0.709374408945507 |
| 14 | 0.235860876312316 | 0.471721752624632 | 0.764139123687684 |
| 15 | 0.212980192081456 | 0.425960384162912 | 0.787019807918544 |
| 16 | 0.204978726600891 | 0.409957453201782 | 0.795021273399109 |
| 17 | 0.158462895036011 | 0.316925790072022 | 0.841537104963989 |
| 18 | 0.114420165521761 | 0.228840331043522 | 0.885579834478239 |
| 19 | 0.080471944490366 | 0.160943888980732 | 0.919528055509634 |
| 20 | 0.0581401347341221 | 0.116280269468244 | 0.941859865265878 |
| 21 | 0.0397625801345289 | 0.0795251602690578 | 0.960237419865471 |
| 22 | 0.203504937650574 | 0.407009875301148 | 0.796495062349426 |
| 23 | 0.508462465661986 | 0.983075068676028 | 0.491537534338014 |
| 24 | 0.710144032266906 | 0.579711935466187 | 0.289855967733094 |
| 25 | 0.745975586771375 | 0.50804882645725 | 0.254024413228625 |
| 26 | 0.789219878762541 | 0.421560242474918 | 0.210780121237459 |
| 27 | 0.833818274826544 | 0.332363450346911 | 0.166181725173456 |
| 28 | 0.867352239928096 | 0.265295520143807 | 0.132647760071904 |
| 29 | 0.893442612668104 | 0.213114774663792 | 0.106557387331896 |
| 30 | 0.912173277332901 | 0.175653445334197 | 0.0878267226670987 |
| 31 | 0.922416753513679 | 0.155166492972643 | 0.0775832464863214 |
| 32 | 0.93761790151317 | 0.124764196973659 | 0.0623820984868295 |
| 33 | 0.939532235650709 | 0.120935528698583 | 0.0604677643492913 |
| 34 | 0.960436910721551 | 0.0791261785568972 | 0.0395630892784486 |
| 35 | 0.986311838119373 | 0.027376323761255 | 0.0136881618806275 |
| 36 | 0.98253686377852 | 0.0349262724429603 | 0.0174631362214801 |
| 37 | 0.976472258381064 | 0.0470554832378715 | 0.0235277416189357 |
| 38 | 0.966483135124708 | 0.0670337297505838 | 0.0335168648752919 |
| 39 | 0.96119056426088 | 0.077618871478241 | 0.0388094357391205 |
| 40 | 0.951874668130214 | 0.0962506637395725 | 0.0481253318697863 |
| 41 | 0.942153228006062 | 0.115693543987877 | 0.0578467719939383 |
| 42 | 0.931339830574971 | 0.137320338850058 | 0.0686601694250288 |
| 43 | 0.92655397805007 | 0.146892043899859 | 0.0734460219499297 |
| 44 | 0.887610049123875 | 0.224779901752251 | 0.112389950876125 |
| 45 | 0.839868632470385 | 0.320262735059229 | 0.160131367529615 |
| 46 | 0.915520486009123 | 0.168959027981754 | 0.0844795139908772 |
| 47 | 0.972769804475054 | 0.0544603910498913 | 0.0272301955249456 |
| 48 | 0.962019032478246 | 0.075961935043507 | 0.0379809675217535 |
| 49 | 0.930268187188443 | 0.139463625623114 | 0.0697318128115571 |
| 50 | 0.88820095803954 | 0.223598083920919 | 0.111799041960459 |
| 51 | 0.824307325852518 | 0.351385348294964 | 0.175692674147482 |
| 52 | 0.762570049636362 | 0.474859900727275 | 0.237429950363638 |
| 53 | 0.695377964942828 | 0.609244070114344 | 0.304622035057172 |
| 54 | 0.62145688300952 | 0.75708623398096 | 0.37854311699048 |
| Meta Analysis of Goldfeld-Quandt test for Heteroskedasticity | |||
| Description | # significant tests | % significant tests | OK/NOK |
| 1% type I error level | 3 | 0.0612244897959184 | NOK |
| 5% type I error level | 7 | 0.142857142857143 | NOK |
| 10% type I error level | 14 | 0.285714285714286 | NOK |