| Multiple Linear Regression - Estimated Regression Equation |
| Y[t] = + 1538.6271090769 + 0.577774022625357X[t] + e[t] |
| Multiple Linear Regression - Ordinary Least Squares | |||||
| Variable | Parameter | S.D. | T-STAT H0: parameter = 0 | 2-tail p-value | 1-tail p-value |
| (Intercept) | 1538.6271090769 | 343.692243 | 4.4768 | 3.5e-05 | 1.8e-05 |
| X | 0.577774022625357 | 0.06964 | 8.2966 | 0 | 0 |
| Multiple Linear Regression - Regression Statistics | |
| Multiple R | 0.733797991705475 |
| R-squared | 0.538459492630988 |
| Adjusted R-squared | 0.530636772167106 |
| F-TEST (value) | 68.8327666976111 |
| F-TEST (DF numerator) | 1 |
| F-TEST (DF denominator) | 59 |
| p-value | 1.72734049286305e-11 |
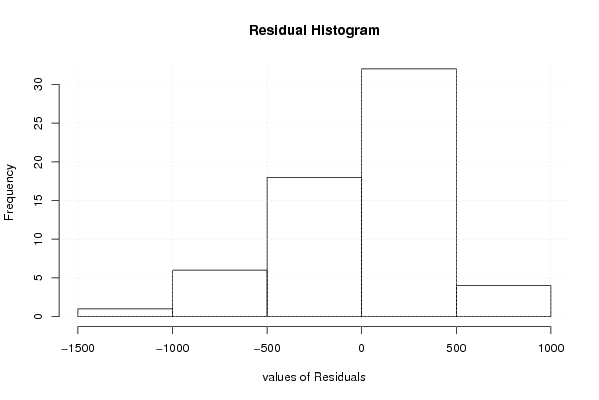
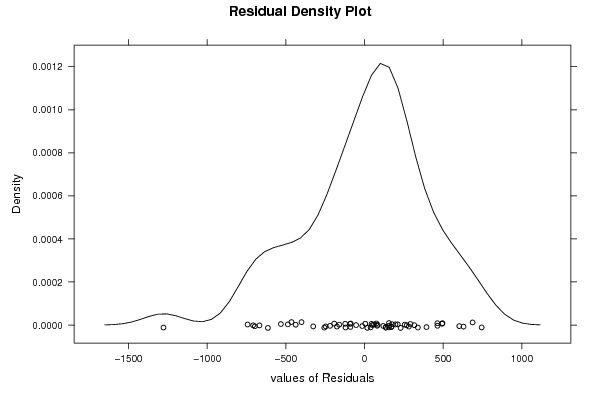
| Multiple Linear Regression - Residual Statistics | |
| Residual Standard Deviation | 396.36172774853 |
| Sum Squared Residuals | 9269054.5342042 |
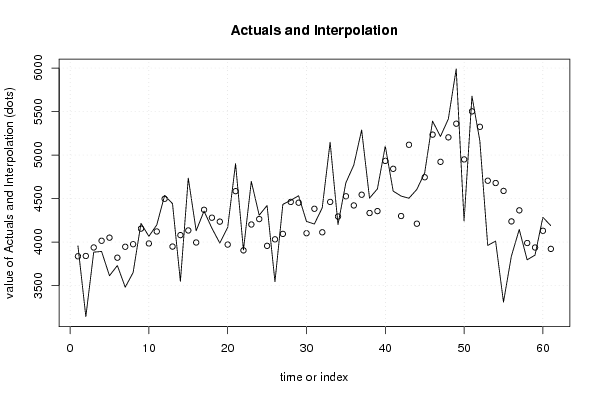
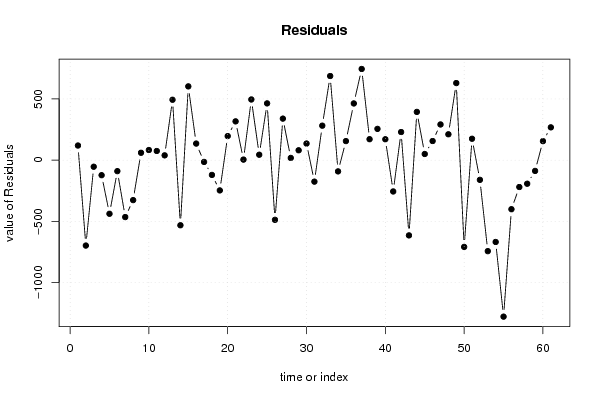
| Multiple Linear Regression - Actuals, Interpolation, and Residuals | |||
| Time or Index | Actuals | Interpolation Forecast | Residuals Prediction Error |
| 1 | 3956.2 | 3836.83883887379 | 119.361161126214 |
| 2 | 3142.7 | 3840.13215080275 | -697.432150802746 |
| 3 | 3884.3 | 3938.06484763775 | -53.7648476377447 |
| 4 | 3892.2 | 4015.02434745144 | -122.824347451443 |
| 5 | 3613 | 4050.84633685422 | -437.846336854215 |
| 6 | 3730.5 | 3820.43005663122 | -89.9300566312224 |
| 7 | 3481.3 | 3946.03812914997 | -464.738129149975 |
| 8 | 3649.5 | 3975.62015910839 | -326.120159108393 |
| 9 | 4215.2 | 4154.90343832904 | 60.2965616709584 |
| 10 | 4066.6 | 3983.88232763194 | 82.7176723680641 |
| 11 | 4196.8 | 4121.79698683261 | 75.0030131673918 |
| 12 | 4536.6 | 4497.52343374588 | 39.0765662541222 |
| 13 | 4441.6 | 3948.40700264274 | 493.192997357261 |
| 14 | 3548.3 | 4080.02392499680 | -531.723924996795 |
| 15 | 4735.9 | 4133.64135429643 | 602.258645703571 |
| 16 | 4130.6 | 3995.20669847539 | 135.393301524607 |
| 17 | 4356.2 | 4370.81759058414 | -14.6175905841375 |
| 18 | 4159.6 | 4280.28040123874 | -120.680401238744 |
| 19 | 3988 | 4235.04069526718 | -247.040695267178 |
| 20 | 4167.8 | 3971.2868539387 | 196.513146061297 |
| 21 | 4902.2 | 4585.57619479398 | 316.623805206017 |
| 22 | 3909.4 | 3904.78506393452 | 4.61493606547546 |
| 23 | 4697.6 | 4202.22313078206 | 495.376869217942 |
| 24 | 4308.9 | 4264.6227252256 | 44.2772747744026 |
| 25 | 4420.4 | 3956.90028077533 | 463.499719224668 |
| 26 | 3544.2 | 4031.54868449853 | -487.348684498528 |
| 27 | 4433 | 4093.89050153980 | 339.109498460196 |
| 28 | 4479.7 | 4461.70144434311 | 17.9985556568938 |
| 29 | 4533.2 | 4452.68816959015 | 80.511830409849 |
| 30 | 4237.5 | 4101.97933785656 | 135.520662143441 |
| 31 | 4207.4 | 4382.77751285248 | -175.377512852483 |
| 32 | 4394 | 4112.49482506834 | 281.505174931659 |
| 33 | 5148.4 | 4461.41255733179 | 686.987442668206 |
| 34 | 4202.2 | 4293.97364557496 | -91.773645574965 |
| 35 | 4682.5 | 4526.75879929072 | 155.741200709279 |
| 36 | 4884.3 | 4421.31504016159 | 462.984959838406 |
| 37 | 5288.9 | 4544.26535217627 | 744.63464782373 |
| 38 | 4505.2 | 4334.12894014743 | 171.071059852573 |
| 39 | 4611.5 | 4356.14213040945 | 255.357869590547 |
| 40 | 5104 | 4933.33837901219 | 170.661620987815 |
| 41 | 4586.6 | 4842.28119304643 | -255.681193046428 |
| 42 | 4529.3 | 4299.69360839896 | 229.606391601044 |
| 43 | 4504.1 | 5118.45717586135 | -614.357175861349 |
| 44 | 4604.9 | 4211.06307332823 | 393.836926671774 |
| 45 | 4795.4 | 4745.15737984311 | 50.2426201568932 |
| 46 | 5391.1 | 5234.99419622488 | 156.105803775116 |
| 47 | 5213.9 | 4922.47622738683 | 291.423772613171 |
| 48 | 5415 | 5203.90995380764 | 211.09004619236 |
| 49 | 5990.3 | 5360.89115575495 | 629.408844245051 |
| 50 | 4241.8 | 4950.15160307058 | -708.351603070583 |
| 51 | 5677.6 | 5502.73467830947 | 174.865321690526 |
| 52 | 5164.2 | 5325.06916635218 | -160.869166352177 |
| 53 | 3962.3 | 4705.40652708648 | -743.106527086482 |
| 54 | 4011 | 4679.0022542525 | -668.002254252503 |
| 55 | 3310.3 | 4588.11840049353 | -1277.81840049353 |
| 56 | 3837.3 | 4237.87178797804 | -400.571787978043 |
| 57 | 4145.3 | 4364.80874074883 | -219.508740748834 |
| 58 | 3796.7 | 3989.31340344461 | -192.613403444615 |
| 59 | 3849.6 | 3937.60262841965 | -88.0026284196451 |
| 60 | 4285 | 4129.59693613805 | 155.403063861949 |
| 61 | 4189.6 | 3921.77162019971 | 267.828379800290 |
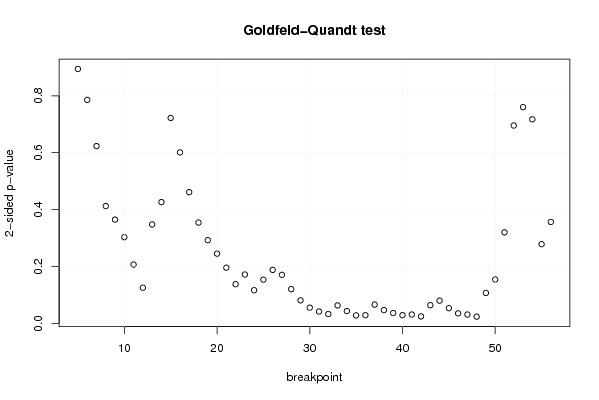
| Goldfeld-Quandt test for Heteroskedasticity | |||
| p-values | Alternative Hypothesis | ||
| breakpoint index | greater | 2-sided | less |
| 5 | 0.552890628089595 | 0.89421874382081 | 0.447109371910405 |
| 6 | 0.39283594283622 | 0.78567188567244 | 0.60716405716378 |
| 7 | 0.311567037505279 | 0.623134075010557 | 0.688432962494721 |
| 8 | 0.206194385074890 | 0.412388770149779 | 0.79380561492511 |
| 9 | 0.182443294327511 | 0.364886588655022 | 0.817556705672489 |
| 10 | 0.151537116052385 | 0.30307423210477 | 0.848462883947615 |
| 11 | 0.103474794496384 | 0.206949588992767 | 0.896525205503616 |
| 12 | 0.0627922199262303 | 0.125584439852461 | 0.93720778007377 |
| 13 | 0.173959280539783 | 0.347918561079566 | 0.826040719460217 |
| 14 | 0.213216810274546 | 0.426433620549093 | 0.786783189725454 |
| 15 | 0.361005120214768 | 0.722010240429537 | 0.638994879785232 |
| 16 | 0.300474242517537 | 0.600948485035073 | 0.699525757482463 |
| 17 | 0.230668199021836 | 0.461336398043672 | 0.769331800978164 |
| 18 | 0.177224962758482 | 0.354449925516964 | 0.822775037241518 |
| 19 | 0.146332579828194 | 0.292665159656387 | 0.853667420171806 |
| 20 | 0.122631900428141 | 0.245263800856283 | 0.877368099571859 |
| 21 | 0.0979944924255035 | 0.195988984851007 | 0.902005507574497 |
| 22 | 0.0689585558058437 | 0.137917111611687 | 0.931041444194156 |
| 23 | 0.0859888207970339 | 0.171977641594068 | 0.914011179202966 |
| 24 | 0.0584146636043414 | 0.116829327208683 | 0.941585336395659 |
| 25 | 0.076898142674929 | 0.153796285349858 | 0.923101857325071 |
| 26 | 0.094118518251762 | 0.188237036503524 | 0.905881481748238 |
| 27 | 0.0854335838177996 | 0.170867167635599 | 0.9145664161822 |
| 28 | 0.0602504251134638 | 0.120500850226928 | 0.939749574886536 |
| 29 | 0.0406486340976937 | 0.0812972681953875 | 0.959351365902306 |
| 30 | 0.027738988420387 | 0.055477976840774 | 0.972261011579613 |
| 31 | 0.0209477894547932 | 0.0418955789095863 | 0.979052210545207 |
| 32 | 0.0165271404510285 | 0.0330542809020569 | 0.983472859548971 |
| 33 | 0.0317113907917778 | 0.0634227815835556 | 0.968288609208222 |
| 34 | 0.0217612507099064 | 0.0435225014198127 | 0.978238749290094 |
| 35 | 0.0141492011087473 | 0.0282984022174945 | 0.985850798891253 |
| 36 | 0.0144696315666209 | 0.0289392631332418 | 0.985530368433379 |
| 37 | 0.0331028687676589 | 0.0662057375353179 | 0.96689713123234 |
| 38 | 0.0235047474354048 | 0.0470094948708097 | 0.976495252564595 |
| 39 | 0.0182977506265775 | 0.0365955012531551 | 0.981702249373422 |
| 40 | 0.0145348242091286 | 0.0290696484182573 | 0.985465175790871 |
| 41 | 0.0157113720786334 | 0.0314227441572668 | 0.984288627921367 |
| 42 | 0.0123506433727690 | 0.0247012867455379 | 0.987649356627231 |
| 43 | 0.0320975024519668 | 0.0641950049039337 | 0.967902497548033 |
| 44 | 0.0401103848543194 | 0.0802207697086388 | 0.95988961514568 |
| 45 | 0.0268427797370247 | 0.0536855594740495 | 0.973157220262975 |
| 46 | 0.0177637746008334 | 0.0355275492016669 | 0.982236225399167 |
| 47 | 0.0156266270764792 | 0.0312532541529585 | 0.98437337292352 |
| 48 | 0.0119562742216409 | 0.0239125484432818 | 0.98804372577836 |
| 49 | 0.0536193637154548 | 0.107238727430910 | 0.946380636284545 |
| 50 | 0.0772625450666616 | 0.154525090133323 | 0.922737454933338 |
| 51 | 0.160064842499907 | 0.320129684999815 | 0.839935157500093 |
| 52 | 0.65228542039746 | 0.695429159205079 | 0.347714579602540 |
| 53 | 0.619987263960278 | 0.760025472079444 | 0.380012736039722 |
| 54 | 0.641370473634938 | 0.717259052730123 | 0.358629526365062 |
| 55 | 0.860713333499748 | 0.278573333000504 | 0.139286666500252 |
| 56 | 0.821752201033874 | 0.356495597932251 | 0.178247798966126 |
| Meta Analysis of Goldfeld-Quandt test for Heteroskedasticity | |||
| Description | # significant tests | % significant tests | OK/NOK |
| 1% type I error level | 0 | 0 | OK |
| 5% type I error level | 13 | 0.25 | NOK |
| 10% type I error level | 20 | 0.384615384615385 | NOK |