Free Statistics

of Irreproducible Research!

Author's title

Author*The author of this computation has been verified*
R Software Modulerwasp_multipleregression.wasp
Title produced by softwareMultiple Regression
Date of computationFri, 20 Nov 2009 09:50:31 -0700
Cite this page as followsStatistical Computations at FreeStatistics.org, Office for Research Development and Education, URL https://freestatistics.org/blog/index.php?v=date/2009/Nov/20/t125873590909ko3bifvdxrtoj.htm/, Retrieved Fri, 19 Apr 2024 01:36:27 +0000
Statistical Computations at FreeStatistics.org, Office for Research Development and Education, URL https://freestatistics.org/blog/index.php?pk=58325, Retrieved Fri, 19 Apr 2024 01:36:27 +0000
QR Codes:

Original text written by user:
IsPrivate?No (this computation is public)
User-defined keywords
Estimated Impact129
Family? (F = Feedback message, R = changed R code, M = changed R Module, P = changed Parameters, D = changed Data)
-     [Multiple Regression] [Q1 The Seatbeltlaw] [2007-11-14 19:27:43] [8cd6641b921d30ebe00b648d1481bba0]
- RMPD  [Multiple Regression] [Seatbelt] [2009-11-12 13:54:52] [b98453cac15ba1066b407e146608df68]
-    D      [Multiple Regression] [ws7 Multiple Regr...] [2009-11-20 16:50:31] [95523ebdb89b97dbf680ec91e0b4bca2] [Current]
-   P         [Multiple Regression] [WS7 Multiple Regr...] [2009-11-20 17:05:56] [95cead3ebb75668735f848316249436a]
-   P         [Multiple Regression] [WS7 Multiple Regr...] [2009-11-20 17:09:06] [95cead3ebb75668735f848316249436a]
-   PD        [Multiple Regression] [WS7 Multiple Regr...] [2009-11-20 17:18:30] [95cead3ebb75668735f848316249436a]
-   PD        [Multiple Regression] [WS7 Multiple Regr...] [2009-11-20 17:52:33] [95cead3ebb75668735f848316249436a]
Feedback Forum

Post a new message
Dataseries X:
2.05	1.00
2.11	1.00
2.09	1.00
2.05	1.00
2.08	1.00
2.06	1.00
2.06	1.00
2.08	1.00
2.07	1.00
2.06	1.00
2.07	1.00
2.06	1.00
2.09	1.00
2.07	1.00
2.09	1.00
2.28	1.25
2.33	1.25
2.35	1.25
2.52	1.50
2.63	1.50
2.58	1.50
2.70	1.75
2.81	1.75
2.97	2.00
3.04	2.00
3.28	2.25
3.33	2.25
3.50	2.50
3.56	2.50
3.57	2.50
3.69	2.75
3.82	2.75
3.79	2.75
3.96	3.00
4.06	3.00
4.05	3.00
4.03	3.00
3.94	3.00
4.02	3.00
3.88	3.00
4.02	3.00
4.03	3.00
4.09	3.00
3.99	3.00
4.01	3.00
4.01	3.00
4.19	3.25
4.30	3.25
4.27	3.25
3.82	3.25
3.15	2.75
2.49	2.00
1.81	1.00
1.26	1.00
1.06	0.50
0.84	0.25
0.78	0.25
0.70	0.25
0.36	0.25
0.35	0.25


Summary of computational transaction
Raw Inputview raw input (R code)
Raw Outputview raw output of R engine
Computing time3 seconds
R Server'Gwilym Jenkins' @ 72.249.127.135

\begin{tabular}{lllllllll}
\hline
Summary of computational transaction \tabularnewline
Raw Input & view raw input (R code)  \tabularnewline
Raw Output & view raw output of R engine  \tabularnewline
Computing time & 3 seconds \tabularnewline
R Server & 'Gwilym Jenkins' @ 72.249.127.135 \tabularnewline
\hline
\end{tabular}
%Source: https://freestatistics.org/blog/index.php?pk=58325&T=0

[TABLE]
[ROW][C]Summary of computational transaction[/C][/ROW]
[ROW][C]Raw Input[/C][C]view raw input (R code) [/C][/ROW]
[ROW][C]Raw Output[/C][C]view raw output of R engine [/C][/ROW]
[ROW][C]Computing time[/C][C]3 seconds[/C][/ROW]
[ROW][C]R Server[/C][C]'Gwilym Jenkins' @ 72.249.127.135[/C][/ROW]
[/TABLE]
Source: https://freestatistics.org/blog/index.php?pk=58325&T=0

Globally Unique Identifier (entire table): ba.freestatistics.org/blog/index.php?pk=58325&T=0

As an alternative you can also use a QR Code:  

The GUIDs for individual cells are displayed in the table below:

Summary of computational transaction
Raw Inputview raw input (R code)
Raw Outputview raw output of R engine
Computing time3 seconds
R Server'Gwilym Jenkins' @ 72.249.127.135


Multiple Linear Regression - Estimated Regression Equation
Y[t] = + 0.786353370023588 + 1.07738832106354X[t] + e[t]

\begin{tabular}{lllllllll}
\hline
Multiple Linear Regression - Estimated Regression Equation \tabularnewline
Y[t] =  +  0.786353370023588 +  1.07738832106354X[t]  + e[t] \tabularnewline
\hline
\end{tabular}
%Source: https://freestatistics.org/blog/index.php?pk=58325&T=1

[TABLE]
[ROW][C]Multiple Linear Regression - Estimated Regression Equation[/C][/ROW]
[ROW][C]Y[t] =  +  0.786353370023588 +  1.07738832106354X[t]  + e[t][/C][/ROW]
[/TABLE]
Source: https://freestatistics.org/blog/index.php?pk=58325&T=1

Globally Unique Identifier (entire table): ba.freestatistics.org/blog/index.php?pk=58325&T=1

As an alternative you can also use a QR Code:  

The GUIDs for individual cells are displayed in the table below:

Multiple Linear Regression - Estimated Regression Equation
Y[t] = + 0.786353370023588 + 1.07738832106354X[t] + e[t]


Multiple Linear Regression - Ordinary Least Squares
VariableParameterS.D.T-STATH0: parameter = 02-tail p-value1-tail p-value
(Intercept)0.7863533700235880.0670611.726200
X1.077388321063540.03187933.796200

\begin{tabular}{lllllllll}
\hline
Multiple Linear Regression - Ordinary Least Squares \tabularnewline
Variable & Parameter & S.D. & T-STATH0: parameter = 0 & 2-tail p-value & 1-tail p-value \tabularnewline
(Intercept) & 0.786353370023588 & 0.06706 & 11.7262 & 0 & 0 \tabularnewline
X & 1.07738832106354 & 0.031879 & 33.7962 & 0 & 0 \tabularnewline
\hline
\end{tabular}
%Source: https://freestatistics.org/blog/index.php?pk=58325&T=2

[TABLE]
[ROW][C]Multiple Linear Regression - Ordinary Least Squares[/C][/ROW]
[ROW][C]Variable[/C][C]Parameter[/C][C]S.D.[/C][C]T-STATH0: parameter = 0[/C][C]2-tail p-value[/C][C]1-tail p-value[/C][/ROW]
[ROW][C](Intercept)[/C][C]0.786353370023588[/C][C]0.06706[/C][C]11.7262[/C][C]0[/C][C]0[/C][/ROW]
[ROW][C]X[/C][C]1.07738832106354[/C][C]0.031879[/C][C]33.7962[/C][C]0[/C][C]0[/C][/ROW]
[/TABLE]
Source: https://freestatistics.org/blog/index.php?pk=58325&T=2

Globally Unique Identifier (entire table): ba.freestatistics.org/blog/index.php?pk=58325&T=2

As an alternative you can also use a QR Code:  

The GUIDs for individual cells are displayed in the table below:

Multiple Linear Regression - Ordinary Least Squares
VariableParameterS.D.T-STATH0: parameter = 02-tail p-value1-tail p-value
(Intercept)0.7863533700235880.0670611.726200
X1.077388321063540.03187933.796200


Multiple Linear Regression - Regression Statistics
Multiple R0.975537820871888
R-squared0.951674039951472
Adjusted R-squared0.95084083374374
F-TEST (value)1142.18308879446
F-TEST (DF numerator)1
F-TEST (DF denominator)58
p-value0
Multiple Linear Regression - Residual Statistics
Residual Standard Deviation0.243401448295706
Sum Squared Residuals3.43616737188193

\begin{tabular}{lllllllll}
\hline
Multiple Linear Regression - Regression Statistics \tabularnewline
Multiple R & 0.975537820871888 \tabularnewline
R-squared & 0.951674039951472 \tabularnewline
Adjusted R-squared & 0.95084083374374 \tabularnewline
F-TEST (value) & 1142.18308879446 \tabularnewline
F-TEST (DF numerator) & 1 \tabularnewline
F-TEST (DF denominator) & 58 \tabularnewline
p-value & 0 \tabularnewline
Multiple Linear Regression - Residual Statistics \tabularnewline
Residual Standard Deviation & 0.243401448295706 \tabularnewline
Sum Squared Residuals & 3.43616737188193 \tabularnewline
\hline
\end{tabular}
%Source: https://freestatistics.org/blog/index.php?pk=58325&T=3

[TABLE]
[ROW][C]Multiple Linear Regression - Regression Statistics[/C][/ROW]
[ROW][C]Multiple R[/C][C]0.975537820871888[/C][/ROW]
[ROW][C]R-squared[/C][C]0.951674039951472[/C][/ROW]
[ROW][C]Adjusted R-squared[/C][C]0.95084083374374[/C][/ROW]
[ROW][C]F-TEST (value)[/C][C]1142.18308879446[/C][/ROW]
[ROW][C]F-TEST (DF numerator)[/C][C]1[/C][/ROW]
[ROW][C]F-TEST (DF denominator)[/C][C]58[/C][/ROW]
[ROW][C]p-value[/C][C]0[/C][/ROW]
[ROW][C]Multiple Linear Regression - Residual Statistics[/C][/ROW]
[ROW][C]Residual Standard Deviation[/C][C]0.243401448295706[/C][/ROW]
[ROW][C]Sum Squared Residuals[/C][C]3.43616737188193[/C][/ROW]
[/TABLE]
Source: https://freestatistics.org/blog/index.php?pk=58325&T=3

Globally Unique Identifier (entire table): ba.freestatistics.org/blog/index.php?pk=58325&T=3

As an alternative you can also use a QR Code:  

The GUIDs for individual cells are displayed in the table below:

Multiple Linear Regression - Regression Statistics
Multiple R0.975537820871888
R-squared0.951674039951472
Adjusted R-squared0.95084083374374
F-TEST (value)1142.18308879446
F-TEST (DF numerator)1
F-TEST (DF denominator)58
p-value0
Multiple Linear Regression - Residual Statistics
Residual Standard Deviation0.243401448295706
Sum Squared Residuals3.43616737188193


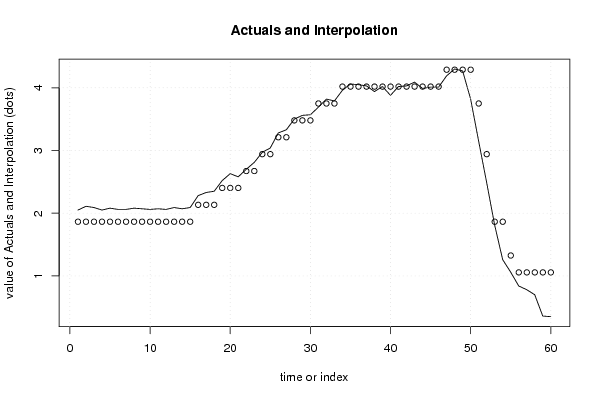
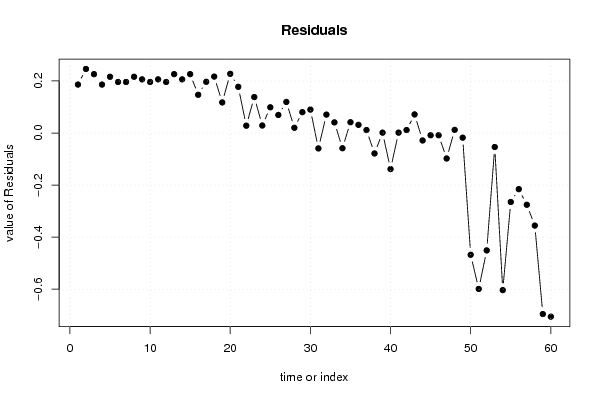
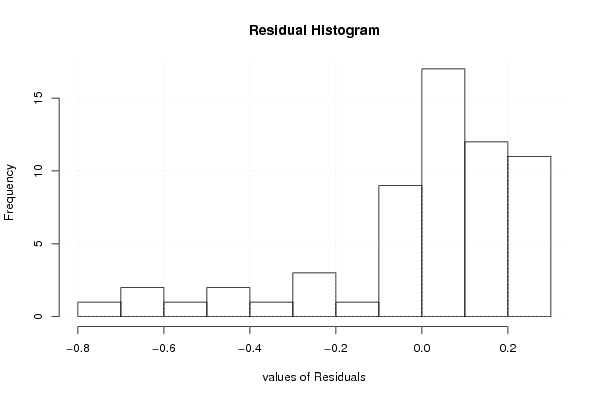
Multiple Linear Regression - Actuals, Interpolation, and Residuals
Time or IndexActualsInterpolationForecastResidualsPrediction Error
12.051.863741691087120.186258308912882
22.111.863741691087130.246258308912869
32.091.863741691087130.226258308912872
42.051.863741691087130.186258308912872
52.081.863741691087130.216258308912872
62.061.863741691087130.196258308912872
72.061.863741691087130.196258308912872
82.081.863741691087130.216258308912872
92.071.863741691087130.206258308912872
102.061.863741691087130.196258308912872
112.071.863741691087130.206258308912872
122.061.863741691087130.196258308912872
132.091.863741691087130.226258308912872
142.071.863741691087130.206258308912872
152.091.863741691087130.226258308912872
162.282.133088771353010.146911228646987
172.332.133088771353010.196911228646987
182.352.133088771353010.216911228646987
192.522.40243585161890.117564148381102
202.632.40243585161890.227564148381102
212.582.40243585161890.177564148381102
222.72.671782931884780.028217068115217
232.812.671782931884780.138217068115217
242.972.941130012150670.0288699878493318
253.042.941130012150670.0988699878493317
263.283.210477092416550.0695229075834463
273.333.210477092416550.119522907583447
283.53.479824172682440.0201758273175613
293.563.479824172682440.0801758273175614
303.573.479824172682440.0901758273175612
313.693.74917125294832-0.059171252948324
323.823.749171252948320.0708287470516759
333.793.749171252948320.0408287470516761
343.964.01851833321421-0.0585183332142091
354.064.018518333214210.0414816667857906
364.054.018518333214210.0314816667857908
374.034.018518333214210.0114816667857912
383.944.01851833321421-0.0785183332142091
394.024.018518333214210.00148166678579054
403.884.01851833321421-0.138518333214209
414.024.018518333214210.00148166678579054
424.034.018518333214210.0114816667857912
434.094.018518333214210.0714816667857908
443.994.01851833321421-0.0285183332142088
454.014.01851833321421-0.00851833321420925
464.014.01851833321421-0.00851833321420925
474.194.28786541348009-0.097865413480094
484.34.287865413480090.0121345865199055
494.274.28786541348009-0.0178654134800948
503.824.28786541348009-0.467865413480095
513.153.74917125294832-0.599171252948324
522.492.94113001215067-0.451130012150668
531.811.86374169108713-0.0537416910871276
541.261.86374169108713-0.603741691087128
551.061.32504753055536-0.265047530555357
560.841.05570045028947-0.215700450289472
570.781.05570045028947-0.275700450289472
580.71.05570045028947-0.355700450289472
590.361.05570045028947-0.695700450289472
600.351.05570045028947-0.705700450289472

\begin{tabular}{lllllllll}
\hline
Multiple Linear Regression - Actuals, Interpolation, and Residuals \tabularnewline
Time or Index & Actuals & InterpolationForecast & ResidualsPrediction Error \tabularnewline
1 & 2.05 & 1.86374169108712 & 0.186258308912882 \tabularnewline
2 & 2.11 & 1.86374169108713 & 0.246258308912869 \tabularnewline
3 & 2.09 & 1.86374169108713 & 0.226258308912872 \tabularnewline
4 & 2.05 & 1.86374169108713 & 0.186258308912872 \tabularnewline
5 & 2.08 & 1.86374169108713 & 0.216258308912872 \tabularnewline
6 & 2.06 & 1.86374169108713 & 0.196258308912872 \tabularnewline
7 & 2.06 & 1.86374169108713 & 0.196258308912872 \tabularnewline
8 & 2.08 & 1.86374169108713 & 0.216258308912872 \tabularnewline
9 & 2.07 & 1.86374169108713 & 0.206258308912872 \tabularnewline
10 & 2.06 & 1.86374169108713 & 0.196258308912872 \tabularnewline
11 & 2.07 & 1.86374169108713 & 0.206258308912872 \tabularnewline
12 & 2.06 & 1.86374169108713 & 0.196258308912872 \tabularnewline
13 & 2.09 & 1.86374169108713 & 0.226258308912872 \tabularnewline
14 & 2.07 & 1.86374169108713 & 0.206258308912872 \tabularnewline
15 & 2.09 & 1.86374169108713 & 0.226258308912872 \tabularnewline
16 & 2.28 & 2.13308877135301 & 0.146911228646987 \tabularnewline
17 & 2.33 & 2.13308877135301 & 0.196911228646987 \tabularnewline
18 & 2.35 & 2.13308877135301 & 0.216911228646987 \tabularnewline
19 & 2.52 & 2.4024358516189 & 0.117564148381102 \tabularnewline
20 & 2.63 & 2.4024358516189 & 0.227564148381102 \tabularnewline
21 & 2.58 & 2.4024358516189 & 0.177564148381102 \tabularnewline
22 & 2.7 & 2.67178293188478 & 0.028217068115217 \tabularnewline
23 & 2.81 & 2.67178293188478 & 0.138217068115217 \tabularnewline
24 & 2.97 & 2.94113001215067 & 0.0288699878493318 \tabularnewline
25 & 3.04 & 2.94113001215067 & 0.0988699878493317 \tabularnewline
26 & 3.28 & 3.21047709241655 & 0.0695229075834463 \tabularnewline
27 & 3.33 & 3.21047709241655 & 0.119522907583447 \tabularnewline
28 & 3.5 & 3.47982417268244 & 0.0201758273175613 \tabularnewline
29 & 3.56 & 3.47982417268244 & 0.0801758273175614 \tabularnewline
30 & 3.57 & 3.47982417268244 & 0.0901758273175612 \tabularnewline
31 & 3.69 & 3.74917125294832 & -0.059171252948324 \tabularnewline
32 & 3.82 & 3.74917125294832 & 0.0708287470516759 \tabularnewline
33 & 3.79 & 3.74917125294832 & 0.0408287470516761 \tabularnewline
34 & 3.96 & 4.01851833321421 & -0.0585183332142091 \tabularnewline
35 & 4.06 & 4.01851833321421 & 0.0414816667857906 \tabularnewline
36 & 4.05 & 4.01851833321421 & 0.0314816667857908 \tabularnewline
37 & 4.03 & 4.01851833321421 & 0.0114816667857912 \tabularnewline
38 & 3.94 & 4.01851833321421 & -0.0785183332142091 \tabularnewline
39 & 4.02 & 4.01851833321421 & 0.00148166678579054 \tabularnewline
40 & 3.88 & 4.01851833321421 & -0.138518333214209 \tabularnewline
41 & 4.02 & 4.01851833321421 & 0.00148166678579054 \tabularnewline
42 & 4.03 & 4.01851833321421 & 0.0114816667857912 \tabularnewline
43 & 4.09 & 4.01851833321421 & 0.0714816667857908 \tabularnewline
44 & 3.99 & 4.01851833321421 & -0.0285183332142088 \tabularnewline
45 & 4.01 & 4.01851833321421 & -0.00851833321420925 \tabularnewline
46 & 4.01 & 4.01851833321421 & -0.00851833321420925 \tabularnewline
47 & 4.19 & 4.28786541348009 & -0.097865413480094 \tabularnewline
48 & 4.3 & 4.28786541348009 & 0.0121345865199055 \tabularnewline
49 & 4.27 & 4.28786541348009 & -0.0178654134800948 \tabularnewline
50 & 3.82 & 4.28786541348009 & -0.467865413480095 \tabularnewline
51 & 3.15 & 3.74917125294832 & -0.599171252948324 \tabularnewline
52 & 2.49 & 2.94113001215067 & -0.451130012150668 \tabularnewline
53 & 1.81 & 1.86374169108713 & -0.0537416910871276 \tabularnewline
54 & 1.26 & 1.86374169108713 & -0.603741691087128 \tabularnewline
55 & 1.06 & 1.32504753055536 & -0.265047530555357 \tabularnewline
56 & 0.84 & 1.05570045028947 & -0.215700450289472 \tabularnewline
57 & 0.78 & 1.05570045028947 & -0.275700450289472 \tabularnewline
58 & 0.7 & 1.05570045028947 & -0.355700450289472 \tabularnewline
59 & 0.36 & 1.05570045028947 & -0.695700450289472 \tabularnewline
60 & 0.35 & 1.05570045028947 & -0.705700450289472 \tabularnewline
\hline
\end{tabular}
%Source: https://freestatistics.org/blog/index.php?pk=58325&T=4

[TABLE]
[ROW][C]Multiple Linear Regression - Actuals, Interpolation, and Residuals[/C][/ROW]
[ROW][C]Time or Index[/C][C]Actuals[/C][C]InterpolationForecast[/C][C]ResidualsPrediction Error[/C][/ROW]
[ROW][C]1[/C][C]2.05[/C][C]1.86374169108712[/C][C]0.186258308912882[/C][/ROW]
[ROW][C]2[/C][C]2.11[/C][C]1.86374169108713[/C][C]0.246258308912869[/C][/ROW]
[ROW][C]3[/C][C]2.09[/C][C]1.86374169108713[/C][C]0.226258308912872[/C][/ROW]
[ROW][C]4[/C][C]2.05[/C][C]1.86374169108713[/C][C]0.186258308912872[/C][/ROW]
[ROW][C]5[/C][C]2.08[/C][C]1.86374169108713[/C][C]0.216258308912872[/C][/ROW]
[ROW][C]6[/C][C]2.06[/C][C]1.86374169108713[/C][C]0.196258308912872[/C][/ROW]
[ROW][C]7[/C][C]2.06[/C][C]1.86374169108713[/C][C]0.196258308912872[/C][/ROW]
[ROW][C]8[/C][C]2.08[/C][C]1.86374169108713[/C][C]0.216258308912872[/C][/ROW]
[ROW][C]9[/C][C]2.07[/C][C]1.86374169108713[/C][C]0.206258308912872[/C][/ROW]
[ROW][C]10[/C][C]2.06[/C][C]1.86374169108713[/C][C]0.196258308912872[/C][/ROW]
[ROW][C]11[/C][C]2.07[/C][C]1.86374169108713[/C][C]0.206258308912872[/C][/ROW]
[ROW][C]12[/C][C]2.06[/C][C]1.86374169108713[/C][C]0.196258308912872[/C][/ROW]
[ROW][C]13[/C][C]2.09[/C][C]1.86374169108713[/C][C]0.226258308912872[/C][/ROW]
[ROW][C]14[/C][C]2.07[/C][C]1.86374169108713[/C][C]0.206258308912872[/C][/ROW]
[ROW][C]15[/C][C]2.09[/C][C]1.86374169108713[/C][C]0.226258308912872[/C][/ROW]
[ROW][C]16[/C][C]2.28[/C][C]2.13308877135301[/C][C]0.146911228646987[/C][/ROW]
[ROW][C]17[/C][C]2.33[/C][C]2.13308877135301[/C][C]0.196911228646987[/C][/ROW]
[ROW][C]18[/C][C]2.35[/C][C]2.13308877135301[/C][C]0.216911228646987[/C][/ROW]
[ROW][C]19[/C][C]2.52[/C][C]2.4024358516189[/C][C]0.117564148381102[/C][/ROW]
[ROW][C]20[/C][C]2.63[/C][C]2.4024358516189[/C][C]0.227564148381102[/C][/ROW]
[ROW][C]21[/C][C]2.58[/C][C]2.4024358516189[/C][C]0.177564148381102[/C][/ROW]
[ROW][C]22[/C][C]2.7[/C][C]2.67178293188478[/C][C]0.028217068115217[/C][/ROW]
[ROW][C]23[/C][C]2.81[/C][C]2.67178293188478[/C][C]0.138217068115217[/C][/ROW]
[ROW][C]24[/C][C]2.97[/C][C]2.94113001215067[/C][C]0.0288699878493318[/C][/ROW]
[ROW][C]25[/C][C]3.04[/C][C]2.94113001215067[/C][C]0.0988699878493317[/C][/ROW]
[ROW][C]26[/C][C]3.28[/C][C]3.21047709241655[/C][C]0.0695229075834463[/C][/ROW]
[ROW][C]27[/C][C]3.33[/C][C]3.21047709241655[/C][C]0.119522907583447[/C][/ROW]
[ROW][C]28[/C][C]3.5[/C][C]3.47982417268244[/C][C]0.0201758273175613[/C][/ROW]
[ROW][C]29[/C][C]3.56[/C][C]3.47982417268244[/C][C]0.0801758273175614[/C][/ROW]
[ROW][C]30[/C][C]3.57[/C][C]3.47982417268244[/C][C]0.0901758273175612[/C][/ROW]
[ROW][C]31[/C][C]3.69[/C][C]3.74917125294832[/C][C]-0.059171252948324[/C][/ROW]
[ROW][C]32[/C][C]3.82[/C][C]3.74917125294832[/C][C]0.0708287470516759[/C][/ROW]
[ROW][C]33[/C][C]3.79[/C][C]3.74917125294832[/C][C]0.0408287470516761[/C][/ROW]
[ROW][C]34[/C][C]3.96[/C][C]4.01851833321421[/C][C]-0.0585183332142091[/C][/ROW]
[ROW][C]35[/C][C]4.06[/C][C]4.01851833321421[/C][C]0.0414816667857906[/C][/ROW]
[ROW][C]36[/C][C]4.05[/C][C]4.01851833321421[/C][C]0.0314816667857908[/C][/ROW]
[ROW][C]37[/C][C]4.03[/C][C]4.01851833321421[/C][C]0.0114816667857912[/C][/ROW]
[ROW][C]38[/C][C]3.94[/C][C]4.01851833321421[/C][C]-0.0785183332142091[/C][/ROW]
[ROW][C]39[/C][C]4.02[/C][C]4.01851833321421[/C][C]0.00148166678579054[/C][/ROW]
[ROW][C]40[/C][C]3.88[/C][C]4.01851833321421[/C][C]-0.138518333214209[/C][/ROW]
[ROW][C]41[/C][C]4.02[/C][C]4.01851833321421[/C][C]0.00148166678579054[/C][/ROW]
[ROW][C]42[/C][C]4.03[/C][C]4.01851833321421[/C][C]0.0114816667857912[/C][/ROW]
[ROW][C]43[/C][C]4.09[/C][C]4.01851833321421[/C][C]0.0714816667857908[/C][/ROW]
[ROW][C]44[/C][C]3.99[/C][C]4.01851833321421[/C][C]-0.0285183332142088[/C][/ROW]
[ROW][C]45[/C][C]4.01[/C][C]4.01851833321421[/C][C]-0.00851833321420925[/C][/ROW]
[ROW][C]46[/C][C]4.01[/C][C]4.01851833321421[/C][C]-0.00851833321420925[/C][/ROW]
[ROW][C]47[/C][C]4.19[/C][C]4.28786541348009[/C][C]-0.097865413480094[/C][/ROW]
[ROW][C]48[/C][C]4.3[/C][C]4.28786541348009[/C][C]0.0121345865199055[/C][/ROW]
[ROW][C]49[/C][C]4.27[/C][C]4.28786541348009[/C][C]-0.0178654134800948[/C][/ROW]
[ROW][C]50[/C][C]3.82[/C][C]4.28786541348009[/C][C]-0.467865413480095[/C][/ROW]
[ROW][C]51[/C][C]3.15[/C][C]3.74917125294832[/C][C]-0.599171252948324[/C][/ROW]
[ROW][C]52[/C][C]2.49[/C][C]2.94113001215067[/C][C]-0.451130012150668[/C][/ROW]
[ROW][C]53[/C][C]1.81[/C][C]1.86374169108713[/C][C]-0.0537416910871276[/C][/ROW]
[ROW][C]54[/C][C]1.26[/C][C]1.86374169108713[/C][C]-0.603741691087128[/C][/ROW]
[ROW][C]55[/C][C]1.06[/C][C]1.32504753055536[/C][C]-0.265047530555357[/C][/ROW]
[ROW][C]56[/C][C]0.84[/C][C]1.05570045028947[/C][C]-0.215700450289472[/C][/ROW]
[ROW][C]57[/C][C]0.78[/C][C]1.05570045028947[/C][C]-0.275700450289472[/C][/ROW]
[ROW][C]58[/C][C]0.7[/C][C]1.05570045028947[/C][C]-0.355700450289472[/C][/ROW]
[ROW][C]59[/C][C]0.36[/C][C]1.05570045028947[/C][C]-0.695700450289472[/C][/ROW]
[ROW][C]60[/C][C]0.35[/C][C]1.05570045028947[/C][C]-0.705700450289472[/C][/ROW]
[/TABLE]
Source: https://freestatistics.org/blog/index.php?pk=58325&T=4

Globally Unique Identifier (entire table): ba.freestatistics.org/blog/index.php?pk=58325&T=4

As an alternative you can also use a QR Code:  

The GUIDs for individual cells are displayed in the table below:

Multiple Linear Regression - Actuals, Interpolation, and Residuals
Time or IndexActualsInterpolationForecastResidualsPrediction Error
12.051.863741691087120.186258308912882
22.111.863741691087130.246258308912869
32.091.863741691087130.226258308912872
42.051.863741691087130.186258308912872
52.081.863741691087130.216258308912872
62.061.863741691087130.196258308912872
72.061.863741691087130.196258308912872
82.081.863741691087130.216258308912872
92.071.863741691087130.206258308912872
102.061.863741691087130.196258308912872
112.071.863741691087130.206258308912872
122.061.863741691087130.196258308912872
132.091.863741691087130.226258308912872
142.071.863741691087130.206258308912872
152.091.863741691087130.226258308912872
162.282.133088771353010.146911228646987
172.332.133088771353010.196911228646987
182.352.133088771353010.216911228646987
192.522.40243585161890.117564148381102
202.632.40243585161890.227564148381102
212.582.40243585161890.177564148381102
222.72.671782931884780.028217068115217
232.812.671782931884780.138217068115217
242.972.941130012150670.0288699878493318
253.042.941130012150670.0988699878493317
263.283.210477092416550.0695229075834463
273.333.210477092416550.119522907583447
283.53.479824172682440.0201758273175613
293.563.479824172682440.0801758273175614
303.573.479824172682440.0901758273175612
313.693.74917125294832-0.059171252948324
323.823.749171252948320.0708287470516759
333.793.749171252948320.0408287470516761
343.964.01851833321421-0.0585183332142091
354.064.018518333214210.0414816667857906
364.054.018518333214210.0314816667857908
374.034.018518333214210.0114816667857912
383.944.01851833321421-0.0785183332142091
394.024.018518333214210.00148166678579054
403.884.01851833321421-0.138518333214209
414.024.018518333214210.00148166678579054
424.034.018518333214210.0114816667857912
434.094.018518333214210.0714816667857908
443.994.01851833321421-0.0285183332142088
454.014.01851833321421-0.00851833321420925
464.014.01851833321421-0.00851833321420925
474.194.28786541348009-0.097865413480094
484.34.287865413480090.0121345865199055
494.274.28786541348009-0.0178654134800948
503.824.28786541348009-0.467865413480095
513.153.74917125294832-0.599171252948324
522.492.94113001215067-0.451130012150668
531.811.86374169108713-0.0537416910871276
541.261.86374169108713-0.603741691087128
551.061.32504753055536-0.265047530555357
560.841.05570045028947-0.215700450289472
570.781.05570045028947-0.275700450289472
580.71.05570045028947-0.355700450289472
590.361.05570045028947-0.695700450289472
600.351.05570045028947-0.705700450289472


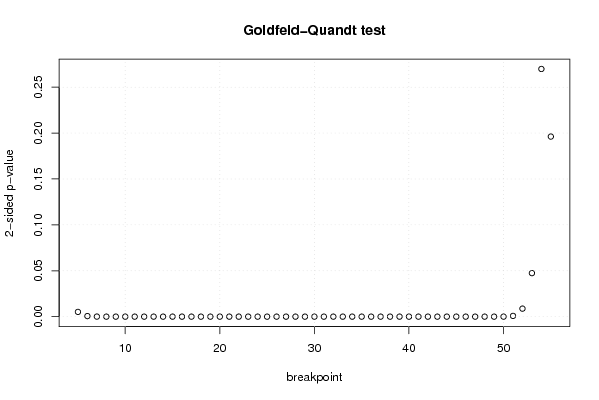
Goldfeld-Quandt test for Heteroskedasticity
p-valuesAlternative Hypothesis
breakpoint indexgreater2-sidedless
50.002578797098791770.005157594197583550.997421202901208
60.0003061430004125850.000612286000825170.999693856999587
73.37775326166875e-056.7555065233375e-050.999966222467383
83.38700148833636e-066.77400297667271e-060.999996612998512
93.07753646685977e-076.15507293371955e-070.999999692246353
103.1442146778976e-086.2884293557952e-080.999999968557853
112.73940405681772e-095.47880811363544e-090.999999997260596
122.74784026159835e-105.4956805231967e-100.999999999725216
134.38231086453373e-118.76462172906745e-110.999999999956177
144.2037846880127e-128.4075693760254e-120.999999999995796
157.46854972902404e-131.49370994580481e-120.999999999999253
167.06883184458372e-141.41376636891674e-130.99999999999993
175.69199413668236e-141.13839882733647e-130.999999999999943
185.05693192107701e-141.01138638421540e-130.99999999999995
191.93618565966237e-143.87237131932475e-140.99999999999998
204.05899264790126e-138.11798529580252e-130.999999999999594
211.14851253983602e-132.29702507967203e-130.999999999999885
224.35623463342582e-128.71246926685163e-120.999999999995644
232.04365242513389e-124.08730485026778e-120.999999999997956
249.64920070496751e-131.92984014099350e-120.999999999999035
254.24737141935536e-138.49474283871073e-130.999999999999575
261.42398009899030e-132.84796019798060e-130.999999999999858
272.53418222693250e-135.06836445386499e-130.999999999999747
285.76768283943989e-141.15353656788798e-130.999999999999942
293.46123327527579e-146.92246655055159e-140.999999999999965
302.42041927093232e-144.84083854186463e-140.999999999999976
313.0511868177214e-146.1023736354428e-140.99999999999997
322.67744670931039e-145.35489341862079e-140.999999999999973
338.2430938513789e-151.64861877027578e-140.999999999999992
343.19690703424305e-156.3938140684861e-150.999999999999997
351.79871736950881e-153.59743473901762e-150.999999999999998
366.42231013288584e-161.28446202657717e-151
371.52224283669293e-163.04448567338587e-161
381.43868913142298e-162.87737826284596e-161
393.31699621762463e-176.63399243524926e-171
403.97204215430517e-167.94408430861033e-161
411.07524708704602e-162.15049417409204e-161
423.56736167822965e-177.1347233564593e-171
439.83009729734105e-171.96601945946821e-161
443.10746875391818e-176.21493750783637e-171
451.26021136772998e-172.52042273545995e-171
467.186052624078e-181.4372105248156e-171
474.61249347728168e-189.22498695456336e-181
482.60713505625503e-175.21427011251007e-171
491.87997043908413e-153.75994087816826e-150.999999999999998
504.90184432450248e-089.80368864900497e-080.999999950981557
510.0003996792385367830.0007993584770735660.999600320761463
520.004364209595254870.008728419190509740.995635790404745
530.02372139105775160.04744278211550320.976278608942248
540.1349380944440080.2698761888880150.865061905555992
550.09810654787570.19621309575140.9018934521243

\begin{tabular}{lllllllll}
\hline
Goldfeld-Quandt test for Heteroskedasticity \tabularnewline
p-values & Alternative Hypothesis \tabularnewline
breakpoint index & greater & 2-sided & less \tabularnewline
5 & 0.00257879709879177 & 0.00515759419758355 & 0.997421202901208 \tabularnewline
6 & 0.000306143000412585 & 0.00061228600082517 & 0.999693856999587 \tabularnewline
7 & 3.37775326166875e-05 & 6.7555065233375e-05 & 0.999966222467383 \tabularnewline
8 & 3.38700148833636e-06 & 6.77400297667271e-06 & 0.999996612998512 \tabularnewline
9 & 3.07753646685977e-07 & 6.15507293371955e-07 & 0.999999692246353 \tabularnewline
10 & 3.1442146778976e-08 & 6.2884293557952e-08 & 0.999999968557853 \tabularnewline
11 & 2.73940405681772e-09 & 5.47880811363544e-09 & 0.999999997260596 \tabularnewline
12 & 2.74784026159835e-10 & 5.4956805231967e-10 & 0.999999999725216 \tabularnewline
13 & 4.38231086453373e-11 & 8.76462172906745e-11 & 0.999999999956177 \tabularnewline
14 & 4.2037846880127e-12 & 8.4075693760254e-12 & 0.999999999995796 \tabularnewline
15 & 7.46854972902404e-13 & 1.49370994580481e-12 & 0.999999999999253 \tabularnewline
16 & 7.06883184458372e-14 & 1.41376636891674e-13 & 0.99999999999993 \tabularnewline
17 & 5.69199413668236e-14 & 1.13839882733647e-13 & 0.999999999999943 \tabularnewline
18 & 5.05693192107701e-14 & 1.01138638421540e-13 & 0.99999999999995 \tabularnewline
19 & 1.93618565966237e-14 & 3.87237131932475e-14 & 0.99999999999998 \tabularnewline
20 & 4.05899264790126e-13 & 8.11798529580252e-13 & 0.999999999999594 \tabularnewline
21 & 1.14851253983602e-13 & 2.29702507967203e-13 & 0.999999999999885 \tabularnewline
22 & 4.35623463342582e-12 & 8.71246926685163e-12 & 0.999999999995644 \tabularnewline
23 & 2.04365242513389e-12 & 4.08730485026778e-12 & 0.999999999997956 \tabularnewline
24 & 9.64920070496751e-13 & 1.92984014099350e-12 & 0.999999999999035 \tabularnewline
25 & 4.24737141935536e-13 & 8.49474283871073e-13 & 0.999999999999575 \tabularnewline
26 & 1.42398009899030e-13 & 2.84796019798060e-13 & 0.999999999999858 \tabularnewline
27 & 2.53418222693250e-13 & 5.06836445386499e-13 & 0.999999999999747 \tabularnewline
28 & 5.76768283943989e-14 & 1.15353656788798e-13 & 0.999999999999942 \tabularnewline
29 & 3.46123327527579e-14 & 6.92246655055159e-14 & 0.999999999999965 \tabularnewline
30 & 2.42041927093232e-14 & 4.84083854186463e-14 & 0.999999999999976 \tabularnewline
31 & 3.0511868177214e-14 & 6.1023736354428e-14 & 0.99999999999997 \tabularnewline
32 & 2.67744670931039e-14 & 5.35489341862079e-14 & 0.999999999999973 \tabularnewline
33 & 8.2430938513789e-15 & 1.64861877027578e-14 & 0.999999999999992 \tabularnewline
34 & 3.19690703424305e-15 & 6.3938140684861e-15 & 0.999999999999997 \tabularnewline
35 & 1.79871736950881e-15 & 3.59743473901762e-15 & 0.999999999999998 \tabularnewline
36 & 6.42231013288584e-16 & 1.28446202657717e-15 & 1 \tabularnewline
37 & 1.52224283669293e-16 & 3.04448567338587e-16 & 1 \tabularnewline
38 & 1.43868913142298e-16 & 2.87737826284596e-16 & 1 \tabularnewline
39 & 3.31699621762463e-17 & 6.63399243524926e-17 & 1 \tabularnewline
40 & 3.97204215430517e-16 & 7.94408430861033e-16 & 1 \tabularnewline
41 & 1.07524708704602e-16 & 2.15049417409204e-16 & 1 \tabularnewline
42 & 3.56736167822965e-17 & 7.1347233564593e-17 & 1 \tabularnewline
43 & 9.83009729734105e-17 & 1.96601945946821e-16 & 1 \tabularnewline
44 & 3.10746875391818e-17 & 6.21493750783637e-17 & 1 \tabularnewline
45 & 1.26021136772998e-17 & 2.52042273545995e-17 & 1 \tabularnewline
46 & 7.186052624078e-18 & 1.4372105248156e-17 & 1 \tabularnewline
47 & 4.61249347728168e-18 & 9.22498695456336e-18 & 1 \tabularnewline
48 & 2.60713505625503e-17 & 5.21427011251007e-17 & 1 \tabularnewline
49 & 1.87997043908413e-15 & 3.75994087816826e-15 & 0.999999999999998 \tabularnewline
50 & 4.90184432450248e-08 & 9.80368864900497e-08 & 0.999999950981557 \tabularnewline
51 & 0.000399679238536783 & 0.000799358477073566 & 0.999600320761463 \tabularnewline
52 & 0.00436420959525487 & 0.00872841919050974 & 0.995635790404745 \tabularnewline
53 & 0.0237213910577516 & 0.0474427821155032 & 0.976278608942248 \tabularnewline
54 & 0.134938094444008 & 0.269876188888015 & 0.865061905555992 \tabularnewline
55 & 0.0981065478757 & 0.1962130957514 & 0.9018934521243 \tabularnewline
\hline
\end{tabular}
%Source: https://freestatistics.org/blog/index.php?pk=58325&T=5

[TABLE]
[ROW][C]Goldfeld-Quandt test for Heteroskedasticity[/C][/ROW]
[ROW][C]p-values[/C][C]Alternative Hypothesis[/C][/ROW]
[ROW][C]breakpoint index[/C][C]greater[/C][C]2-sided[/C][C]less[/C][/ROW]
[ROW][C]5[/C][C]0.00257879709879177[/C][C]0.00515759419758355[/C][C]0.997421202901208[/C][/ROW]
[ROW][C]6[/C][C]0.000306143000412585[/C][C]0.00061228600082517[/C][C]0.999693856999587[/C][/ROW]
[ROW][C]7[/C][C]3.37775326166875e-05[/C][C]6.7555065233375e-05[/C][C]0.999966222467383[/C][/ROW]
[ROW][C]8[/C][C]3.38700148833636e-06[/C][C]6.77400297667271e-06[/C][C]0.999996612998512[/C][/ROW]
[ROW][C]9[/C][C]3.07753646685977e-07[/C][C]6.15507293371955e-07[/C][C]0.999999692246353[/C][/ROW]
[ROW][C]10[/C][C]3.1442146778976e-08[/C][C]6.2884293557952e-08[/C][C]0.999999968557853[/C][/ROW]
[ROW][C]11[/C][C]2.73940405681772e-09[/C][C]5.47880811363544e-09[/C][C]0.999999997260596[/C][/ROW]
[ROW][C]12[/C][C]2.74784026159835e-10[/C][C]5.4956805231967e-10[/C][C]0.999999999725216[/C][/ROW]
[ROW][C]13[/C][C]4.38231086453373e-11[/C][C]8.76462172906745e-11[/C][C]0.999999999956177[/C][/ROW]
[ROW][C]14[/C][C]4.2037846880127e-12[/C][C]8.4075693760254e-12[/C][C]0.999999999995796[/C][/ROW]
[ROW][C]15[/C][C]7.46854972902404e-13[/C][C]1.49370994580481e-12[/C][C]0.999999999999253[/C][/ROW]
[ROW][C]16[/C][C]7.06883184458372e-14[/C][C]1.41376636891674e-13[/C][C]0.99999999999993[/C][/ROW]
[ROW][C]17[/C][C]5.69199413668236e-14[/C][C]1.13839882733647e-13[/C][C]0.999999999999943[/C][/ROW]
[ROW][C]18[/C][C]5.05693192107701e-14[/C][C]1.01138638421540e-13[/C][C]0.99999999999995[/C][/ROW]
[ROW][C]19[/C][C]1.93618565966237e-14[/C][C]3.87237131932475e-14[/C][C]0.99999999999998[/C][/ROW]
[ROW][C]20[/C][C]4.05899264790126e-13[/C][C]8.11798529580252e-13[/C][C]0.999999999999594[/C][/ROW]
[ROW][C]21[/C][C]1.14851253983602e-13[/C][C]2.29702507967203e-13[/C][C]0.999999999999885[/C][/ROW]
[ROW][C]22[/C][C]4.35623463342582e-12[/C][C]8.71246926685163e-12[/C][C]0.999999999995644[/C][/ROW]
[ROW][C]23[/C][C]2.04365242513389e-12[/C][C]4.08730485026778e-12[/C][C]0.999999999997956[/C][/ROW]
[ROW][C]24[/C][C]9.64920070496751e-13[/C][C]1.92984014099350e-12[/C][C]0.999999999999035[/C][/ROW]
[ROW][C]25[/C][C]4.24737141935536e-13[/C][C]8.49474283871073e-13[/C][C]0.999999999999575[/C][/ROW]
[ROW][C]26[/C][C]1.42398009899030e-13[/C][C]2.84796019798060e-13[/C][C]0.999999999999858[/C][/ROW]
[ROW][C]27[/C][C]2.53418222693250e-13[/C][C]5.06836445386499e-13[/C][C]0.999999999999747[/C][/ROW]
[ROW][C]28[/C][C]5.76768283943989e-14[/C][C]1.15353656788798e-13[/C][C]0.999999999999942[/C][/ROW]
[ROW][C]29[/C][C]3.46123327527579e-14[/C][C]6.92246655055159e-14[/C][C]0.999999999999965[/C][/ROW]
[ROW][C]30[/C][C]2.42041927093232e-14[/C][C]4.84083854186463e-14[/C][C]0.999999999999976[/C][/ROW]
[ROW][C]31[/C][C]3.0511868177214e-14[/C][C]6.1023736354428e-14[/C][C]0.99999999999997[/C][/ROW]
[ROW][C]32[/C][C]2.67744670931039e-14[/C][C]5.35489341862079e-14[/C][C]0.999999999999973[/C][/ROW]
[ROW][C]33[/C][C]8.2430938513789e-15[/C][C]1.64861877027578e-14[/C][C]0.999999999999992[/C][/ROW]
[ROW][C]34[/C][C]3.19690703424305e-15[/C][C]6.3938140684861e-15[/C][C]0.999999999999997[/C][/ROW]
[ROW][C]35[/C][C]1.79871736950881e-15[/C][C]3.59743473901762e-15[/C][C]0.999999999999998[/C][/ROW]
[ROW][C]36[/C][C]6.42231013288584e-16[/C][C]1.28446202657717e-15[/C][C]1[/C][/ROW]
[ROW][C]37[/C][C]1.52224283669293e-16[/C][C]3.04448567338587e-16[/C][C]1[/C][/ROW]
[ROW][C]38[/C][C]1.43868913142298e-16[/C][C]2.87737826284596e-16[/C][C]1[/C][/ROW]
[ROW][C]39[/C][C]3.31699621762463e-17[/C][C]6.63399243524926e-17[/C][C]1[/C][/ROW]
[ROW][C]40[/C][C]3.97204215430517e-16[/C][C]7.94408430861033e-16[/C][C]1[/C][/ROW]
[ROW][C]41[/C][C]1.07524708704602e-16[/C][C]2.15049417409204e-16[/C][C]1[/C][/ROW]
[ROW][C]42[/C][C]3.56736167822965e-17[/C][C]7.1347233564593e-17[/C][C]1[/C][/ROW]
[ROW][C]43[/C][C]9.83009729734105e-17[/C][C]1.96601945946821e-16[/C][C]1[/C][/ROW]
[ROW][C]44[/C][C]3.10746875391818e-17[/C][C]6.21493750783637e-17[/C][C]1[/C][/ROW]
[ROW][C]45[/C][C]1.26021136772998e-17[/C][C]2.52042273545995e-17[/C][C]1[/C][/ROW]
[ROW][C]46[/C][C]7.186052624078e-18[/C][C]1.4372105248156e-17[/C][C]1[/C][/ROW]
[ROW][C]47[/C][C]4.61249347728168e-18[/C][C]9.22498695456336e-18[/C][C]1[/C][/ROW]
[ROW][C]48[/C][C]2.60713505625503e-17[/C][C]5.21427011251007e-17[/C][C]1[/C][/ROW]
[ROW][C]49[/C][C]1.87997043908413e-15[/C][C]3.75994087816826e-15[/C][C]0.999999999999998[/C][/ROW]
[ROW][C]50[/C][C]4.90184432450248e-08[/C][C]9.80368864900497e-08[/C][C]0.999999950981557[/C][/ROW]
[ROW][C]51[/C][C]0.000399679238536783[/C][C]0.000799358477073566[/C][C]0.999600320761463[/C][/ROW]
[ROW][C]52[/C][C]0.00436420959525487[/C][C]0.00872841919050974[/C][C]0.995635790404745[/C][/ROW]
[ROW][C]53[/C][C]0.0237213910577516[/C][C]0.0474427821155032[/C][C]0.976278608942248[/C][/ROW]
[ROW][C]54[/C][C]0.134938094444008[/C][C]0.269876188888015[/C][C]0.865061905555992[/C][/ROW]
[ROW][C]55[/C][C]0.0981065478757[/C][C]0.1962130957514[/C][C]0.9018934521243[/C][/ROW]
[/TABLE]
Source: https://freestatistics.org/blog/index.php?pk=58325&T=5

Globally Unique Identifier (entire table): ba.freestatistics.org/blog/index.php?pk=58325&T=5

As an alternative you can also use a QR Code:  

The GUIDs for individual cells are displayed in the table below:

Goldfeld-Quandt test for Heteroskedasticity
p-valuesAlternative Hypothesis
breakpoint indexgreater2-sidedless
50.002578797098791770.005157594197583550.997421202901208
60.0003061430004125850.000612286000825170.999693856999587
73.37775326166875e-056.7555065233375e-050.999966222467383
83.38700148833636e-066.77400297667271e-060.999996612998512
93.07753646685977e-076.15507293371955e-070.999999692246353
103.1442146778976e-086.2884293557952e-080.999999968557853
112.73940405681772e-095.47880811363544e-090.999999997260596
122.74784026159835e-105.4956805231967e-100.999999999725216
134.38231086453373e-118.76462172906745e-110.999999999956177
144.2037846880127e-128.4075693760254e-120.999999999995796
157.46854972902404e-131.49370994580481e-120.999999999999253
167.06883184458372e-141.41376636891674e-130.99999999999993
175.69199413668236e-141.13839882733647e-130.999999999999943
185.05693192107701e-141.01138638421540e-130.99999999999995
191.93618565966237e-143.87237131932475e-140.99999999999998
204.05899264790126e-138.11798529580252e-130.999999999999594
211.14851253983602e-132.29702507967203e-130.999999999999885
224.35623463342582e-128.71246926685163e-120.999999999995644
232.04365242513389e-124.08730485026778e-120.999999999997956
249.64920070496751e-131.92984014099350e-120.999999999999035
254.24737141935536e-138.49474283871073e-130.999999999999575
261.42398009899030e-132.84796019798060e-130.999999999999858
272.53418222693250e-135.06836445386499e-130.999999999999747
285.76768283943989e-141.15353656788798e-130.999999999999942
293.46123327527579e-146.92246655055159e-140.999999999999965
302.42041927093232e-144.84083854186463e-140.999999999999976
313.0511868177214e-146.1023736354428e-140.99999999999997
322.67744670931039e-145.35489341862079e-140.999999999999973
338.2430938513789e-151.64861877027578e-140.999999999999992
343.19690703424305e-156.3938140684861e-150.999999999999997
351.79871736950881e-153.59743473901762e-150.999999999999998
366.42231013288584e-161.28446202657717e-151
371.52224283669293e-163.04448567338587e-161
381.43868913142298e-162.87737826284596e-161
393.31699621762463e-176.63399243524926e-171
403.97204215430517e-167.94408430861033e-161
411.07524708704602e-162.15049417409204e-161
423.56736167822965e-177.1347233564593e-171
439.83009729734105e-171.96601945946821e-161
443.10746875391818e-176.21493750783637e-171
451.26021136772998e-172.52042273545995e-171
467.186052624078e-181.4372105248156e-171
474.61249347728168e-189.22498695456336e-181
482.60713505625503e-175.21427011251007e-171
491.87997043908413e-153.75994087816826e-150.999999999999998
504.90184432450248e-089.80368864900497e-080.999999950981557
510.0003996792385367830.0007993584770735660.999600320761463
520.004364209595254870.008728419190509740.995635790404745
530.02372139105775160.04744278211550320.976278608942248
540.1349380944440080.2698761888880150.865061905555992
550.09810654787570.19621309575140.9018934521243


Meta Analysis of Goldfeld-Quandt test for Heteroskedasticity
Description# significant tests% significant testsOK/NOK
1% type I error level480.941176470588235NOK
5% type I error level490.96078431372549NOK
10% type I error level490.96078431372549NOK

\begin{tabular}{lllllllll}
\hline
Meta Analysis of Goldfeld-Quandt test for Heteroskedasticity \tabularnewline
Description & # significant tests & % significant tests & OK/NOK \tabularnewline
1% type I error level & 48 & 0.941176470588235 & NOK \tabularnewline
5% type I error level & 49 & 0.96078431372549 & NOK \tabularnewline
10% type I error level & 49 & 0.96078431372549 & NOK \tabularnewline
\hline
\end{tabular}
%Source: https://freestatistics.org/blog/index.php?pk=58325&T=6

[TABLE]
[ROW][C]Meta Analysis of Goldfeld-Quandt test for Heteroskedasticity[/C][/ROW]
[ROW][C]Description[/C][C]# significant tests[/C][C]% significant tests[/C][C]OK/NOK[/C][/ROW]
[ROW][C]1% type I error level[/C][C]48[/C][C]0.941176470588235[/C][C]NOK[/C][/ROW]
[ROW][C]5% type I error level[/C][C]49[/C][C]0.96078431372549[/C][C]NOK[/C][/ROW]
[ROW][C]10% type I error level[/C][C]49[/C][C]0.96078431372549[/C][C]NOK[/C][/ROW]
[/TABLE]
Source: https://freestatistics.org/blog/index.php?pk=58325&T=6

Globally Unique Identifier (entire table): ba.freestatistics.org/blog/index.php?pk=58325&T=6

As an alternative you can also use a QR Code:  

The GUIDs for individual cells are displayed in the table below:

Meta Analysis of Goldfeld-Quandt test for Heteroskedasticity
Description# significant tests% significant testsOK/NOK
1% type I error level480.941176470588235NOK
5% type I error level490.96078431372549NOK
10% type I error level490.96078431372549NOK


Parameters (Session):
par1 = 1 ; par2 = Do not include Seasonal Dummies ; par3 = No Linear Trend ;
Parameters (R input):
par1 = 1 ; par2 = Do not include Seasonal Dummies ; par3 = No Linear Trend ;
R code (references can be found in the software module):
library(lattice)
library(lmtest)
n25 <- 25 #minimum number of obs. for Goldfeld-Quandt test
par1 <- as.numeric(par1)
x <- t(y)
k <- length(x[1,])
n <- length(x[,1])
x1 <- cbind(x[,par1], x[,1:k!=par1])
mycolnames <- c(colnames(x)[par1], colnames(x)[1:k!=par1])
colnames(x1) <- mycolnames #colnames(x)[par1]
x <- x1
if (par3 == 'First Differences'){
x2 <- array(0, dim=c(n-1,k), dimnames=list(1:(n-1), paste('(1-B)',colnames(x),sep='')))
for (i in 1:n-1) {
for (j in 1:k) {
x2[i,j] <- x[i+1,j] - x[i,j]
}
}
x <- x2
}
if (par2 == 'Include Monthly Dummies'){
x2 <- array(0, dim=c(n,11), dimnames=list(1:n, paste('M', seq(1:11), sep ='')))
for (i in 1:11){
x2[seq(i,n,12),i] <- 1
}
x <- cbind(x, x2)
}
if (par2 == 'Include Quarterly Dummies'){
x2 <- array(0, dim=c(n,3), dimnames=list(1:n, paste('Q', seq(1:3), sep ='')))
for (i in 1:3){
x2[seq(i,n,4),i] <- 1
}
x <- cbind(x, x2)
}
k <- length(x[1,])
if (par3 == 'Linear Trend'){
x <- cbind(x, c(1:n))
colnames(x)[k+1] <- 't'
}
x
k <- length(x[1,])
df <- as.data.frame(x)
(mylm <- lm(df))
(mysum <- summary(mylm))
if (n > n25) {
kp3 <- k + 3
nmkm3 <- n - k - 3
gqarr <- array(NA, dim=c(nmkm3-kp3+1,3))
numgqtests <- 0
numsignificant1 <- 0
numsignificant5 <- 0
numsignificant10 <- 0
for (mypoint in kp3:nmkm3) {
j <- 0
numgqtests <- numgqtests + 1
for (myalt in c('greater', 'two.sided', 'less')) {
j <- j + 1
gqarr[mypoint-kp3+1,j] <- gqtest(mylm, point=mypoint, alternative=myalt)$p.value
}
if (gqarr[mypoint-kp3+1,2] < 0.01) numsignificant1 <- numsignificant1 + 1
if (gqarr[mypoint-kp3+1,2] < 0.05) numsignificant5 <- numsignificant5 + 1
if (gqarr[mypoint-kp3+1,2] < 0.10) numsignificant10 <- numsignificant10 + 1
}
gqarr
}
bitmap(file='test0.png')
plot(x[,1], type='l', main='Actuals and Interpolation', ylab='value of Actuals and Interpolation (dots)', xlab='time or index')
points(x[,1]-mysum$resid)
grid()
dev.off()
bitmap(file='test1.png')
plot(mysum$resid, type='b', pch=19, main='Residuals', ylab='value of Residuals', xlab='time or index')
grid()
dev.off()
bitmap(file='test2.png')
hist(mysum$resid, main='Residual Histogram', xlab='values of Residuals')
grid()
dev.off()
bitmap(file='test3.png')
densityplot(~mysum$resid,col='black',main='Residual Density Plot', xlab='values of Residuals')
dev.off()
bitmap(file='test4.png')
qqnorm(mysum$resid, main='Residual Normal Q-Q Plot')
qqline(mysum$resid)
grid()
dev.off()
(myerror <- as.ts(mysum$resid))
bitmap(file='test5.png')
dum <- cbind(lag(myerror,k=1),myerror)
dum
dum1 <- dum[2:length(myerror),]
dum1
z <- as.data.frame(dum1)
z
plot(z,main=paste('Residual Lag plot, lowess, and regression line'), ylab='values of Residuals', xlab='lagged values of Residuals')
lines(lowess(z))
abline(lm(z))
grid()
dev.off()
bitmap(file='test6.png')
acf(mysum$resid, lag.max=length(mysum$resid)/2, main='Residual Autocorrelation Function')
grid()
dev.off()
bitmap(file='test7.png')
pacf(mysum$resid, lag.max=length(mysum$resid)/2, main='Residual Partial Autocorrelation Function')
grid()
dev.off()
bitmap(file='test8.png')
opar <- par(mfrow = c(2,2), oma = c(0, 0, 1.1, 0))
plot(mylm, las = 1, sub='Residual Diagnostics')
par(opar)
dev.off()
if (n > n25) {
bitmap(file='test9.png')
plot(kp3:nmkm3,gqarr[,2], main='Goldfeld-Quandt test',ylab='2-sided p-value',xlab='breakpoint')
grid()
dev.off()
}
load(file='createtable')
a<-table.start()
a<-table.row.start(a)
a<-table.element(a, 'Multiple Linear Regression - Estimated Regression Equation', 1, TRUE)
a<-table.row.end(a)
myeq <- colnames(x)[1]
myeq <- paste(myeq, '[t] = ', sep='')
for (i in 1:k){
if (mysum$coefficients[i,1] > 0) myeq <- paste(myeq, '+', '')
myeq <- paste(myeq, mysum$coefficients[i,1], sep=' ')
if (rownames(mysum$coefficients)[i] != '(Intercept)') {
myeq <- paste(myeq, rownames(mysum$coefficients)[i], sep='')
if (rownames(mysum$coefficients)[i] != 't') myeq <- paste(myeq, '[t]', sep='')
}
}
myeq <- paste(myeq, ' + e[t]')
a<-table.row.start(a)
a<-table.element(a, myeq)
a<-table.row.end(a)
a<-table.end(a)
table.save(a,file='mytable1.tab')
a<-table.start()
a<-table.row.start(a)
a<-table.element(a,hyperlink('ols1.htm','Multiple Linear Regression - Ordinary Least Squares',''), 6, TRUE)
a<-table.row.end(a)
a<-table.row.start(a)
a<-table.element(a,'Variable',header=TRUE)
a<-table.element(a,'Parameter',header=TRUE)
a<-table.element(a,'S.D.',header=TRUE)
a<-table.element(a,'T-STAT
H0: parameter = 0',header=TRUE)
a<-table.element(a,'2-tail p-value',header=TRUE)
a<-table.element(a,'1-tail p-value',header=TRUE)
a<-table.row.end(a)
for (i in 1:k){
a<-table.row.start(a)
a<-table.element(a,rownames(mysum$coefficients)[i],header=TRUE)
a<-table.element(a,mysum$coefficients[i,1])
a<-table.element(a, round(mysum$coefficients[i,2],6))
a<-table.element(a, round(mysum$coefficients[i,3],4))
a<-table.element(a, round(mysum$coefficients[i,4],6))
a<-table.element(a, round(mysum$coefficients[i,4]/2,6))
a<-table.row.end(a)
}
a<-table.end(a)
table.save(a,file='mytable2.tab')
a<-table.start()
a<-table.row.start(a)
a<-table.element(a, 'Multiple Linear Regression - Regression Statistics', 2, TRUE)
a<-table.row.end(a)
a<-table.row.start(a)
a<-table.element(a, 'Multiple R',1,TRUE)
a<-table.element(a, sqrt(mysum$r.squared))
a<-table.row.end(a)
a<-table.row.start(a)
a<-table.element(a, 'R-squared',1,TRUE)
a<-table.element(a, mysum$r.squared)
a<-table.row.end(a)
a<-table.row.start(a)
a<-table.element(a, 'Adjusted R-squared',1,TRUE)
a<-table.element(a, mysum$adj.r.squared)
a<-table.row.end(a)
a<-table.row.start(a)
a<-table.element(a, 'F-TEST (value)',1,TRUE)
a<-table.element(a, mysum$fstatistic[1])
a<-table.row.end(a)
a<-table.row.start(a)
a<-table.element(a, 'F-TEST (DF numerator)',1,TRUE)
a<-table.element(a, mysum$fstatistic[2])
a<-table.row.end(a)
a<-table.row.start(a)
a<-table.element(a, 'F-TEST (DF denominator)',1,TRUE)
a<-table.element(a, mysum$fstatistic[3])
a<-table.row.end(a)
a<-table.row.start(a)
a<-table.element(a, 'p-value',1,TRUE)
a<-table.element(a, 1-pf(mysum$fstatistic[1],mysum$fstatistic[2],mysum$fstatistic[3]))
a<-table.row.end(a)
a<-table.row.start(a)
a<-table.element(a, 'Multiple Linear Regression - Residual Statistics', 2, TRUE)
a<-table.row.end(a)
a<-table.row.start(a)
a<-table.element(a, 'Residual Standard Deviation',1,TRUE)
a<-table.element(a, mysum$sigma)
a<-table.row.end(a)
a<-table.row.start(a)
a<-table.element(a, 'Sum Squared Residuals',1,TRUE)
a<-table.element(a, sum(myerror*myerror))
a<-table.row.end(a)
a<-table.end(a)
table.save(a,file='mytable3.tab')
a<-table.start()
a<-table.row.start(a)
a<-table.element(a, 'Multiple Linear Regression - Actuals, Interpolation, and Residuals', 4, TRUE)
a<-table.row.end(a)
a<-table.row.start(a)
a<-table.element(a, 'Time or Index', 1, TRUE)
a<-table.element(a, 'Actuals', 1, TRUE)
a<-table.element(a, 'Interpolation
Forecast', 1, TRUE)
a<-table.element(a, 'Residuals
Prediction Error', 1, TRUE)
a<-table.row.end(a)
for (i in 1:n) {
a<-table.row.start(a)
a<-table.element(a,i, 1, TRUE)
a<-table.element(a,x[i])
a<-table.element(a,x[i]-mysum$resid[i])
a<-table.element(a,mysum$resid[i])
a<-table.row.end(a)
}
a<-table.end(a)
table.save(a,file='mytable4.tab')
if (n > n25) {
a<-table.start()
a<-table.row.start(a)
a<-table.element(a,'Goldfeld-Quandt test for Heteroskedasticity',4,TRUE)
a<-table.row.end(a)
a<-table.row.start(a)
a<-table.element(a,'p-values',header=TRUE)
a<-table.element(a,'Alternative Hypothesis',3,header=TRUE)
a<-table.row.end(a)
a<-table.row.start(a)
a<-table.element(a,'breakpoint index',header=TRUE)
a<-table.element(a,'greater',header=TRUE)
a<-table.element(a,'2-sided',header=TRUE)
a<-table.element(a,'less',header=TRUE)
a<-table.row.end(a)
for (mypoint in kp3:nmkm3) {
a<-table.row.start(a)
a<-table.element(a,mypoint,header=TRUE)
a<-table.element(a,gqarr[mypoint-kp3+1,1])
a<-table.element(a,gqarr[mypoint-kp3+1,2])
a<-table.element(a,gqarr[mypoint-kp3+1,3])
a<-table.row.end(a)
}
a<-table.end(a)
table.save(a,file='mytable5.tab')
a<-table.start()
a<-table.row.start(a)
a<-table.element(a,'Meta Analysis of Goldfeld-Quandt test for Heteroskedasticity',4,TRUE)
a<-table.row.end(a)
a<-table.row.start(a)
a<-table.element(a,'Description',header=TRUE)
a<-table.element(a,'# significant tests',header=TRUE)
a<-table.element(a,'% significant tests',header=TRUE)
a<-table.element(a,'OK/NOK',header=TRUE)
a<-table.row.end(a)
a<-table.row.start(a)
a<-table.element(a,'1% type I error level',header=TRUE)
a<-table.element(a,numsignificant1)
a<-table.element(a,numsignificant1/numgqtests)
if (numsignificant1/numgqtests < 0.01) dum <- 'OK' else dum <- 'NOK'
a<-table.element(a,dum)
a<-table.row.end(a)
a<-table.row.start(a)
a<-table.element(a,'5% type I error level',header=TRUE)
a<-table.element(a,numsignificant5)
a<-table.element(a,numsignificant5/numgqtests)
if (numsignificant5/numgqtests < 0.05) dum <- 'OK' else dum <- 'NOK'
a<-table.element(a,dum)
a<-table.row.end(a)
a<-table.row.start(a)
a<-table.element(a,'10% type I error level',header=TRUE)
a<-table.element(a,numsignificant10)
a<-table.element(a,numsignificant10/numgqtests)
if (numsignificant10/numgqtests < 0.1) dum <- 'OK' else dum <- 'NOK'
a<-table.element(a,dum)
a<-table.row.end(a)
a<-table.end(a)
table.save(a,file='mytable6.tab')
}