| Multiple Linear Regression - Estimated Regression Equation |
| saldo_zichtrek[t] = + 34.51236 + 2.32273090909091crisis[t] + e[t] |
| Multiple Linear Regression - Ordinary Least Squares | |||||
| Variable | Parameter | S.D. | T-STAT H0: parameter = 0 | 2-tail p-value | 1-tail p-value |
| (Intercept) | 34.51236 | 0.327383 | 105.4188 | 0 | 0 |
| crisis | 2.32273090909091 | 0.770948 | 3.0128 | 0.003809 | 0.001904 |
| Multiple Linear Regression - Regression Statistics | |
| Multiple R | 0.365151455024568 |
| R-squared | 0.133335585106559 |
| Adjusted R-squared | 0.118646357735484 |
| F-TEST (value) | 9.07709995483573 |
| F-TEST (DF numerator) | 1 |
| F-TEST (DF denominator) | 59 |
| p-value | 0.0038089721258604 |
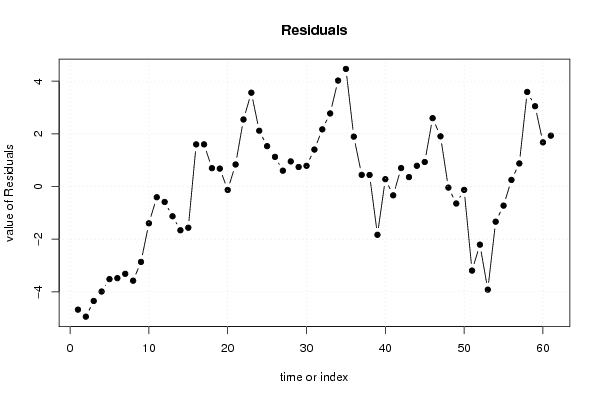
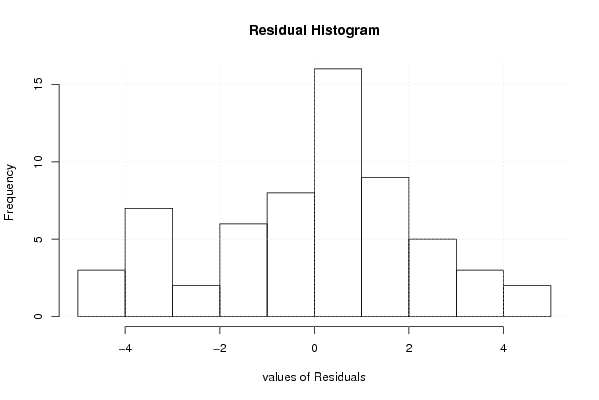
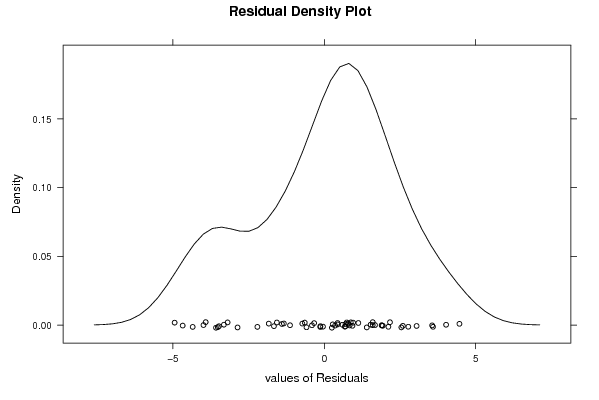
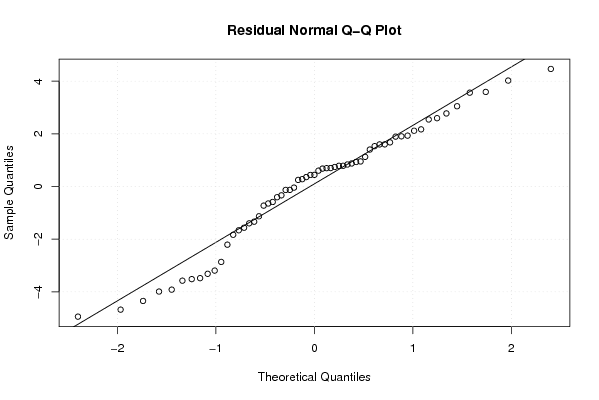
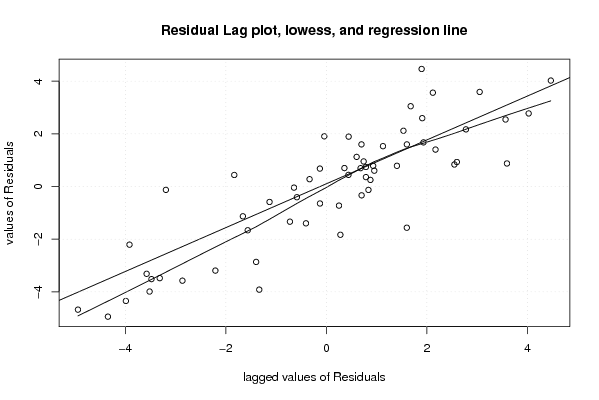
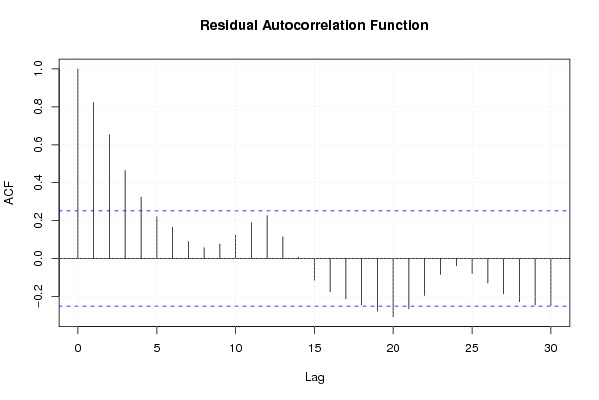
| Multiple Linear Regression - Residual Statistics | |
| Residual Standard Deviation | 2.31495081189860 |
| Sum Squared Residuals | 316.18083842909 |
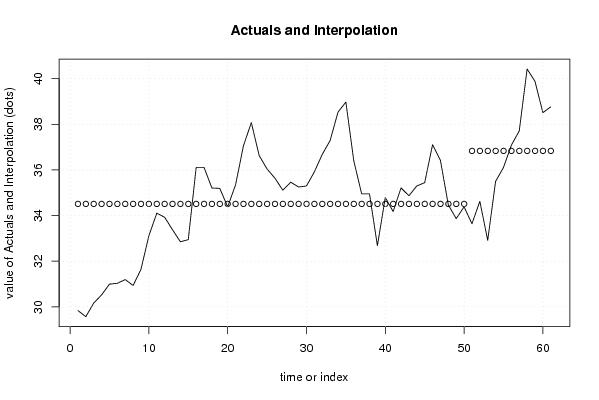
| Multiple Linear Regression - Actuals, Interpolation, and Residuals | |||
| Time or Index | Actuals | Interpolation Forecast | Residuals Prediction Error |
| 1 | 29.837 | 34.5123599999999 | -4.67535999999994 |
| 2 | 29.571 | 34.51236 | -4.94136 |
| 3 | 30.167 | 34.51236 | -4.34536 |
| 4 | 30.524 | 34.51236 | -3.98836 |
| 5 | 30.996 | 34.51236 | -3.51636 |
| 6 | 31.033 | 34.51236 | -3.47936 |
| 7 | 31.198 | 34.51236 | -3.31436 |
| 8 | 30.937 | 34.51236 | -3.57536 |
| 9 | 31.649 | 34.51236 | -2.86336 |
| 10 | 33.115 | 34.51236 | -1.39736 |
| 11 | 34.106 | 34.51236 | -0.406359999999999 |
| 12 | 33.926 | 34.51236 | -0.586359999999999 |
| 13 | 33.382 | 34.51236 | -1.13036000000000 |
| 14 | 32.851 | 34.51236 | -1.66136000000000 |
| 15 | 32.948 | 34.51236 | -1.56436 |
| 16 | 36.112 | 34.51236 | 1.59964 |
| 17 | 36.113 | 34.51236 | 1.60064 |
| 18 | 35.21 | 34.51236 | 0.69764 |
| 19 | 35.193 | 34.51236 | 0.680639999999997 |
| 20 | 34.383 | 34.51236 | -0.129359999999998 |
| 21 | 35.349 | 34.51236 | 0.836639999999996 |
| 22 | 37.058 | 34.51236 | 2.54564 |
| 23 | 38.076 | 34.51236 | 3.56364 |
| 24 | 36.63 | 34.51236 | 2.11764 |
| 25 | 36.045 | 34.51236 | 1.53264 |
| 26 | 35.638 | 34.51236 | 1.12564000000000 |
| 27 | 35.114 | 34.51236 | 0.601639999999996 |
| 28 | 35.465 | 34.51236 | 0.952640000000003 |
| 29 | 35.254 | 34.51236 | 0.741639999999997 |
| 30 | 35.299 | 34.51236 | 0.786639999999999 |
| 31 | 35.916 | 34.51236 | 1.40364000000000 |
| 32 | 36.683 | 34.51236 | 2.17064 |
| 33 | 37.288 | 34.51236 | 2.77564000000000 |
| 34 | 38.536 | 34.51236 | 4.02364 |
| 35 | 38.977 | 34.51236 | 4.46464 |
| 36 | 36.407 | 34.51236 | 1.89464000000000 |
| 37 | 34.955 | 34.51236 | 0.442639999999997 |
| 38 | 34.951 | 34.51236 | 0.43864 |
| 39 | 32.68 | 34.51236 | -1.83236 |
| 40 | 34.791 | 34.51236 | 0.278639999999996 |
| 41 | 34.178 | 34.51236 | -0.334360000000004 |
| 42 | 35.213 | 34.51236 | 0.70064 |
| 43 | 34.871 | 34.51236 | 0.358640000000001 |
| 44 | 35.299 | 34.51236 | 0.786639999999999 |
| 45 | 35.443 | 34.51236 | 0.930639999999997 |
| 46 | 37.108 | 34.51236 | 2.59564000000000 |
| 47 | 36.419 | 34.51236 | 1.90664000000000 |
| 48 | 34.471 | 34.51236 | -0.0413600000000043 |
| 49 | 33.868 | 34.51236 | -0.644359999999999 |
| 50 | 34.385 | 34.51236 | -0.127360000000003 |
| 51 | 33.643 | 36.8350909090909 | -3.19209090909091 |
| 52 | 34.627 | 36.8350909090909 | -2.20809090909091 |
| 53 | 32.919 | 36.8350909090909 | -3.91609090909091 |
| 54 | 35.5 | 36.8350909090909 | -1.33509090909091 |
| 55 | 36.11 | 36.8350909090909 | -0.72509090909091 |
| 56 | 37.086 | 36.8350909090909 | 0.250909090909089 |
| 57 | 37.711 | 36.8350909090909 | 0.875909090909089 |
| 58 | 40.427 | 36.8350909090909 | 3.59190909090909 |
| 59 | 39.884 | 36.8350909090909 | 3.04890909090909 |
| 60 | 38.512 | 36.8350909090909 | 1.67690909090909 |
| 61 | 38.767 | 36.8350909090909 | 1.93190909090909 |
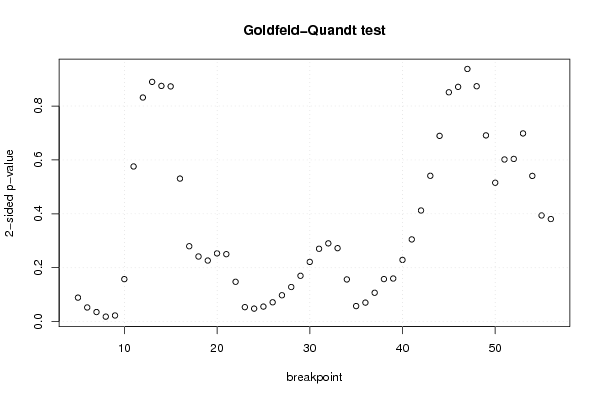
| Goldfeld-Quandt test for Heteroskedasticity | |||
| p-values | Alternative Hypothesis | ||
| breakpoint index | greater | 2-sided | less |
| 5 | 0.0444514180904146 | 0.0889028361808292 | 0.955548581909585 |
| 6 | 0.0262134528231743 | 0.0524269056463486 | 0.973786547176826 |
| 7 | 0.0176989157193473 | 0.0353978314386947 | 0.982301084280653 |
| 8 | 0.0091577418377983 | 0.0183154836755966 | 0.990842258162202 |
| 9 | 0.0113300203266738 | 0.0226600406533476 | 0.988669979673326 |
| 10 | 0.0787689098987102 | 0.157537819797420 | 0.92123109010129 |
| 11 | 0.287849469216091 | 0.575698938432182 | 0.712150530783909 |
| 12 | 0.415816595286859 | 0.831633190573717 | 0.584183404713141 |
| 13 | 0.444830891370887 | 0.889661782741774 | 0.555169108629113 |
| 14 | 0.437354127072819 | 0.874708254145637 | 0.562645872927181 |
| 15 | 0.436457973985527 | 0.872915947971054 | 0.563542026014473 |
| 16 | 0.734640438933907 | 0.530719122132185 | 0.265359561066093 |
| 17 | 0.860160445903812 | 0.279679108192376 | 0.139839554096188 |
| 18 | 0.879216607515913 | 0.241566784968174 | 0.120783392484087 |
| 19 | 0.886703953004279 | 0.226592093991443 | 0.113296046995721 |
| 20 | 0.873435534307263 | 0.253128931385474 | 0.126564465692737 |
| 21 | 0.874882625026938 | 0.250234749946125 | 0.125117374973062 |
| 22 | 0.926159605670542 | 0.147680788658917 | 0.0738403943294585 |
| 23 | 0.973201455902888 | 0.0535970881942249 | 0.0267985440971125 |
| 24 | 0.975935223771255 | 0.0481295524574908 | 0.0240647762287454 |
| 25 | 0.972201234964531 | 0.055597530070938 | 0.027798765035469 |
| 26 | 0.96419353656095 | 0.0716129268781028 | 0.0358064634390514 |
| 27 | 0.951124146208242 | 0.0977517075835165 | 0.0488758537917582 |
| 28 | 0.935847397260447 | 0.128305205479105 | 0.0641526027395527 |
| 29 | 0.915035567694846 | 0.169928864610309 | 0.0849644323051545 |
| 30 | 0.889227010210709 | 0.221545979578582 | 0.110772989789291 |
| 31 | 0.864911053814098 | 0.270177892371803 | 0.135088946185901 |
| 32 | 0.854817442679886 | 0.290365114640229 | 0.145182557320114 |
| 33 | 0.863731718490316 | 0.272536563019368 | 0.136268281509684 |
| 34 | 0.921760049845808 | 0.156479900308384 | 0.0782399501541919 |
| 35 | 0.971203168603495 | 0.0575936627930105 | 0.0287968313965053 |
| 36 | 0.964808797076874 | 0.0703824058462523 | 0.0351912029231262 |
| 37 | 0.946507392606015 | 0.106985214787970 | 0.0534926073939852 |
| 38 | 0.921094353444643 | 0.157811293110715 | 0.0789056465553575 |
| 39 | 0.920090648834259 | 0.159818702331482 | 0.0799093511657408 |
| 40 | 0.885531542386359 | 0.228936915227283 | 0.114468457613641 |
| 41 | 0.84749551731093 | 0.30500896537814 | 0.15250448268907 |
| 42 | 0.793827854519345 | 0.41234429096131 | 0.206172145480655 |
| 43 | 0.729444767167321 | 0.541110465665357 | 0.270555232832679 |
| 44 | 0.655338533346338 | 0.689322933307324 | 0.344661466653662 |
| 45 | 0.574501101421803 | 0.850997797156394 | 0.425498898578197 |
| 46 | 0.564425653195201 | 0.871148693609598 | 0.435574346804799 |
| 47 | 0.531164530372495 | 0.93767093925501 | 0.468835469627505 |
| 48 | 0.436770353983095 | 0.87354070796619 | 0.563229646016905 |
| 49 | 0.345530142512706 | 0.691060285025412 | 0.654469857487294 |
| 50 | 0.257647146910681 | 0.515294293821361 | 0.74235285308932 |
| 51 | 0.300845667093492 | 0.601691334186984 | 0.699154332906508 |
| 52 | 0.301886592724949 | 0.603773185449898 | 0.698113407275051 |
| 53 | 0.650793002960837 | 0.698413994078326 | 0.349206997039163 |
| 54 | 0.72966473464844 | 0.540670530703121 | 0.270335265351561 |
| 55 | 0.80303690084981 | 0.393926198300381 | 0.196963099150190 |
| 56 | 0.809690198205877 | 0.380619603588247 | 0.190309801794123 |
| Meta Analysis of Goldfeld-Quandt test for Heteroskedasticity | |||
| Description | # significant tests | % significant tests | OK/NOK |
| 1% type I error level | 0 | 0 | OK |
| 5% type I error level | 4 | 0.0769230769230769 | NOK |
| 10% type I error level | 12 | 0.230769230769231 | NOK |