| Multiple Linear Regression - Estimated Regression Equation |
| wngb[t] = + 1588.51070846361 + 47.8206258852458`<25`[t] + 157.074438119669M1[t] -376.136315775409M2[t] -552.818466554426M3[t] -384.479991448196M4[t] -320.164477939016M5[t] -607.936139394426M6[t] -280.520714075738M7[t] -83.4001763809834M8[t] -245.166813650820M9[t] + 139.943499291803M10[t] -111.048788048852M11[t] + e[t] |
| Multiple Linear Regression - Ordinary Least Squares | |||||
| Variable | Parameter | S.D. | T-STAT H0: parameter = 0 | 2-tail p-value | 1-tail p-value |
| (Intercept) | 1588.51070846361 | 514.803878 | 3.0857 | 0.003399 | 0.0017 |
| `<25` | 47.8206258852458 | 26.44797 | 1.8081 | 0.076992 | 0.038496 |
| M1 | 157.074438119669 | 205.479452 | 0.7644 | 0.448433 | 0.224216 |
| M2 | -376.136315775409 | 226.837256 | -1.6582 | 0.103942 | 0.051971 |
| M3 | -552.818466554426 | 237.806522 | -2.3247 | 0.024461 | 0.01223 |
| M4 | -384.479991448196 | 236.205694 | -1.6277 | 0.110268 | 0.055134 |
| M5 | -320.164477939016 | 222.686254 | -1.4377 | 0.157134 | 0.078567 |
| M6 | -607.936139394426 | 212.326307 | -2.8632 | 0.006247 | 0.003123 |
| M7 | -280.520714075738 | 209.988888 | -1.3359 | 0.18802 | 0.09401 |
| M8 | -83.4001763809834 | 208.761452 | -0.3995 | 0.691335 | 0.345667 |
| M9 | -245.166813650820 | 207.511926 | -1.1815 | 0.243364 | 0.121682 |
| M10 | 139.943499291803 | 205.734609 | 0.6802 | 0.499706 | 0.249853 |
| M11 | -111.048788048852 | 205.299631 | -0.5409 | 0.591124 | 0.295562 |
| Multiple Linear Regression - Regression Statistics | |
| Multiple R | 0.563892530113455 |
| R-squared | 0.317974785517753 |
| Adjusted R-squared | 0.143840688203137 |
| F-TEST (value) | 1.82603401873244 |
| F-TEST (DF numerator) | 12 |
| F-TEST (DF denominator) | 47 |
| p-value | 0.0710475831667519 |
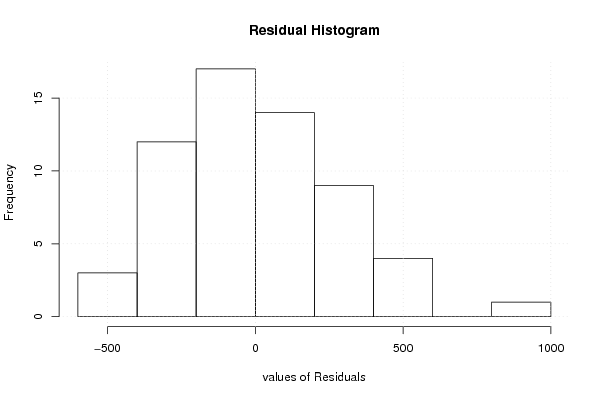
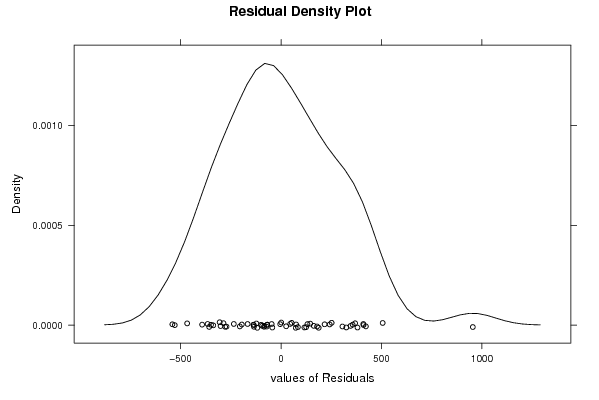
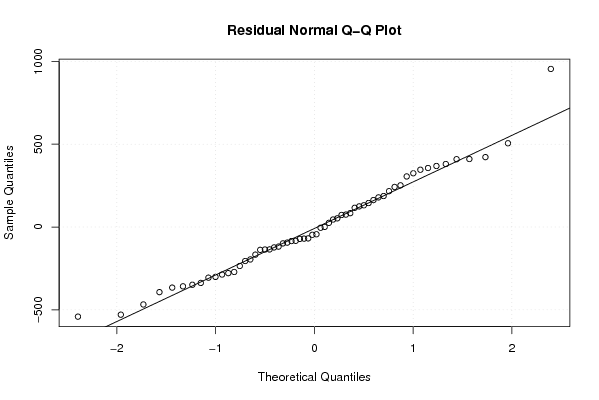
| Multiple Linear Regression - Residual Statistics | |
| Residual Standard Deviation | 323.570134071516 |
| Sum Squared Residuals | 4920788.68816377 |
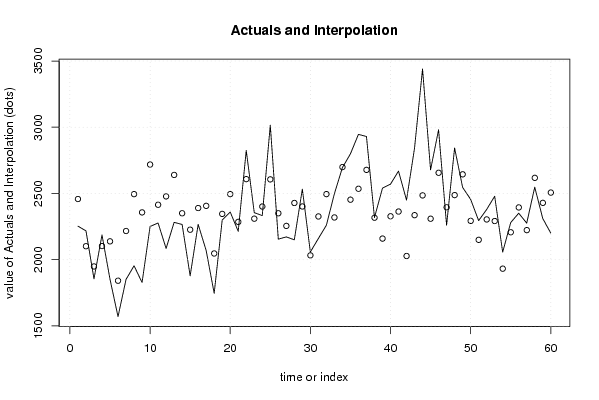
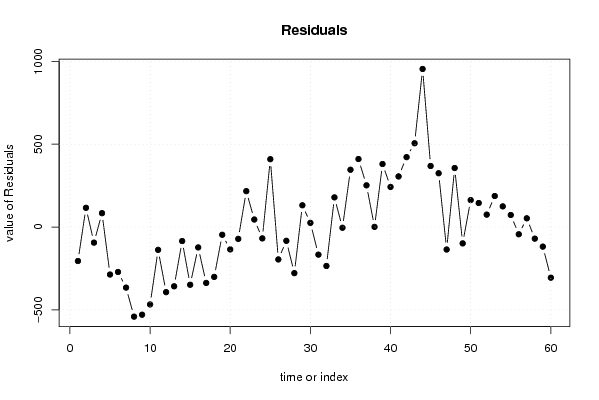
| Multiple Linear Regression - Actuals, Interpolation, and Residuals | |||
| Time or Index | Actuals | Interpolation Forecast | Residuals Prediction Error |
| 1 | 2253 | 2458.11247227345 | -205.112472273453 |
| 2 | 2218 | 2101.83803415377 | 116.161965846229 |
| 3 | 1855 | 1949.06619631738 | -94.0661963173776 |
| 4 | 2187 | 2103.05848365803 | 83.9415163419666 |
| 5 | 1852 | 2138.68162163607 | -286.681621636066 |
| 6 | 1570 | 1841.34583500361 | -271.345835003607 |
| 7 | 1851 | 2216.58188620754 | -365.581886207541 |
| 8 | 1954 | 2494.99748790721 | -540.997487907213 |
| 9 | 1828 | 2357.14116358 | -529.14116358 |
| 10 | 2251 | 2718.34116358 | -467.34116358 |
| 11 | 2277 | 2414.74618776557 | -137.746187765574 |
| 12 | 2085 | 2477.97434992918 | -392.97434992918 |
| 13 | 2282 | 2639.83085063737 | -357.830850637374 |
| 14 | 2266 | 2350.50528875705 | -84.505288757049 |
| 15 | 1878 | 2226.42582645180 | -348.425826451803 |
| 16 | 2267 | 2389.98223896951 | -122.982238969508 |
| 17 | 2069 | 2406.47712659344 | -337.477126593442 |
| 18 | 1746 | 2046.97452631016 | -300.974526310164 |
| 19 | 2299 | 2345.69757609770 | -46.6975760977046 |
| 20 | 2360 | 2494.99748790721 | -134.997487907213 |
| 21 | 2214 | 2285.41022475213 | -71.4102247521312 |
| 22 | 2825 | 2608.35372404393 | 216.646275956065 |
| 23 | 2355 | 2309.54081081803 | 45.459189181967 |
| 24 | 2333 | 2401.46134851279 | -68.461348512787 |
| 25 | 3016 | 2606.35641251770 | 409.643587482298 |
| 26 | 2155 | 2350.50528875705 | -195.505288757049 |
| 27 | 2172 | 2255.11820198295 | -83.1182019829507 |
| 28 | 2150 | 2428.23873967770 | -278.238739677705 |
| 29 | 2533 | 2401.69506400492 | 131.304935995082 |
| 30 | 2058 | 2032.62833854459 | 25.3716614554101 |
| 31 | 2160 | 2326.56932574361 | -166.569325743606 |
| 32 | 2260 | 2494.99748790721 | -234.997487907213 |
| 33 | 2498 | 2318.88466287180 | 179.115337128197 |
| 34 | 2695 | 2699.2129132259 | -4.21291322590157 |
| 35 | 2799 | 2453.00268847377 | 345.99731152623 |
| 36 | 2946 | 2535.35910099148 | 410.640899008525 |
| 37 | 2930 | 2678.08735134557 | 251.912648654429 |
| 38 | 2318 | 2317.03085063738 | 0.969149362623003 |
| 39 | 2540 | 2159.47695021246 | 380.523049787541 |
| 40 | 2570 | 2327.81542531869 | 242.184574681312 |
| 41 | 2669 | 2363.43856329672 | 305.561436703279 |
| 42 | 2450 | 2027.84627595607 | 422.153724043935 |
| 43 | 2842 | 2336.13345092066 | 505.866549079345 |
| 44 | 3440 | 2485.43336273016 | 954.566637269836 |
| 45 | 2678 | 2309.32053769475 | 368.679462305246 |
| 46 | 2981 | 2656.17434992918 | 324.82565007082 |
| 47 | 2260 | 2395.61793741148 | -135.617937411475 |
| 48 | 2844 | 2487.53847510623 | 356.46152489377 |
| 49 | 2546 | 2644.6129132259 | -98.612913225899 |
| 50 | 2456 | 2293.12053769475 | 162.879462305246 |
| 51 | 2295 | 2149.91282503541 | 145.08717496459 |
| 52 | 2379 | 2303.90511237607 | 75.0948876239345 |
| 53 | 2479 | 2291.70762446885 | 187.292375531148 |
| 54 | 2057 | 1932.20502418557 | 124.794975814426 |
| 55 | 2280 | 2207.01776103049 | 72.982238969508 |
| 56 | 2351 | 2394.57417354820 | -43.574173548197 |
| 57 | 2276 | 2223.24341110131 | 52.7565888986883 |
| 58 | 2548 | 2617.91784922098 | -69.917849220984 |
| 59 | 2311 | 2429.09237553115 | -118.092375531147 |
| 60 | 2201 | 2506.66672546033 | -305.666725460328 |
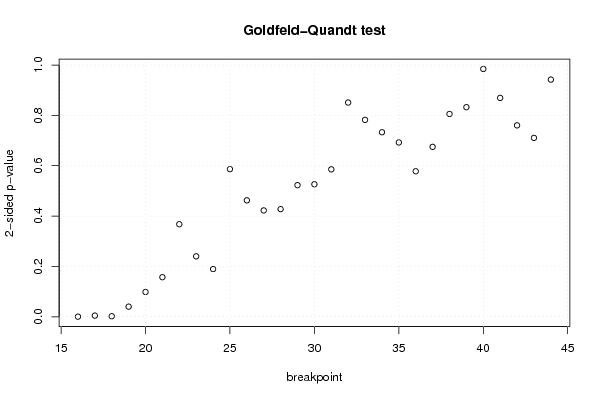
| Goldfeld-Quandt test for Heteroskedasticity | |||
| p-values | Alternative Hypothesis | ||
| breakpoint index | greater | 2-sided | less |
| 16 | 0.000214716387293338 | 0.000429432774586676 | 0.999785283612707 |
| 17 | 0.00232717015166516 | 0.00465434030333032 | 0.997672829848335 |
| 18 | 0.00104114817018728 | 0.00208229634037456 | 0.998958851829813 |
| 19 | 0.0200808937748702 | 0.0401617875497405 | 0.97991910622513 |
| 20 | 0.0492190508313813 | 0.0984381016627626 | 0.950780949168619 |
| 21 | 0.0785731497578985 | 0.157146299515797 | 0.921426850242101 |
| 22 | 0.183792130570613 | 0.367584261141226 | 0.816207869429387 |
| 23 | 0.120007924842556 | 0.240015849685111 | 0.879992075157444 |
| 24 | 0.0947686163042809 | 0.189537232608562 | 0.905231383695719 |
| 25 | 0.293217902021464 | 0.586435804042928 | 0.706782097978536 |
| 26 | 0.231232874242615 | 0.462465748485229 | 0.768767125757385 |
| 27 | 0.21115829706949 | 0.42231659413898 | 0.78884170293051 |
| 28 | 0.213708796075801 | 0.427417592151602 | 0.7862912039242 |
| 29 | 0.261336184548452 | 0.522672369096903 | 0.738663815451548 |
| 30 | 0.263148096164772 | 0.526296192329543 | 0.736851903835228 |
| 31 | 0.292776625508004 | 0.585553251016008 | 0.707223374491996 |
| 32 | 0.574536640985605 | 0.85092671802879 | 0.425463359014395 |
| 33 | 0.60896468451887 | 0.78207063096226 | 0.39103531548113 |
| 34 | 0.633568184690416 | 0.732863630619169 | 0.366431815309584 |
| 35 | 0.653803488475933 | 0.692393023048135 | 0.346196511524067 |
| 36 | 0.711078757004813 | 0.577842485990374 | 0.288921242995187 |
| 37 | 0.662528499908923 | 0.674943000182153 | 0.337471500091077 |
| 38 | 0.597257865018128 | 0.805484269963743 | 0.402742134981872 |
| 39 | 0.583799739661498 | 0.832400520677004 | 0.416200260338502 |
| 40 | 0.492164964223603 | 0.984329928447207 | 0.507835035776397 |
| 41 | 0.434644889643904 | 0.869289779287808 | 0.565355110356096 |
| 42 | 0.380174161688851 | 0.760348323377702 | 0.619825838311149 |
| 43 | 0.355233040364110 | 0.710466080728221 | 0.64476695963589 |
| 44 | 0.528980449001085 | 0.94203910199783 | 0.471019550998915 |
| Meta Analysis of Goldfeld-Quandt test for Heteroskedasticity | |||
| Description | # significant tests | % significant tests | OK/NOK |
| 1% type I error level | 3 | 0.103448275862069 | NOK |
| 5% type I error level | 4 | 0.137931034482759 | NOK |
| 10% type I error level | 5 | 0.172413793103448 | NOK |