| Multiple Linear Regression - Estimated Regression Equation |
| wisselkoers[t] = + 229.996777988985 -1.30967774785332consumptieprijzen[t] + 0.785022580191187M1[t] + 1.96611624075313M2[t] + 1.47713232739671M3[t] -0.366566192051892M4[t] + 0.779934307996218M5[t] + 1.92797452086387M6[t] + 0.506668150275282M7[t] + 0.0127663425833398M8[t] -0.647583681956498M9[t] + 0.537257220167209M10[t] -0.0653346407386438M11[t] + e[t] |
| Multiple Linear Regression - Ordinary Least Squares | |||||
| Variable | Parameter | S.D. | T-STAT H0: parameter = 0 | 2-tail p-value | 1-tail p-value |
| (Intercept) | 229.996777988985 | 20.929821 | 10.989 | 0 | 0 |
| consumptieprijzen | -1.30967774785332 | 0.194962 | -6.7176 | 0 | 0 |
| M1 | 0.785022580191187 | 3.43633 | 0.2284 | 0.820289 | 0.410145 |
| M2 | 1.96611624075313 | 3.434496 | 0.5725 | 0.569738 | 0.284869 |
| M3 | 1.47713232739671 | 3.435127 | 0.43 | 0.669155 | 0.334578 |
| M4 | -0.366566192051892 | 3.431486 | -0.1068 | 0.915383 | 0.457692 |
| M5 | 0.779934307996218 | 3.422234 | 0.2279 | 0.820711 | 0.410355 |
| M6 | 1.92797452086387 | 3.420301 | 0.5637 | 0.575648 | 0.287824 |
| M7 | 0.506668150275282 | 3.417063 | 0.1483 | 0.882759 | 0.44138 |
| M8 | 0.0127663425833398 | 3.415417 | 0.0037 | 0.997033 | 0.498517 |
| M9 | -0.647583681956498 | 3.414858 | -0.1896 | 0.85041 | 0.425205 |
| M10 | 0.537257220167209 | 3.414403 | 0.1574 | 0.875643 | 0.437821 |
| M11 | -0.0653346407386438 | 3.414368 | -0.0191 | 0.984814 | 0.492407 |
| Multiple Linear Regression - Regression Statistics | |
| Multiple R | 0.719881802483796 |
| R-squared | 0.518229809547319 |
| Adjusted R-squared | 0.395224654538124 |
| F-TEST (value) | 4.21307391148427 |
| F-TEST (DF numerator) | 12 |
| F-TEST (DF denominator) | 47 |
| p-value | 0.000173715412039699 |
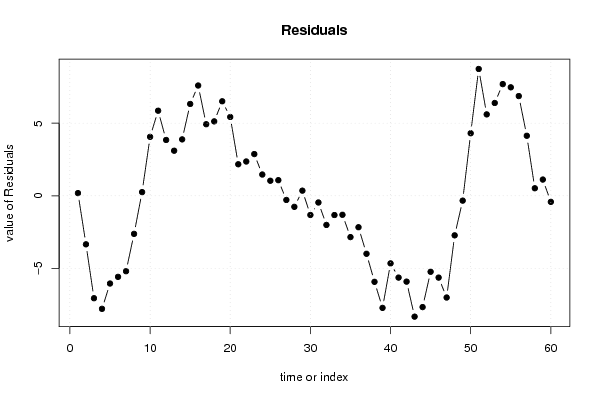
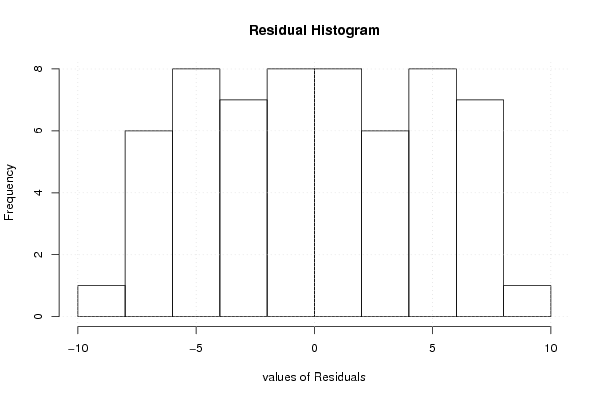
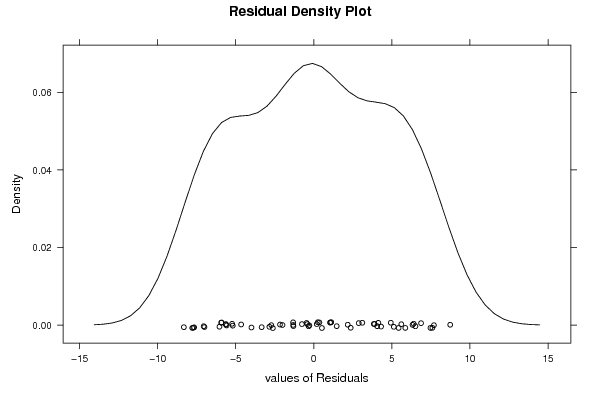
| Multiple Linear Regression - Residual Statistics | |
| Residual Standard Deviation | 5.39857808069091 |
| Sum Squared Residuals | 1369.79832878587 |
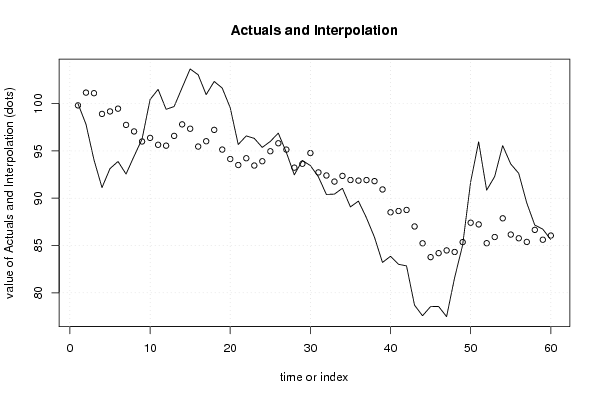
| Multiple Linear Regression - Actuals, Interpolation, and Residuals | |||
| Time or Index | Actuals | Interpolation Forecast | Residuals Prediction Error |
| 1 | 100 | 99.814025783844 | 0.185974216155999 |
| 2 | 97.82226485 | 101.163675140813 | -3.34141029081277 |
| 3 | 94.04971502 | 101.102563379874 | -7.0528483598737 |
| 4 | 91.12460521 | 98.908787644811 | -7.7841824348109 |
| 5 | 93.13202153 | 99.1736121813265 | -6.04159065132651 |
| 6 | 93.88342812 | 99.4659081679402 | -5.58248004794015 |
| 7 | 92.55349954 | 97.746387781262 | -5.19288824126204 |
| 8 | 94.43494835 | 97.057998697046 | -2.62305034704610 |
| 9 | 96.25017563 | 95.9957081787868 | 0.254467451213242 |
| 10 | 100.4355715 | 96.3766680934715 | 4.05890340652855 |
| 11 | 101.5036685 | 95.6444180045604 | 5.85925049543965 |
| 12 | 99.39789728 | 95.5541626669185 | 3.84373461308152 |
| 13 | 99.68990733 | 96.5855358934164 | 3.10437143658359 |
| 14 | 101.6895041 | 97.8055271140574 | 3.88397698594263 |
| 15 | 103.6652759 | 97.3424748201084 | 6.32280107989155 |
| 16 | 103.0532766 | 95.4598788715486 | 7.59339772845141 |
| 17 | 100.9500712 | 96.0229172800892 | 4.92715391991081 |
| 18 | 102.345366 | 97.2228207317718 | 5.12254526822818 |
| 19 | 101.6472299 | 95.1402574114532 | 6.50697248854677 |
| 20 | 99.56809393 | 94.1406886324118 | 5.42740529758822 |
| 21 | 95.67727392 | 93.5062702272794 | 2.17100369272056 |
| 22 | 96.58494865 | 94.2243414561971 | 2.36060719380287 |
| 23 | 96.32604937 | 93.4531939381748 | 2.87285543182523 |
| 24 | 95.37109101 | 93.9075032629292 | 1.46358774707081 |
| 25 | 96.00056203 | 94.9648081088346 | 1.03575392116537 |
| 26 | 96.88367859 | 95.8087903241958 | 1.0748882658042 |
| 27 | 94.85280372 | 95.138284944019 | -0.285481224019131 |
| 28 | 92.46943974 | 93.2297573760518 | -0.760317636051798 |
| 29 | 93.99180173 | 93.6372059371796 | 0.354595792820371 |
| 30 | 93.45262168 | 94.7722803403435 | -1.31965866034354 |
| 31 | 92.26698759 | 92.7286144491362 | -0.461626859136179 |
| 32 | 90.39653498 | 92.4032682985607 | -2.00673331856072 |
| 33 | 90.43001228 | 91.7558840837246 | -1.32587180372463 |
| 34 | 91.04995327 | 92.3572630253086 | -1.30730975530858 |
| 35 | 89.07845784 | 91.9232268215192 | -2.84476898151924 |
| 36 | 89.69314509 | 91.8589032342526 | -2.16575814425263 |
| 37 | 87.92459054 | 91.917839816195 | -3.99324927619506 |
| 38 | 85.8789319 | 91.8023511967045 | -5.92341929670446 |
| 39 | 83.20612366 | 90.9243925993323 | -7.71826893933228 |
| 40 | 83.85722053 | 88.5101977980799 | -4.65297726807989 |
| 41 | 83.01393462 | 88.6453642244612 | -5.63142960446125 |
| 42 | 82.84508195 | 88.7561386132869 | -5.91105666328688 |
| 43 | 78.68864276 | 87.0106866072013 | -8.32204384720128 |
| 44 | 77.56959675 | 85.2331684601283 | -7.66357171012832 |
| 45 | 78.53689529 | 83.7689373171817 | -5.23204202718169 |
| 46 | 78.55717715 | 84.1887947919454 | -5.63161764194539 |
| 47 | 77.4761291 | 84.4808445864048 | -7.0047154864048 |
| 48 | 81.58931659 | 84.3127945215082 | -2.72347793150821 |
| 49 | 85.02428326 | 85.3571335577099 | -0.332850297709895 |
| 50 | 91.71290159 | 87.4069372542296 | 4.30596433577041 |
| 51 | 95.96293061 | 87.2291331666664 | 8.73379744333356 |
| 52 | 90.84689022 | 85.2428106095088 | 5.60407961049117 |
| 53 | 92.28788036 | 85.8966098169434 | 6.39127054305657 |
| 54 | 95.56511274 | 87.8744626366576 | 7.6906501033424 |
| 55 | 93.62452884 | 86.1549423809473 | 7.46958645905273 |
| 56 | 92.63071726 | 85.764767181853 | 6.86595007814692 |
| 57 | 89.50914211 | 85.3766994230275 | 4.13244268697251 |
| 58 | 87.17171779 | 86.6523009930774 | 0.519416796922556 |
| 59 | 86.72624975 | 85.6088712093408 | 1.11737854065915 |
| 60 | 85.63212844 | 86.0502147243915 | -0.418086284391485 |
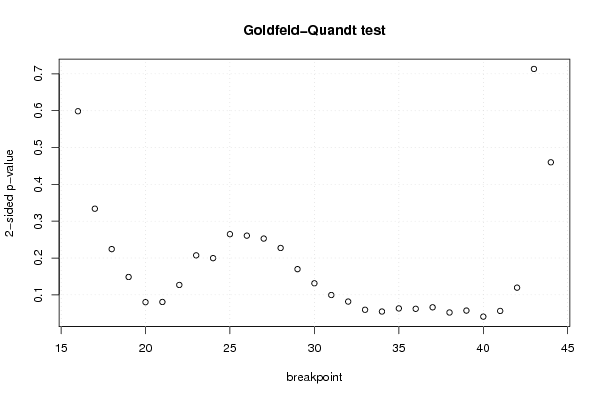
| Goldfeld-Quandt test for Heteroskedasticity | |||
| p-values | Alternative Hypothesis | ||
| breakpoint index | greater | 2-sided | less |
| 16 | 0.299256083453493 | 0.598512166906986 | 0.700743916546507 |
| 17 | 0.166934019272065 | 0.33386803854413 | 0.833065980727935 |
| 18 | 0.112109854681927 | 0.224219709363855 | 0.887890145318073 |
| 19 | 0.0742482319072327 | 0.148496463814465 | 0.925751768092767 |
| 20 | 0.0400677453772614 | 0.0801354907545229 | 0.959932254622739 |
| 21 | 0.0403275150353397 | 0.0806550300706794 | 0.95967248496466 |
| 22 | 0.0634423480827344 | 0.126884696165469 | 0.936557651917266 |
| 23 | 0.103628122100241 | 0.207256244200481 | 0.89637187789976 |
| 24 | 0.099832382228866 | 0.199664764457732 | 0.900167617771134 |
| 25 | 0.132370096520959 | 0.264740193041918 | 0.867629903479041 |
| 26 | 0.130370674531247 | 0.260741349062495 | 0.869629325468753 |
| 27 | 0.126383944245729 | 0.252767888491458 | 0.87361605575427 |
| 28 | 0.113645420936221 | 0.227290841872443 | 0.886354579063779 |
| 29 | 0.0848832715958072 | 0.169766543191614 | 0.915116728404193 |
| 30 | 0.0656749047976685 | 0.131349809595337 | 0.934325095202332 |
| 31 | 0.0497478589669461 | 0.0994957179338922 | 0.950252141033054 |
| 32 | 0.0408747370125671 | 0.0817494740251341 | 0.959125262987433 |
| 33 | 0.0297305842214212 | 0.0594611684428425 | 0.970269415778579 |
| 34 | 0.027343330219844 | 0.054686660439688 | 0.972656669780156 |
| 35 | 0.0315918547454339 | 0.0631837094908678 | 0.968408145254566 |
| 36 | 0.0310441827933885 | 0.0620883655867771 | 0.968955817206612 |
| 37 | 0.0330794754274407 | 0.0661589508548814 | 0.966920524572559 |
| 38 | 0.0260495946022288 | 0.0520991892044575 | 0.973950405397771 |
| 39 | 0.0286397736625877 | 0.0572795473251754 | 0.971360226337412 |
| 40 | 0.0204013637657919 | 0.0408027275315838 | 0.979598636234208 |
| 41 | 0.0281504827951351 | 0.0563009655902702 | 0.971849517204865 |
| 42 | 0.059763857447541 | 0.119527714895082 | 0.94023614255246 |
| 43 | 0.35666480841494 | 0.71332961682988 | 0.64333519158506 |
| 44 | 0.770069239353579 | 0.459861521292842 | 0.229930760646421 |
| Meta Analysis of Goldfeld-Quandt test for Heteroskedasticity | |||
| Description | # significant tests | % significant tests | OK/NOK |
| 1% type I error level | 0 | 0 | OK |
| 5% type I error level | 1 | 0.0344827586206897 | OK |
| 10% type I error level | 13 | 0.448275862068966 | NOK |