| Multiple Linear Regression - Estimated Regression Equation |
| Y[t] = + 4191.72492513178 + 1080.24288788584X[t] + 0.328116813601246Y1[t] + 0.234391904330329Y2[t] + 4298.67549723807M1[t] + 4696.81573343637M2[t] + 3294.52970242339M3[t] + 802.946013604901M4[t] + 1550.95493967962M5[t] + 1874.28478142891M6[t] + 3557.31109805262M7[t] + 2221.62527782109M8[t] + 3900.98112052044M9[t] + 4561.20371537569M10[t] + 1833.90410905446M11[t] + 21.6932594243532t + e[t] |
| Multiple Linear Regression - Ordinary Least Squares | |||||
| Variable | Parameter | S.D. | T-STAT H0: parameter = 0 | 2-tail p-value | 1-tail p-value |
| (Intercept) | 4191.72492513178 | 2236.758638 | 1.874 | 0.068246 | 0.034123 |
| X | 1080.24288788584 | 441.704928 | 2.4456 | 0.018956 | 0.009478 |
| Y1 | 0.328116813601246 | 0.126612 | 2.5915 | 0.013275 | 0.006637 |
| Y2 | 0.234391904330329 | 0.132355 | 1.7709 | 0.084192 | 0.042096 |
| M1 | 4298.67549723807 | 755.421367 | 5.6904 | 1e-06 | 1e-06 |
| M2 | 4696.81573343637 | 799.379855 | 5.8756 | 1e-06 | 0 |
| M3 | 3294.52970242339 | 790.282701 | 4.1688 | 0.000159 | 8e-05 |
| M4 | 802.946013604901 | 841.078294 | 0.9547 | 0.345482 | 0.172741 |
| M5 | 1550.95493967962 | 734.097018 | 2.1127 | 0.040913 | 0.020456 |
| M6 | 1874.28478142891 | 756.645511 | 2.4771 | 0.01757 | 0.008785 |
| M7 | 3557.31109805262 | 792.723135 | 4.4875 | 6e-05 | 3e-05 |
| M8 | 2221.62527782109 | 735.701324 | 3.0197 | 0.004392 | 0.002196 |
| M9 | 3900.98112052044 | 814.087469 | 4.7918 | 2.3e-05 | 1.1e-05 |
| M10 | 4561.20371537569 | 956.807491 | 4.7671 | 2.5e-05 | 1.2e-05 |
| M11 | 1833.90410905446 | 787.703641 | 2.3282 | 0.025045 | 0.012523 |
| t | 21.6932594243532 | 10.276002 | 2.1111 | 0.041065 | 0.020533 |
| Multiple Linear Regression - Regression Statistics | |
| Multiple R | 0.896380203979196 |
| R-squared | 0.803497470085785 |
| Adjusted R-squared | 0.729809021367954 |
| F-TEST (value) | 10.9039813439764 |
| F-TEST (DF numerator) | 15 |
| F-TEST (DF denominator) | 40 |
| p-value | 8.79917361196192e-10 |
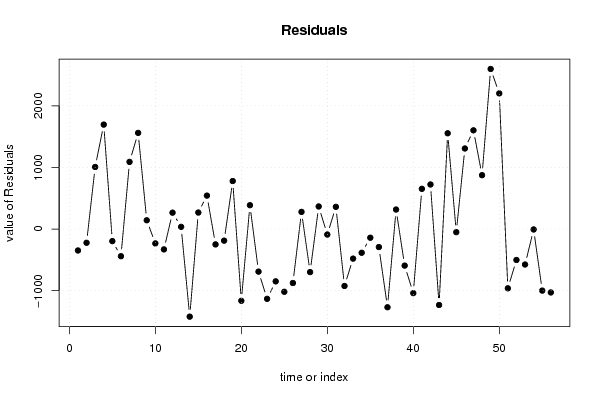
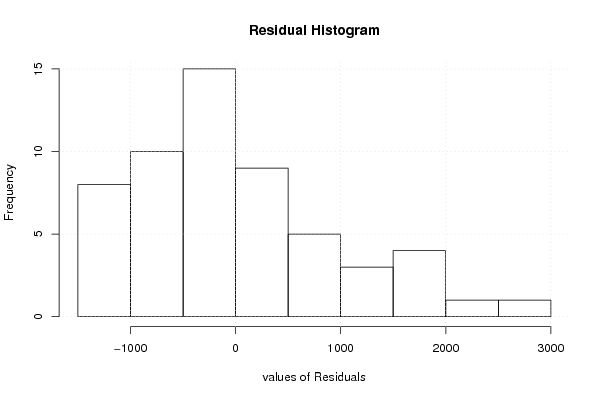
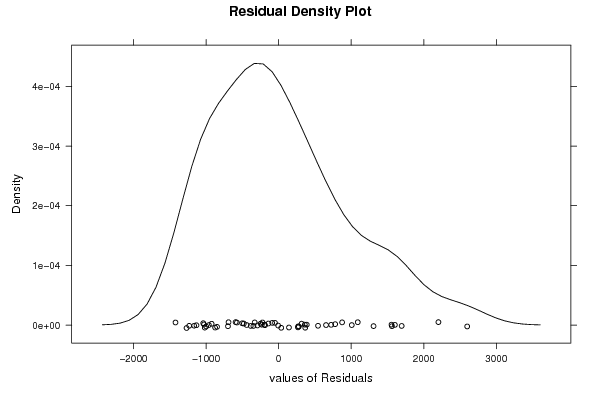
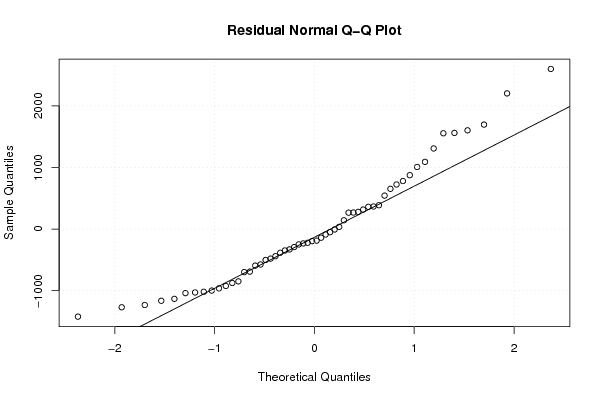
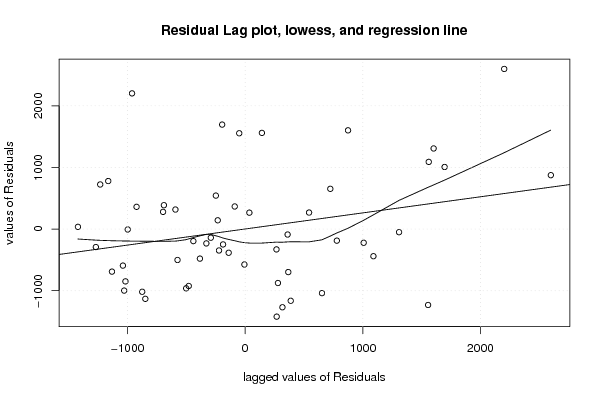
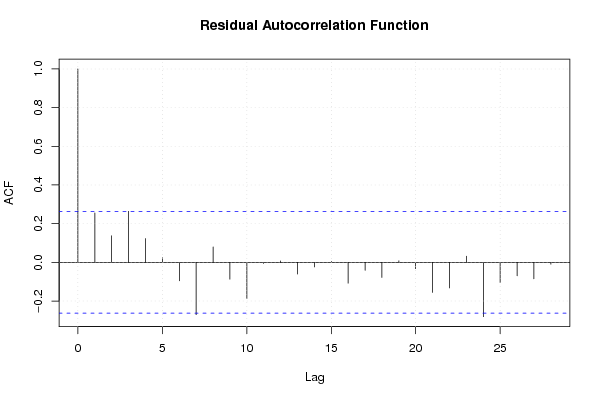
| Multiple Linear Regression - Residual Statistics | |
| Residual Standard Deviation | 1089.29160730302 |
| Sum Squared Residuals | 47462248.2296315 |
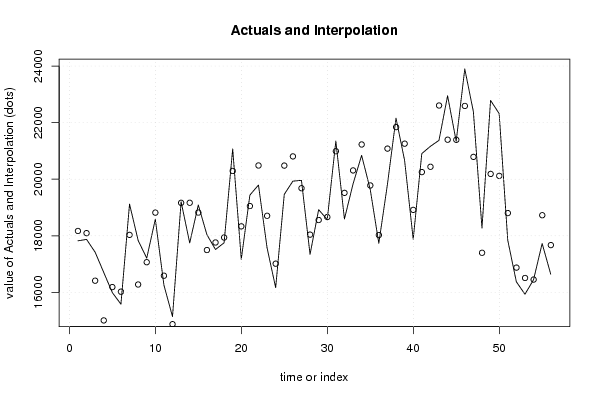
| Multiple Linear Regression - Actuals, Interpolation, and Residuals | |||
| Time or Index | Actuals | Interpolation Forecast | Residuals Prediction Error |
| 1 | 17823.2 | 18170.7019721751 | -347.501972175150 |
| 2 | 17872 | 18094.2848937726 | -222.28489377263 |
| 3 | 17420.4 | 16412.7834027918 | 1007.61659720824 |
| 4 | 16704.4 | 15008.8555416596 | 1695.54445834037 |
| 5 | 15991.2 | 16186.7171471828 | -195.517147182758 |
| 6 | 15583.6 | 16024.1096188735 | -440.509618873523 |
| 7 | 19123.5 | 18033.1760335368 | 1090.32396646321 |
| 8 | 17838.7 | 16277.9773753938 | 1560.72262460623 |
| 9 | 17209.4 | 17066.9259450889 | 142.474054911056 |
| 10 | 18586.5 | 18819.4615598116 | -232.961559811590 |
| 11 | 16258.1 | 16587.9967065700 | -329.896706570037 |
| 12 | 15141.6 | 14875.4627517513 | 266.137248248658 |
| 13 | 19202.1 | 19166.3034401534 | 35.7965598465856 |
| 14 | 17746.5 | 19167.8766108322 | -1421.37661083215 |
| 15 | 19090.1 | 18822.0518587908 | 268.048141209216 |
| 16 | 18040.3 | 17497.0929276342 | 543.207072365798 |
| 17 | 17515.5 | 17764.6738172551 | -249.173817255067 |
| 18 | 17751.8 | 17939.6670594381 | -187.867059438056 |
| 19 | 21072.4 | 20293.1158363245 | 779.284163675518 |
| 20 | 17170 | 18333.9599696669 | -1163.95996966691 |
| 21 | 19439.5 | 19052.0611994542 | 387.438800545839 |
| 22 | 19795.4 | 20486.1246560134 | -690.724656013393 |
| 23 | 17574.9 | 18707.2186902417 | -1132.31869024171 |
| 24 | 16165.4 | 17014.1342551618 | -848.734255161838 |
| 25 | 19464.6 | 20482.3796215949 | -1017.77962159494 |
| 26 | 19932.1 | 20807.3090490025 | -875.209049002504 |
| 27 | 19961.2 | 19682.3693033375 | 278.830696662542 |
| 28 | 17343.4 | 18041.4346012011 | -698.034601201134 |
| 29 | 18924.2 | 18557.6359707883 | 366.564029211665 |
| 30 | 18574.1 | 18662.7195404591 | -88.6195404591304 |
| 31 | 21350.6 | 20989.6517485245 | 360.948251475484 |
| 32 | 18594.6 | 19517.8158455323 | -923.215845532318 |
| 33 | 19832.1 | 20311.6133099138 | -479.513309913786 |
| 34 | 20844.4 | 21228.9518268511 | -384.551826851083 |
| 35 | 19640.2 | 19780.3520269675 | -140.152026967454 |
| 36 | 17735.4 | 18027.3540235547 | -291.954023554651 |
| 37 | 19813.6 | 21082.7140610849 | -1269.11406108490 |
| 38 | 22160 | 21843.2193986089 | 316.780601391113 |
| 39 | 20664.3 | 21257.1460356109 | -592.846035610935 |
| 40 | 17877.4 | 18916.6379266726 | -1039.23792667264 |
| 41 | 20906.5 | 20253.3682498338 | 653.131750166216 |
| 42 | 21164.1 | 20440.3640071286 | 723.735992871433 |
| 43 | 21374.4 | 22606.5948396921 | -1232.19483969206 |
| 44 | 22952.3 | 21397.3859399634 | 1554.91406003657 |
| 45 | 21343.5 | 21393.8995455431 | -50.3995455431093 |
| 46 | 23899.3 | 22591.0619573239 | 1308.23804267607 |
| 47 | 22392.9 | 20790.5325762208 | 1602.36742377921 |
| 48 | 18274.1 | 17399.5489695322 | 874.551030467834 |
| 49 | 22786.7 | 20188.1009049916 | 2598.5990950084 |
| 50 | 22321.5 | 20119.4100477838 | 2202.08995221617 |
| 51 | 17842.2 | 18803.8493994691 | -961.649399469068 |
| 52 | 16373.5 | 16874.9790028324 | -501.479002832401 |
| 53 | 15933.8 | 16508.8048149401 | -575.004814940057 |
| 54 | 16446.1 | 16452.8397741007 | -6.73977410072358 |
| 55 | 17729 | 18727.3615419222 | -998.361541922158 |
| 56 | 16643 | 17671.4608694436 | -1028.46086944358 |
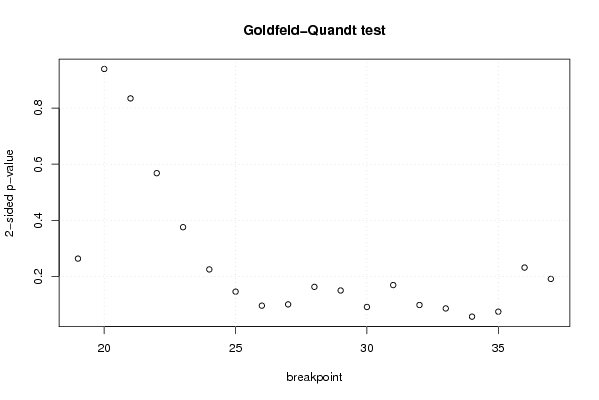
| Goldfeld-Quandt test for Heteroskedasticity | |||
| p-values | Alternative Hypothesis | ||
| breakpoint index | greater | 2-sided | less |
| 19 | 0.131981202616841 | 0.263962405233681 | 0.86801879738316 |
| 20 | 0.469700458369108 | 0.939400916738215 | 0.530299541630892 |
| 21 | 0.417270927127853 | 0.834541854255705 | 0.582729072872147 |
| 22 | 0.284124388918874 | 0.568248777837749 | 0.715875611081126 |
| 23 | 0.187941646677064 | 0.375883293354129 | 0.812058353322936 |
| 24 | 0.112716885645726 | 0.225433771291452 | 0.887283114354274 |
| 25 | 0.073101269463748 | 0.146202538927496 | 0.926898730536252 |
| 26 | 0.0481855877627475 | 0.096371175525495 | 0.951814412237252 |
| 27 | 0.0504713410483262 | 0.100942682096652 | 0.949528658951674 |
| 28 | 0.0816475237624091 | 0.163295047524818 | 0.91835247623759 |
| 29 | 0.075181087839783 | 0.150362175679566 | 0.924818912160217 |
| 30 | 0.045861495020572 | 0.091722990041144 | 0.954138504979428 |
| 31 | 0.0848556718616897 | 0.169711343723379 | 0.91514432813831 |
| 32 | 0.0493300321116367 | 0.0986600642232734 | 0.950669967888363 |
| 33 | 0.0432099818321633 | 0.0864199636643266 | 0.956790018167837 |
| 34 | 0.0285951430887788 | 0.0571902861775576 | 0.971404856911221 |
| 35 | 0.0374459355431966 | 0.0748918710863932 | 0.962554064456803 |
| 36 | 0.116009014605537 | 0.232018029211073 | 0.883990985394463 |
| 37 | 0.0957659415761587 | 0.191531883152317 | 0.904234058423841 |
| Meta Analysis of Goldfeld-Quandt test for Heteroskedasticity | |||
| Description | # significant tests | % significant tests | OK/NOK |
| 1% type I error level | 0 | 0 | OK |
| 5% type I error level | 0 | 0 | OK |
| 10% type I error level | 6 | 0.315789473684211 | NOK |