| Multiple Linear Regression - Estimated Regression Equation |
| Y[t] = + 4.88934846981025e-12 + 7.54095672100258e-13X[t] + 5.89452335056694e-17Y1[t] -5.19911810519848e-18Y2[t] + 7.23450188145874e-17Y3[t] + 1Y4[t] -2.47347489855512e-13M1[t] -1.06407924251432e-13M2[t] + 1.19730754770158e-13M3[t] + 7.40872695144451e-14M4[t] + 5.23513810176632e-14M5[t] + 5.12335671204148e-13M6[t] -7.44193189893327e-14M7[t] + 4.59862984090301e-14M8[t] -9.82041088642529e-14M9[t] + 9.79441811880588e-14M10[t] + 1.43878098602646e-13M11[t] -2.43459853066557e-15t + e[t] |
| Multiple Linear Regression - Ordinary Least Squares | |||||
| Variable | Parameter | S.D. | T-STAT H0: parameter = 0 | 2-tail p-value | 1-tail p-value |
| (Intercept) | 4.88934846981025e-12 | 0 | 5.1169 | 9e-06 | 5e-06 |
| X | 7.54095672100258e-13 | 0 | 4.0363 | 0.000254 | 0.000127 |
| Y1 | 5.89452335056694e-17 | 0 | 1.0808 | 0.286591 | 0.143295 |
| Y2 | -5.19911810519848e-18 | 0 | -0.0946 | 0.92511 | 0.462555 |
| Y3 | 7.23450188145874e-17 | 0 | 1.2861 | 0.206187 | 0.103093 |
| Y4 | 1 | 0 | 16264333519181920 | 0 | 0 |
| M1 | -2.47347489855512e-13 | 0 | -0.6336 | 0.530144 | 0.265072 |
| M2 | -1.06407924251432e-13 | 0 | -0.2536 | 0.801164 | 0.400582 |
| M3 | 1.19730754770158e-13 | 0 | 0.3101 | 0.758194 | 0.379097 |
| M4 | 7.40872695144451e-14 | 0 | 0.2141 | 0.831618 | 0.415809 |
| M5 | 5.23513810176632e-14 | 0 | 0.1631 | 0.871327 | 0.435663 |
| M6 | 5.12335671204148e-13 | 0 | 1.6379 | 0.109696 | 0.054848 |
| M7 | -7.44193189893327e-14 | 0 | -0.1917 | 0.84899 | 0.424495 |
| M8 | 4.59862984090301e-14 | 0 | 0.142 | 0.887795 | 0.443897 |
| M9 | -9.82041088642529e-14 | 0 | -0.2473 | 0.806032 | 0.403016 |
| M10 | 9.79441811880588e-14 | 0 | 0.2105 | 0.834417 | 0.417208 |
| M11 | 1.43878098602646e-13 | 0 | 0.3633 | 0.718373 | 0.359187 |
| t | -2.43459853066557e-15 | 0 | -0.5824 | 0.563708 | 0.281854 |
| Multiple Linear Regression - Regression Statistics | |
| Multiple R | 1 |
| R-squared | 1 |
| Adjusted R-squared | 1 |
| F-TEST (value) | 8.12571273763163e+31 |
| F-TEST (DF numerator) | 17 |
| F-TEST (DF denominator) | 38 |
| p-value | 0 |
| Multiple Linear Regression - Residual Statistics | |
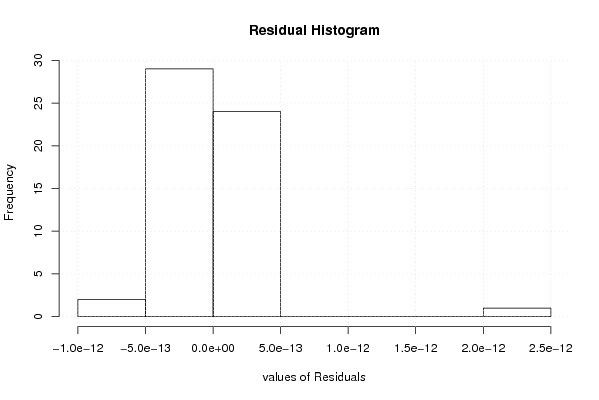
| Residual Standard Deviation | 4.18152682260458e-13 |
| Sum Squared Residuals | 6.64436329590139e-24 |
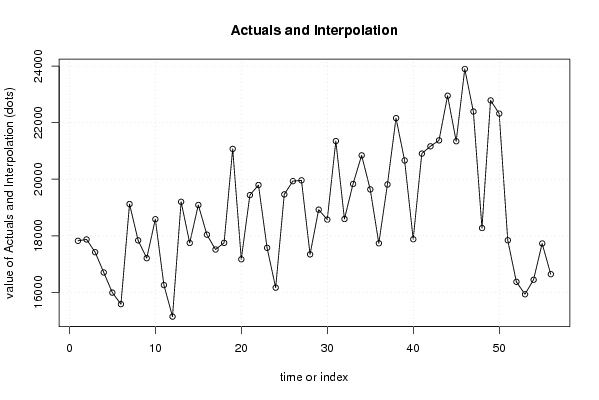
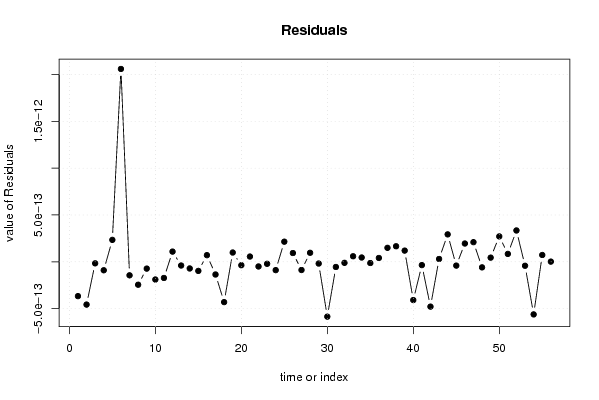
| Multiple Linear Regression - Actuals, Interpolation, and Residuals | |||
| Time or Index | Actuals | Interpolation Forecast | Residuals Prediction Error |
| 1 | 17823.2 | 17823.2 | -3.67018952466713e-13 |
| 2 | 17872 | 17872 | -4.57391462229046e-13 |
| 3 | 17420.4 | 17420.4 | -1.69647770791118e-14 |
| 4 | 16704.4 | 16704.4 | -9.09481449401162e-14 |
| 5 | 15991.2 | 15991.2 | 2.33737753663677e-13 |
| 6 | 15583.6 | 15583.6 | 2.05969235700141e-12 |
| 7 | 19123.5 | 19123.5 | -1.44807371158764e-13 |
| 8 | 17838.7 | 17838.7 | -2.45359422998784e-13 |
| 9 | 17209.4 | 17209.4 | -7.3170006909563e-14 |
| 10 | 18586.5 | 18586.5 | -1.89759625337287e-13 |
| 11 | 16258.1 | 16258.1 | -1.73290317380873e-13 |
| 12 | 15141.6 | 15141.6 | 1.08691326034104e-13 |
| 13 | 19202.1 | 19202.1 | -4.0209157050117e-14 |
| 14 | 17746.5 | 17746.5 | -7.16537175641853e-14 |
| 15 | 19090.1 | 19090.1 | -9.76050312272106e-14 |
| 16 | 18040.3 | 18040.3 | 7.04556629096791e-14 |
| 17 | 17515.5 | 17515.5 | -1.36186474046221e-13 |
| 18 | 17751.8 | 17751.8 | -4.31164222847385e-13 |
| 19 | 21072.4 | 21072.4 | 9.855876164226e-14 |
| 20 | 17170 | 17170 | -3.71167593526792e-14 |
| 21 | 19439.5 | 19439.5 | 5.5550341468931e-14 |
| 22 | 19795.4 | 19795.4 | -5.03337253333034e-14 |
| 23 | 17574.9 | 17574.9 | -2.19688028426882e-14 |
| 24 | 16165.4 | 16165.4 | -8.93959991443743e-14 |
| 25 | 19464.6 | 19464.6 | 2.14367754896176e-13 |
| 26 | 19932.1 | 19932.1 | 9.30485829123688e-14 |
| 27 | 19961.2 | 19961.2 | -8.8288170916896e-14 |
| 28 | 17343.4 | 17343.4 | 9.58671978619318e-14 |
| 29 | 18924.2 | 18924.2 | -1.91907624128368e-14 |
| 30 | 18574.1 | 18574.1 | -5.8649673863785e-13 |
| 31 | 21350.6 | 21350.6 | -5.58468562577815e-14 |
| 32 | 18594.6 | 18594.6 | -1.14527703917304e-14 |
| 33 | 19832.1 | 19832.1 | 5.86270295895207e-14 |
| 34 | 20844.4 | 20844.4 | 4.53372077941681e-14 |
| 35 | 19640.2 | 19640.2 | -1.39011245268788e-14 |
| 36 | 17735.4 | 17735.4 | 4.06478394707514e-14 |
| 37 | 19813.6 | 19813.6 | 1.48813243404959e-13 |
| 38 | 22160 | 22160 | 1.65335020382457e-13 |
| 39 | 20664.3 | 20664.3 | 1.19235486681975e-13 |
| 40 | 17877.4 | 17877.4 | -4.09407028363932e-13 |
| 41 | 20906.5 | 20906.5 | -3.5656985677866e-14 |
| 42 | 21164.1 | 21164.1 | -4.79334517699598e-13 |
| 43 | 21374.4 | 21374.4 | 2.97586362846766e-14 |
| 44 | 22952.3 | 22952.3 | 2.92413854474106e-13 |
| 45 | 21343.5 | 21343.5 | -4.10073641488889e-14 |
| 46 | 23899.3 | 23899.3 | 1.94756142876422e-13 |
| 47 | 22392.9 | 22392.9 | 2.0916024475044e-13 |
| 48 | 18274.1 | 18274.1 | -5.99431663604823e-14 |
| 49 | 22786.7 | 22786.7 | 4.40471112156948e-14 |
| 50 | 22321.5 | 22321.5 | 2.70661576498405e-13 |
| 51 | 17842.2 | 17842.2 | 8.36224925412433e-14 |
| 52 | 16373.5 | 16373.5 | 3.34032312532437e-13 |
| 53 | 15933.8 | 15933.8 | -4.27035315267524e-14 |
| 54 | 16446.1 | 16446.1 | -5.62696877816572e-13 |
| 55 | 17729 | 17729 | 7.23368294896094e-14 |
| 56 | 16643 | 16643 | 1.51509826908715e-15 |
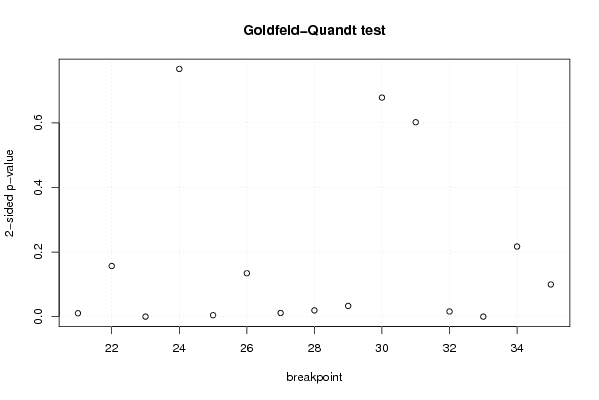
| Goldfeld-Quandt test for Heteroskedasticity | |||
| p-values | Alternative Hypothesis | ||
| breakpoint index | greater | 2-sided | less |
| 21 | 0.00527273283627768 | 0.0105454656725554 | 0.994727267163722 |
| 22 | 0.0783612813423827 | 0.156722562684765 | 0.921638718657617 |
| 23 | 7.98105752278923e-06 | 1.59621150455785e-05 | 0.999992018942477 |
| 24 | 0.616763579888124 | 0.766472840223752 | 0.383236420111876 |
| 25 | 0.997772387467038 | 0.0044552250659248 | 0.0022276125329624 |
| 26 | 0.932834492241967 | 0.134331015516067 | 0.0671655077580334 |
| 27 | 0.00567300907431758 | 0.0113460181486352 | 0.994326990925682 |
| 28 | 0.00969453873348495 | 0.0193890774669699 | 0.990305461266515 |
| 29 | 0.0166303546391404 | 0.0332607092782807 | 0.98336964536086 |
| 30 | 0.338965085387613 | 0.677930170775226 | 0.661034914612387 |
| 31 | 0.300792779708804 | 0.601585559417607 | 0.699207220291196 |
| 32 | 0.00796412549771207 | 0.0159282509954241 | 0.992035874502288 |
| 33 | 1 | 0 | 0 |
| 34 | 0.89151036058287 | 0.216979278834260 | 0.108489639417130 |
| 35 | 0.0498253186813648 | 0.0996506373627297 | 0.950174681318635 |
| Meta Analysis of Goldfeld-Quandt test for Heteroskedasticity | |||
| Description | # significant tests | % significant tests | OK/NOK |
| 1% type I error level | 3 | 0.2 | NOK |
| 5% type I error level | 8 | 0.533333333333333 | NOK |
| 10% type I error level | 9 | 0.6 | NOK |