Free Statistics

of Irreproducible Research!

Author's title

Author*Unverified author*
R Software Modulerwasp_multipleregression.wasp
Title produced by softwareMultiple Regression
Date of computationFri, 20 Nov 2009 09:21:07 -0700
Cite this page as followsStatistical Computations at FreeStatistics.org, Office for Research Development and Education, URL https://freestatistics.org/blog/index.php?v=date/2009/Nov/20/t1258734129u0daw50b0bb5fdl.htm/, Retrieved Sat, 20 Apr 2024 12:27:22 +0000
Statistical Computations at FreeStatistics.org, Office for Research Development and Education, URL https://freestatistics.org/blog/index.php?pk=58306, Retrieved Sat, 20 Apr 2024 12:27:22 +0000
QR Codes:

Original text written by user:
IsPrivate?No (this computation is public)
User-defined keywords
Estimated Impact138
Family? (F = Feedback message, R = changed R code, M = changed R Module, P = changed Parameters, D = changed Data)
-     [Multiple Regression] [Q1 The Seatbeltlaw] [2007-11-14 19:27:43] [8cd6641b921d30ebe00b648d1481bba0]
- RMPD  [Multiple Regression] [Seatbelt] [2009-11-12 13:54:52] [b98453cac15ba1066b407e146608df68]
F R PD      [Multiple Regression] [] [2009-11-20 16:21:07] [e76c6d261190c0179bc6006a5cdb804c] [Current]
-    D        [Multiple Regression] [] [2009-11-26 15:09:05] [58e1a7a2c10f1de09acf218271f55dfd]
Feedback Forum
2009-11-26 15:23:09 [c299e0eb981e6cab9be2a8b66230858e] [reply
Het maken van de variabelen Y1 tot en met Y4 is niet correct gebeurd. Het is de bedoeling om de endogene variabele te vergelijken met het verleden en niet met de toekomst. In model 4 wordt ervoor gekozen tot 4 perioden terug te gaan. Hierdoor kan men voor berekening met de endogene variabele pas starten bij periode 5. (de correcte tabel is te vinden in de link via reproduce)

http://www.freestatistics.org/blog/index.php?v=date/2009/Nov/26/t125924840984hsfqgyo71myi1.htm/

Post a new message
Dataseries X:
17823,2	0	16704,4	17823,2	17872	17823,2
17872	0	15991,2	16704,4	17420,4	17872
17420,4	0	15583,6	15991,2	16704,4	17420,4
16704,4	0	19123,5	15583,6	15991,2	16704,4
15991,2	0	17838,7	19123,5	15583,6	15991,2
15583,6	0	17209,4	17838,7	19123,5	15583,6
19123,5	0	18586,5	17209,4	17838,7	19123,5
17838,7	0	16258,1	18586,5	17209,4	17838,7
17209,4	0	15141,6	16258,1	18586,5	17209,4
18586,5	0	19202,1	15141,6	16258,1	18586,5
16258,1	0	17746,5	19202,1	15141,6	16258,1
15141,6	0	19090,1	17746,5	19202,1	15141,6
19202,1	0	18040,3	19090,1	17746,5	19202,1
17746,5	0	17515,5	18040,3	19090,1	17746,5
19090,1	1	17751,8	17515,5	18040,3	19090,1
18040,3	1	21072,4	17751,8	17515,5	18040,3
17515,5	1	17170	21072,4	17751,8	17515,5
17751,8	1	19439,5	17170	21072,4	17751,8
21072,4	1	19795,4	19439,5	17170	21072,4
17170	1	17574,9	19795,4	19439,5	17170
19439,5	1	16165,4	17574,9	19795,4	19439,5
19795,4	1	19464,6	16165,4	17574,9	19795,4
17574,9	1	19932,1	19464,6	16165,4	17574,9
16165,4	1	19961,2	19932,1	19464,6	16165,4
19464,6	1	17343,4	19961,2	19932,1	19464,6
19932,1	1	18924,2	17343,4	19961,2	19932,1
19961,2	1	18574,1	18924,2	17343,4	19961,2
17343,4	1	21350,6	18574,1	18924,2	17343,4
18924,2	1	18594,6	21350,6	18574,1	18924,2
18574,1	1	19832,1	18594,6	21350,6	18574,1
21350,6	1	20844,4	19832,1	18594,6	21350,6
18594,6	1	19640,2	20844,4	19832,1	18594,6
19832,1	1	17735,4	19640,2	20844,4	19832,1
20844,4	1	19813,6	17735,4	19640,2	20844,4
19640,2	1	22160	19813,6	17735,4	19640,2
17735,4	1	20664,3	22160	19813,6	17735,4
19813,6	1	17877,4	20664,3	22160	19813,6
22160	1	20906,5	17877,4	20664,3	22160
20664,3	1	21164,1	20906,5	17877,4	20664,3
17877,4	1	21374,4	21164,1	20906,5	17877,4
20906,5	1	22952,3	21374,4	21164,1	20906,5
21164,1	1	21343,5	22952,3	21374,4	21164,1
21374,4	1	23899,3	21343,5	22952,3	21374,4
22952,3	1	22392,9	23899,3	21343,5	22952,3
21343,5	1	18274,1	22392,9	23899,3	21343,5
23899,3	1	22786,7	18274,1	22392,9	23899,3
22392,9	1	22321,5	22786,7	18274,1	22392,9
18274,1	1	17842,2	22321,5	22786,7	18274,1
22786,7	1	16373,5	17842,2	22321,5	22786,7
22321,5	1	15933,8	16373,5	17842,2	22321,5
17842,2	1	16446,1	15933,8	16373,5	17842,2
16373,5	1	17729	16446,1	15933,8	16373,5
15933,8	0	16643	17729	16446,1	15933,8
16446,1	0	16196,7	16643	17729	16446,1
17729	0	18252,1	16196,7	16643	17729
16643	0	17570,4	18252,1	16196,7	16643


Summary of computational transaction
Raw Inputview raw input (R code)
Raw Outputview raw output of R engine
Computing time5 seconds
R Server'Gwilym Jenkins' @ 72.249.127.135

\begin{tabular}{lllllllll}
\hline
Summary of computational transaction \tabularnewline
Raw Input & view raw input (R code)  \tabularnewline
Raw Output & view raw output of R engine  \tabularnewline
Computing time & 5 seconds \tabularnewline
R Server & 'Gwilym Jenkins' @ 72.249.127.135 \tabularnewline
\hline
\end{tabular}
%Source: https://freestatistics.org/blog/index.php?pk=58306&T=0

[TABLE]
[ROW][C]Summary of computational transaction[/C][/ROW]
[ROW][C]Raw Input[/C][C]view raw input (R code) [/C][/ROW]
[ROW][C]Raw Output[/C][C]view raw output of R engine [/C][/ROW]
[ROW][C]Computing time[/C][C]5 seconds[/C][/ROW]
[ROW][C]R Server[/C][C]'Gwilym Jenkins' @ 72.249.127.135[/C][/ROW]
[/TABLE]
Source: https://freestatistics.org/blog/index.php?pk=58306&T=0

Globally Unique Identifier (entire table): ba.freestatistics.org/blog/index.php?pk=58306&T=0

As an alternative you can also use a QR Code:  

The GUIDs for individual cells are displayed in the table below:

Summary of computational transaction
Raw Inputview raw input (R code)
Raw Outputview raw output of R engine
Computing time5 seconds
R Server'Gwilym Jenkins' @ 72.249.127.135


Multiple Linear Regression - Estimated Regression Equation
Y[t] = + 4.88934846981025e-12 + 7.54095672100258e-13X[t] + 5.89452335056694e-17Y1[t] -5.19911810519848e-18Y2[t] + 7.23450188145874e-17Y3[t] + 1Y4[t] -2.47347489855512e-13M1[t] -1.06407924251432e-13M2[t] + 1.19730754770158e-13M3[t] + 7.40872695144451e-14M4[t] + 5.23513810176632e-14M5[t] + 5.12335671204148e-13M6[t] -7.44193189893327e-14M7[t] + 4.59862984090301e-14M8[t] -9.82041088642529e-14M9[t] + 9.79441811880588e-14M10[t] + 1.43878098602646e-13M11[t] -2.43459853066557e-15t + e[t]

\begin{tabular}{lllllllll}
\hline
Multiple Linear Regression - Estimated Regression Equation \tabularnewline
Y[t] =  +  4.88934846981025e-12 +  7.54095672100258e-13X[t] +  5.89452335056694e-17Y1[t] -5.19911810519848e-18Y2[t] +  7.23450188145874e-17Y3[t] +  1Y4[t] -2.47347489855512e-13M1[t] -1.06407924251432e-13M2[t] +  1.19730754770158e-13M3[t] +  7.40872695144451e-14M4[t] +  5.23513810176632e-14M5[t] +  5.12335671204148e-13M6[t] -7.44193189893327e-14M7[t] +  4.59862984090301e-14M8[t] -9.82041088642529e-14M9[t] +  9.79441811880588e-14M10[t] +  1.43878098602646e-13M11[t] -2.43459853066557e-15t  + e[t] \tabularnewline
\hline
\end{tabular}
%Source: https://freestatistics.org/blog/index.php?pk=58306&T=1

[TABLE]
[ROW][C]Multiple Linear Regression - Estimated Regression Equation[/C][/ROW]
[ROW][C]Y[t] =  +  4.88934846981025e-12 +  7.54095672100258e-13X[t] +  5.89452335056694e-17Y1[t] -5.19911810519848e-18Y2[t] +  7.23450188145874e-17Y3[t] +  1Y4[t] -2.47347489855512e-13M1[t] -1.06407924251432e-13M2[t] +  1.19730754770158e-13M3[t] +  7.40872695144451e-14M4[t] +  5.23513810176632e-14M5[t] +  5.12335671204148e-13M6[t] -7.44193189893327e-14M7[t] +  4.59862984090301e-14M8[t] -9.82041088642529e-14M9[t] +  9.79441811880588e-14M10[t] +  1.43878098602646e-13M11[t] -2.43459853066557e-15t  + e[t][/C][/ROW]
[/TABLE]
Source: https://freestatistics.org/blog/index.php?pk=58306&T=1

Globally Unique Identifier (entire table): ba.freestatistics.org/blog/index.php?pk=58306&T=1

As an alternative you can also use a QR Code:  

The GUIDs for individual cells are displayed in the table below:

Multiple Linear Regression - Estimated Regression Equation
Y[t] = + 4.88934846981025e-12 + 7.54095672100258e-13X[t] + 5.89452335056694e-17Y1[t] -5.19911810519848e-18Y2[t] + 7.23450188145874e-17Y3[t] + 1Y4[t] -2.47347489855512e-13M1[t] -1.06407924251432e-13M2[t] + 1.19730754770158e-13M3[t] + 7.40872695144451e-14M4[t] + 5.23513810176632e-14M5[t] + 5.12335671204148e-13M6[t] -7.44193189893327e-14M7[t] + 4.59862984090301e-14M8[t] -9.82041088642529e-14M9[t] + 9.79441811880588e-14M10[t] + 1.43878098602646e-13M11[t] -2.43459853066557e-15t + e[t]


Multiple Linear Regression - Ordinary Least Squares
VariableParameterS.D.T-STATH0: parameter = 02-tail p-value1-tail p-value
(Intercept)4.88934846981025e-1205.11699e-065e-06
X7.54095672100258e-1304.03630.0002540.000127
Y15.89452335056694e-1701.08080.2865910.143295
Y2-5.19911810519848e-180-0.09460.925110.462555
Y37.23450188145874e-1701.28610.2061870.103093
Y4101626433351918192000
M1-2.47347489855512e-130-0.63360.5301440.265072
M2-1.06407924251432e-130-0.25360.8011640.400582
M31.19730754770158e-1300.31010.7581940.379097
M47.40872695144451e-1400.21410.8316180.415809
M55.23513810176632e-1400.16310.8713270.435663
M65.12335671204148e-1301.63790.1096960.054848
M7-7.44193189893327e-140-0.19170.848990.424495
M84.59862984090301e-1400.1420.8877950.443897
M9-9.82041088642529e-140-0.24730.8060320.403016
M109.79441811880588e-1400.21050.8344170.417208
M111.43878098602646e-1300.36330.7183730.359187
t-2.43459853066557e-150-0.58240.5637080.281854

\begin{tabular}{lllllllll}
\hline
Multiple Linear Regression - Ordinary Least Squares \tabularnewline
Variable & Parameter & S.D. & T-STATH0: parameter = 0 & 2-tail p-value & 1-tail p-value \tabularnewline
(Intercept) & 4.88934846981025e-12 & 0 & 5.1169 & 9e-06 & 5e-06 \tabularnewline
X & 7.54095672100258e-13 & 0 & 4.0363 & 0.000254 & 0.000127 \tabularnewline
Y1 & 5.89452335056694e-17 & 0 & 1.0808 & 0.286591 & 0.143295 \tabularnewline
Y2 & -5.19911810519848e-18 & 0 & -0.0946 & 0.92511 & 0.462555 \tabularnewline
Y3 & 7.23450188145874e-17 & 0 & 1.2861 & 0.206187 & 0.103093 \tabularnewline
Y4 & 1 & 0 & 16264333519181920 & 0 & 0 \tabularnewline
M1 & -2.47347489855512e-13 & 0 & -0.6336 & 0.530144 & 0.265072 \tabularnewline
M2 & -1.06407924251432e-13 & 0 & -0.2536 & 0.801164 & 0.400582 \tabularnewline
M3 & 1.19730754770158e-13 & 0 & 0.3101 & 0.758194 & 0.379097 \tabularnewline
M4 & 7.40872695144451e-14 & 0 & 0.2141 & 0.831618 & 0.415809 \tabularnewline
M5 & 5.23513810176632e-14 & 0 & 0.1631 & 0.871327 & 0.435663 \tabularnewline
M6 & 5.12335671204148e-13 & 0 & 1.6379 & 0.109696 & 0.054848 \tabularnewline
M7 & -7.44193189893327e-14 & 0 & -0.1917 & 0.84899 & 0.424495 \tabularnewline
M8 & 4.59862984090301e-14 & 0 & 0.142 & 0.887795 & 0.443897 \tabularnewline
M9 & -9.82041088642529e-14 & 0 & -0.2473 & 0.806032 & 0.403016 \tabularnewline
M10 & 9.79441811880588e-14 & 0 & 0.2105 & 0.834417 & 0.417208 \tabularnewline
M11 & 1.43878098602646e-13 & 0 & 0.3633 & 0.718373 & 0.359187 \tabularnewline
t & -2.43459853066557e-15 & 0 & -0.5824 & 0.563708 & 0.281854 \tabularnewline
\hline
\end{tabular}
%Source: https://freestatistics.org/blog/index.php?pk=58306&T=2

[TABLE]
[ROW][C]Multiple Linear Regression - Ordinary Least Squares[/C][/ROW]
[ROW][C]Variable[/C][C]Parameter[/C][C]S.D.[/C][C]T-STATH0: parameter = 0[/C][C]2-tail p-value[/C][C]1-tail p-value[/C][/ROW]
[ROW][C](Intercept)[/C][C]4.88934846981025e-12[/C][C]0[/C][C]5.1169[/C][C]9e-06[/C][C]5e-06[/C][/ROW]
[ROW][C]X[/C][C]7.54095672100258e-13[/C][C]0[/C][C]4.0363[/C][C]0.000254[/C][C]0.000127[/C][/ROW]
[ROW][C]Y1[/C][C]5.89452335056694e-17[/C][C]0[/C][C]1.0808[/C][C]0.286591[/C][C]0.143295[/C][/ROW]
[ROW][C]Y2[/C][C]-5.19911810519848e-18[/C][C]0[/C][C]-0.0946[/C][C]0.92511[/C][C]0.462555[/C][/ROW]
[ROW][C]Y3[/C][C]7.23450188145874e-17[/C][C]0[/C][C]1.2861[/C][C]0.206187[/C][C]0.103093[/C][/ROW]
[ROW][C]Y4[/C][C]1[/C][C]0[/C][C]16264333519181920[/C][C]0[/C][C]0[/C][/ROW]
[ROW][C]M1[/C][C]-2.47347489855512e-13[/C][C]0[/C][C]-0.6336[/C][C]0.530144[/C][C]0.265072[/C][/ROW]
[ROW][C]M2[/C][C]-1.06407924251432e-13[/C][C]0[/C][C]-0.2536[/C][C]0.801164[/C][C]0.400582[/C][/ROW]
[ROW][C]M3[/C][C]1.19730754770158e-13[/C][C]0[/C][C]0.3101[/C][C]0.758194[/C][C]0.379097[/C][/ROW]
[ROW][C]M4[/C][C]7.40872695144451e-14[/C][C]0[/C][C]0.2141[/C][C]0.831618[/C][C]0.415809[/C][/ROW]
[ROW][C]M5[/C][C]5.23513810176632e-14[/C][C]0[/C][C]0.1631[/C][C]0.871327[/C][C]0.435663[/C][/ROW]
[ROW][C]M6[/C][C]5.12335671204148e-13[/C][C]0[/C][C]1.6379[/C][C]0.109696[/C][C]0.054848[/C][/ROW]
[ROW][C]M7[/C][C]-7.44193189893327e-14[/C][C]0[/C][C]-0.1917[/C][C]0.84899[/C][C]0.424495[/C][/ROW]
[ROW][C]M8[/C][C]4.59862984090301e-14[/C][C]0[/C][C]0.142[/C][C]0.887795[/C][C]0.443897[/C][/ROW]
[ROW][C]M9[/C][C]-9.82041088642529e-14[/C][C]0[/C][C]-0.2473[/C][C]0.806032[/C][C]0.403016[/C][/ROW]
[ROW][C]M10[/C][C]9.79441811880588e-14[/C][C]0[/C][C]0.2105[/C][C]0.834417[/C][C]0.417208[/C][/ROW]
[ROW][C]M11[/C][C]1.43878098602646e-13[/C][C]0[/C][C]0.3633[/C][C]0.718373[/C][C]0.359187[/C][/ROW]
[ROW][C]t[/C][C]-2.43459853066557e-15[/C][C]0[/C][C]-0.5824[/C][C]0.563708[/C][C]0.281854[/C][/ROW]
[/TABLE]
Source: https://freestatistics.org/blog/index.php?pk=58306&T=2

Globally Unique Identifier (entire table): ba.freestatistics.org/blog/index.php?pk=58306&T=2

As an alternative you can also use a QR Code:  

The GUIDs for individual cells are displayed in the table below:

Multiple Linear Regression - Ordinary Least Squares
VariableParameterS.D.T-STATH0: parameter = 02-tail p-value1-tail p-value
(Intercept)4.88934846981025e-1205.11699e-065e-06
X7.54095672100258e-1304.03630.0002540.000127
Y15.89452335056694e-1701.08080.2865910.143295
Y2-5.19911810519848e-180-0.09460.925110.462555
Y37.23450188145874e-1701.28610.2061870.103093
Y4101626433351918192000
M1-2.47347489855512e-130-0.63360.5301440.265072
M2-1.06407924251432e-130-0.25360.8011640.400582
M31.19730754770158e-1300.31010.7581940.379097
M47.40872695144451e-1400.21410.8316180.415809
M55.23513810176632e-1400.16310.8713270.435663
M65.12335671204148e-1301.63790.1096960.054848
M7-7.44193189893327e-140-0.19170.848990.424495
M84.59862984090301e-1400.1420.8877950.443897
M9-9.82041088642529e-140-0.24730.8060320.403016
M109.79441811880588e-1400.21050.8344170.417208
M111.43878098602646e-1300.36330.7183730.359187
t-2.43459853066557e-150-0.58240.5637080.281854


Multiple Linear Regression - Regression Statistics
Multiple R1
R-squared1
Adjusted R-squared1
F-TEST (value)8.12571273763163e+31
F-TEST (DF numerator)17
F-TEST (DF denominator)38
p-value0
Multiple Linear Regression - Residual Statistics
Residual Standard Deviation4.18152682260458e-13
Sum Squared Residuals6.64436329590139e-24

\begin{tabular}{lllllllll}
\hline
Multiple Linear Regression - Regression Statistics \tabularnewline
Multiple R & 1 \tabularnewline
R-squared & 1 \tabularnewline
Adjusted R-squared & 1 \tabularnewline
F-TEST (value) & 8.12571273763163e+31 \tabularnewline
F-TEST (DF numerator) & 17 \tabularnewline
F-TEST (DF denominator) & 38 \tabularnewline
p-value & 0 \tabularnewline
Multiple Linear Regression - Residual Statistics \tabularnewline
Residual Standard Deviation & 4.18152682260458e-13 \tabularnewline
Sum Squared Residuals & 6.64436329590139e-24 \tabularnewline
\hline
\end{tabular}
%Source: https://freestatistics.org/blog/index.php?pk=58306&T=3

[TABLE]
[ROW][C]Multiple Linear Regression - Regression Statistics[/C][/ROW]
[ROW][C]Multiple R[/C][C]1[/C][/ROW]
[ROW][C]R-squared[/C][C]1[/C][/ROW]
[ROW][C]Adjusted R-squared[/C][C]1[/C][/ROW]
[ROW][C]F-TEST (value)[/C][C]8.12571273763163e+31[/C][/ROW]
[ROW][C]F-TEST (DF numerator)[/C][C]17[/C][/ROW]
[ROW][C]F-TEST (DF denominator)[/C][C]38[/C][/ROW]
[ROW][C]p-value[/C][C]0[/C][/ROW]
[ROW][C]Multiple Linear Regression - Residual Statistics[/C][/ROW]
[ROW][C]Residual Standard Deviation[/C][C]4.18152682260458e-13[/C][/ROW]
[ROW][C]Sum Squared Residuals[/C][C]6.64436329590139e-24[/C][/ROW]
[/TABLE]
Source: https://freestatistics.org/blog/index.php?pk=58306&T=3

Globally Unique Identifier (entire table): ba.freestatistics.org/blog/index.php?pk=58306&T=3

As an alternative you can also use a QR Code:  

The GUIDs for individual cells are displayed in the table below:

Multiple Linear Regression - Regression Statistics
Multiple R1
R-squared1
Adjusted R-squared1
F-TEST (value)8.12571273763163e+31
F-TEST (DF numerator)17
F-TEST (DF denominator)38
p-value0
Multiple Linear Regression - Residual Statistics
Residual Standard Deviation4.18152682260458e-13
Sum Squared Residuals6.64436329590139e-24


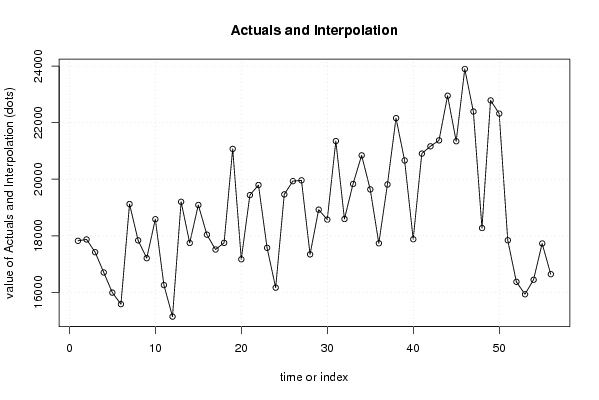
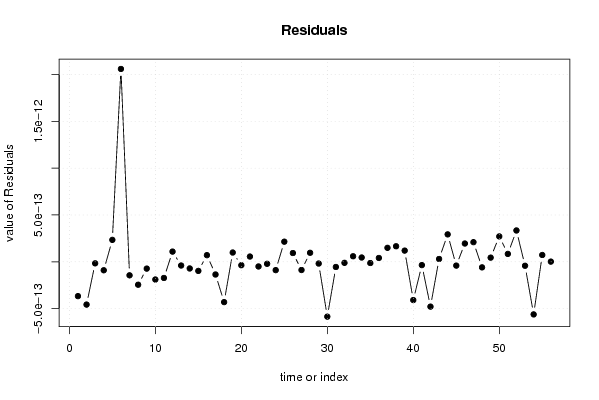
Multiple Linear Regression - Actuals, Interpolation, and Residuals
Time or IndexActualsInterpolationForecastResidualsPrediction Error
117823.217823.2-3.67018952466713e-13
21787217872-4.57391462229046e-13
317420.417420.4-1.69647770791118e-14
416704.416704.4-9.09481449401162e-14
515991.215991.22.33737753663677e-13
615583.615583.62.05969235700141e-12
719123.519123.5-1.44807371158764e-13
817838.717838.7-2.45359422998784e-13
917209.417209.4-7.3170006909563e-14
1018586.518586.5-1.89759625337287e-13
1116258.116258.1-1.73290317380873e-13
1215141.615141.61.08691326034104e-13
1319202.119202.1-4.0209157050117e-14
1417746.517746.5-7.16537175641853e-14
1519090.119090.1-9.76050312272106e-14
1618040.318040.37.04556629096791e-14
1717515.517515.5-1.36186474046221e-13
1817751.817751.8-4.31164222847385e-13
1921072.421072.49.855876164226e-14
201717017170-3.71167593526792e-14
2119439.519439.55.5550341468931e-14
2219795.419795.4-5.03337253333034e-14
2317574.917574.9-2.19688028426882e-14
2416165.416165.4-8.93959991443743e-14
2519464.619464.62.14367754896176e-13
2619932.119932.19.30485829123688e-14
2719961.219961.2-8.8288170916896e-14
2817343.417343.49.58671978619318e-14
2918924.218924.2-1.91907624128368e-14
3018574.118574.1-5.8649673863785e-13
3121350.621350.6-5.58468562577815e-14
3218594.618594.6-1.14527703917304e-14
3319832.119832.15.86270295895207e-14
3420844.420844.44.53372077941681e-14
3519640.219640.2-1.39011245268788e-14
3617735.417735.44.06478394707514e-14
3719813.619813.61.48813243404959e-13
3822160221601.65335020382457e-13
3920664.320664.31.19235486681975e-13
4017877.417877.4-4.09407028363932e-13
4120906.520906.5-3.5656985677866e-14
4221164.121164.1-4.79334517699598e-13
4321374.421374.42.97586362846766e-14
4422952.322952.32.92413854474106e-13
4521343.521343.5-4.10073641488889e-14
4623899.323899.31.94756142876422e-13
4722392.922392.92.0916024475044e-13
4818274.118274.1-5.99431663604823e-14
4922786.722786.74.40471112156948e-14
5022321.522321.52.70661576498405e-13
5117842.217842.28.36224925412433e-14
5216373.516373.53.34032312532437e-13
5315933.815933.8-4.27035315267524e-14
5416446.116446.1-5.62696877816572e-13
5517729177297.23368294896094e-14
5616643166431.51509826908715e-15

\begin{tabular}{lllllllll}
\hline
Multiple Linear Regression - Actuals, Interpolation, and Residuals \tabularnewline
Time or Index & Actuals & InterpolationForecast & ResidualsPrediction Error \tabularnewline
1 & 17823.2 & 17823.2 & -3.67018952466713e-13 \tabularnewline
2 & 17872 & 17872 & -4.57391462229046e-13 \tabularnewline
3 & 17420.4 & 17420.4 & -1.69647770791118e-14 \tabularnewline
4 & 16704.4 & 16704.4 & -9.09481449401162e-14 \tabularnewline
5 & 15991.2 & 15991.2 & 2.33737753663677e-13 \tabularnewline
6 & 15583.6 & 15583.6 & 2.05969235700141e-12 \tabularnewline
7 & 19123.5 & 19123.5 & -1.44807371158764e-13 \tabularnewline
8 & 17838.7 & 17838.7 & -2.45359422998784e-13 \tabularnewline
9 & 17209.4 & 17209.4 & -7.3170006909563e-14 \tabularnewline
10 & 18586.5 & 18586.5 & -1.89759625337287e-13 \tabularnewline
11 & 16258.1 & 16258.1 & -1.73290317380873e-13 \tabularnewline
12 & 15141.6 & 15141.6 & 1.08691326034104e-13 \tabularnewline
13 & 19202.1 & 19202.1 & -4.0209157050117e-14 \tabularnewline
14 & 17746.5 & 17746.5 & -7.16537175641853e-14 \tabularnewline
15 & 19090.1 & 19090.1 & -9.76050312272106e-14 \tabularnewline
16 & 18040.3 & 18040.3 & 7.04556629096791e-14 \tabularnewline
17 & 17515.5 & 17515.5 & -1.36186474046221e-13 \tabularnewline
18 & 17751.8 & 17751.8 & -4.31164222847385e-13 \tabularnewline
19 & 21072.4 & 21072.4 & 9.855876164226e-14 \tabularnewline
20 & 17170 & 17170 & -3.71167593526792e-14 \tabularnewline
21 & 19439.5 & 19439.5 & 5.5550341468931e-14 \tabularnewline
22 & 19795.4 & 19795.4 & -5.03337253333034e-14 \tabularnewline
23 & 17574.9 & 17574.9 & -2.19688028426882e-14 \tabularnewline
24 & 16165.4 & 16165.4 & -8.93959991443743e-14 \tabularnewline
25 & 19464.6 & 19464.6 & 2.14367754896176e-13 \tabularnewline
26 & 19932.1 & 19932.1 & 9.30485829123688e-14 \tabularnewline
27 & 19961.2 & 19961.2 & -8.8288170916896e-14 \tabularnewline
28 & 17343.4 & 17343.4 & 9.58671978619318e-14 \tabularnewline
29 & 18924.2 & 18924.2 & -1.91907624128368e-14 \tabularnewline
30 & 18574.1 & 18574.1 & -5.8649673863785e-13 \tabularnewline
31 & 21350.6 & 21350.6 & -5.58468562577815e-14 \tabularnewline
32 & 18594.6 & 18594.6 & -1.14527703917304e-14 \tabularnewline
33 & 19832.1 & 19832.1 & 5.86270295895207e-14 \tabularnewline
34 & 20844.4 & 20844.4 & 4.53372077941681e-14 \tabularnewline
35 & 19640.2 & 19640.2 & -1.39011245268788e-14 \tabularnewline
36 & 17735.4 & 17735.4 & 4.06478394707514e-14 \tabularnewline
37 & 19813.6 & 19813.6 & 1.48813243404959e-13 \tabularnewline
38 & 22160 & 22160 & 1.65335020382457e-13 \tabularnewline
39 & 20664.3 & 20664.3 & 1.19235486681975e-13 \tabularnewline
40 & 17877.4 & 17877.4 & -4.09407028363932e-13 \tabularnewline
41 & 20906.5 & 20906.5 & -3.5656985677866e-14 \tabularnewline
42 & 21164.1 & 21164.1 & -4.79334517699598e-13 \tabularnewline
43 & 21374.4 & 21374.4 & 2.97586362846766e-14 \tabularnewline
44 & 22952.3 & 22952.3 & 2.92413854474106e-13 \tabularnewline
45 & 21343.5 & 21343.5 & -4.10073641488889e-14 \tabularnewline
46 & 23899.3 & 23899.3 & 1.94756142876422e-13 \tabularnewline
47 & 22392.9 & 22392.9 & 2.0916024475044e-13 \tabularnewline
48 & 18274.1 & 18274.1 & -5.99431663604823e-14 \tabularnewline
49 & 22786.7 & 22786.7 & 4.40471112156948e-14 \tabularnewline
50 & 22321.5 & 22321.5 & 2.70661576498405e-13 \tabularnewline
51 & 17842.2 & 17842.2 & 8.36224925412433e-14 \tabularnewline
52 & 16373.5 & 16373.5 & 3.34032312532437e-13 \tabularnewline
53 & 15933.8 & 15933.8 & -4.27035315267524e-14 \tabularnewline
54 & 16446.1 & 16446.1 & -5.62696877816572e-13 \tabularnewline
55 & 17729 & 17729 & 7.23368294896094e-14 \tabularnewline
56 & 16643 & 16643 & 1.51509826908715e-15 \tabularnewline
\hline
\end{tabular}
%Source: https://freestatistics.org/blog/index.php?pk=58306&T=4

[TABLE]
[ROW][C]Multiple Linear Regression - Actuals, Interpolation, and Residuals[/C][/ROW]
[ROW][C]Time or Index[/C][C]Actuals[/C][C]InterpolationForecast[/C][C]ResidualsPrediction Error[/C][/ROW]
[ROW][C]1[/C][C]17823.2[/C][C]17823.2[/C][C]-3.67018952466713e-13[/C][/ROW]
[ROW][C]2[/C][C]17872[/C][C]17872[/C][C]-4.57391462229046e-13[/C][/ROW]
[ROW][C]3[/C][C]17420.4[/C][C]17420.4[/C][C]-1.69647770791118e-14[/C][/ROW]
[ROW][C]4[/C][C]16704.4[/C][C]16704.4[/C][C]-9.09481449401162e-14[/C][/ROW]
[ROW][C]5[/C][C]15991.2[/C][C]15991.2[/C][C]2.33737753663677e-13[/C][/ROW]
[ROW][C]6[/C][C]15583.6[/C][C]15583.6[/C][C]2.05969235700141e-12[/C][/ROW]
[ROW][C]7[/C][C]19123.5[/C][C]19123.5[/C][C]-1.44807371158764e-13[/C][/ROW]
[ROW][C]8[/C][C]17838.7[/C][C]17838.7[/C][C]-2.45359422998784e-13[/C][/ROW]
[ROW][C]9[/C][C]17209.4[/C][C]17209.4[/C][C]-7.3170006909563e-14[/C][/ROW]
[ROW][C]10[/C][C]18586.5[/C][C]18586.5[/C][C]-1.89759625337287e-13[/C][/ROW]
[ROW][C]11[/C][C]16258.1[/C][C]16258.1[/C][C]-1.73290317380873e-13[/C][/ROW]
[ROW][C]12[/C][C]15141.6[/C][C]15141.6[/C][C]1.08691326034104e-13[/C][/ROW]
[ROW][C]13[/C][C]19202.1[/C][C]19202.1[/C][C]-4.0209157050117e-14[/C][/ROW]
[ROW][C]14[/C][C]17746.5[/C][C]17746.5[/C][C]-7.16537175641853e-14[/C][/ROW]
[ROW][C]15[/C][C]19090.1[/C][C]19090.1[/C][C]-9.76050312272106e-14[/C][/ROW]
[ROW][C]16[/C][C]18040.3[/C][C]18040.3[/C][C]7.04556629096791e-14[/C][/ROW]
[ROW][C]17[/C][C]17515.5[/C][C]17515.5[/C][C]-1.36186474046221e-13[/C][/ROW]
[ROW][C]18[/C][C]17751.8[/C][C]17751.8[/C][C]-4.31164222847385e-13[/C][/ROW]
[ROW][C]19[/C][C]21072.4[/C][C]21072.4[/C][C]9.855876164226e-14[/C][/ROW]
[ROW][C]20[/C][C]17170[/C][C]17170[/C][C]-3.71167593526792e-14[/C][/ROW]
[ROW][C]21[/C][C]19439.5[/C][C]19439.5[/C][C]5.5550341468931e-14[/C][/ROW]
[ROW][C]22[/C][C]19795.4[/C][C]19795.4[/C][C]-5.03337253333034e-14[/C][/ROW]
[ROW][C]23[/C][C]17574.9[/C][C]17574.9[/C][C]-2.19688028426882e-14[/C][/ROW]
[ROW][C]24[/C][C]16165.4[/C][C]16165.4[/C][C]-8.93959991443743e-14[/C][/ROW]
[ROW][C]25[/C][C]19464.6[/C][C]19464.6[/C][C]2.14367754896176e-13[/C][/ROW]
[ROW][C]26[/C][C]19932.1[/C][C]19932.1[/C][C]9.30485829123688e-14[/C][/ROW]
[ROW][C]27[/C][C]19961.2[/C][C]19961.2[/C][C]-8.8288170916896e-14[/C][/ROW]
[ROW][C]28[/C][C]17343.4[/C][C]17343.4[/C][C]9.58671978619318e-14[/C][/ROW]
[ROW][C]29[/C][C]18924.2[/C][C]18924.2[/C][C]-1.91907624128368e-14[/C][/ROW]
[ROW][C]30[/C][C]18574.1[/C][C]18574.1[/C][C]-5.8649673863785e-13[/C][/ROW]
[ROW][C]31[/C][C]21350.6[/C][C]21350.6[/C][C]-5.58468562577815e-14[/C][/ROW]
[ROW][C]32[/C][C]18594.6[/C][C]18594.6[/C][C]-1.14527703917304e-14[/C][/ROW]
[ROW][C]33[/C][C]19832.1[/C][C]19832.1[/C][C]5.86270295895207e-14[/C][/ROW]
[ROW][C]34[/C][C]20844.4[/C][C]20844.4[/C][C]4.53372077941681e-14[/C][/ROW]
[ROW][C]35[/C][C]19640.2[/C][C]19640.2[/C][C]-1.39011245268788e-14[/C][/ROW]
[ROW][C]36[/C][C]17735.4[/C][C]17735.4[/C][C]4.06478394707514e-14[/C][/ROW]
[ROW][C]37[/C][C]19813.6[/C][C]19813.6[/C][C]1.48813243404959e-13[/C][/ROW]
[ROW][C]38[/C][C]22160[/C][C]22160[/C][C]1.65335020382457e-13[/C][/ROW]
[ROW][C]39[/C][C]20664.3[/C][C]20664.3[/C][C]1.19235486681975e-13[/C][/ROW]
[ROW][C]40[/C][C]17877.4[/C][C]17877.4[/C][C]-4.09407028363932e-13[/C][/ROW]
[ROW][C]41[/C][C]20906.5[/C][C]20906.5[/C][C]-3.5656985677866e-14[/C][/ROW]
[ROW][C]42[/C][C]21164.1[/C][C]21164.1[/C][C]-4.79334517699598e-13[/C][/ROW]
[ROW][C]43[/C][C]21374.4[/C][C]21374.4[/C][C]2.97586362846766e-14[/C][/ROW]
[ROW][C]44[/C][C]22952.3[/C][C]22952.3[/C][C]2.92413854474106e-13[/C][/ROW]
[ROW][C]45[/C][C]21343.5[/C][C]21343.5[/C][C]-4.10073641488889e-14[/C][/ROW]
[ROW][C]46[/C][C]23899.3[/C][C]23899.3[/C][C]1.94756142876422e-13[/C][/ROW]
[ROW][C]47[/C][C]22392.9[/C][C]22392.9[/C][C]2.0916024475044e-13[/C][/ROW]
[ROW][C]48[/C][C]18274.1[/C][C]18274.1[/C][C]-5.99431663604823e-14[/C][/ROW]
[ROW][C]49[/C][C]22786.7[/C][C]22786.7[/C][C]4.40471112156948e-14[/C][/ROW]
[ROW][C]50[/C][C]22321.5[/C][C]22321.5[/C][C]2.70661576498405e-13[/C][/ROW]
[ROW][C]51[/C][C]17842.2[/C][C]17842.2[/C][C]8.36224925412433e-14[/C][/ROW]
[ROW][C]52[/C][C]16373.5[/C][C]16373.5[/C][C]3.34032312532437e-13[/C][/ROW]
[ROW][C]53[/C][C]15933.8[/C][C]15933.8[/C][C]-4.27035315267524e-14[/C][/ROW]
[ROW][C]54[/C][C]16446.1[/C][C]16446.1[/C][C]-5.62696877816572e-13[/C][/ROW]
[ROW][C]55[/C][C]17729[/C][C]17729[/C][C]7.23368294896094e-14[/C][/ROW]
[ROW][C]56[/C][C]16643[/C][C]16643[/C][C]1.51509826908715e-15[/C][/ROW]
[/TABLE]
Source: https://freestatistics.org/blog/index.php?pk=58306&T=4

Globally Unique Identifier (entire table): ba.freestatistics.org/blog/index.php?pk=58306&T=4

As an alternative you can also use a QR Code:  

The GUIDs for individual cells are displayed in the table below:

Multiple Linear Regression - Actuals, Interpolation, and Residuals
Time or IndexActualsInterpolationForecastResidualsPrediction Error
117823.217823.2-3.67018952466713e-13
21787217872-4.57391462229046e-13
317420.417420.4-1.69647770791118e-14
416704.416704.4-9.09481449401162e-14
515991.215991.22.33737753663677e-13
615583.615583.62.05969235700141e-12
719123.519123.5-1.44807371158764e-13
817838.717838.7-2.45359422998784e-13
917209.417209.4-7.3170006909563e-14
1018586.518586.5-1.89759625337287e-13
1116258.116258.1-1.73290317380873e-13
1215141.615141.61.08691326034104e-13
1319202.119202.1-4.0209157050117e-14
1417746.517746.5-7.16537175641853e-14
1519090.119090.1-9.76050312272106e-14
1618040.318040.37.04556629096791e-14
1717515.517515.5-1.36186474046221e-13
1817751.817751.8-4.31164222847385e-13
1921072.421072.49.855876164226e-14
201717017170-3.71167593526792e-14
2119439.519439.55.5550341468931e-14
2219795.419795.4-5.03337253333034e-14
2317574.917574.9-2.19688028426882e-14
2416165.416165.4-8.93959991443743e-14
2519464.619464.62.14367754896176e-13
2619932.119932.19.30485829123688e-14
2719961.219961.2-8.8288170916896e-14
2817343.417343.49.58671978619318e-14
2918924.218924.2-1.91907624128368e-14
3018574.118574.1-5.8649673863785e-13
3121350.621350.6-5.58468562577815e-14
3218594.618594.6-1.14527703917304e-14
3319832.119832.15.86270295895207e-14
3420844.420844.44.53372077941681e-14
3519640.219640.2-1.39011245268788e-14
3617735.417735.44.06478394707514e-14
3719813.619813.61.48813243404959e-13
3822160221601.65335020382457e-13
3920664.320664.31.19235486681975e-13
4017877.417877.4-4.09407028363932e-13
4120906.520906.5-3.5656985677866e-14
4221164.121164.1-4.79334517699598e-13
4321374.421374.42.97586362846766e-14
4422952.322952.32.92413854474106e-13
4521343.521343.5-4.10073641488889e-14
4623899.323899.31.94756142876422e-13
4722392.922392.92.0916024475044e-13
4818274.118274.1-5.99431663604823e-14
4922786.722786.74.40471112156948e-14
5022321.522321.52.70661576498405e-13
5117842.217842.28.36224925412433e-14
5216373.516373.53.34032312532437e-13
5315933.815933.8-4.27035315267524e-14
5416446.116446.1-5.62696877816572e-13
5517729177297.23368294896094e-14
5616643166431.51509826908715e-15


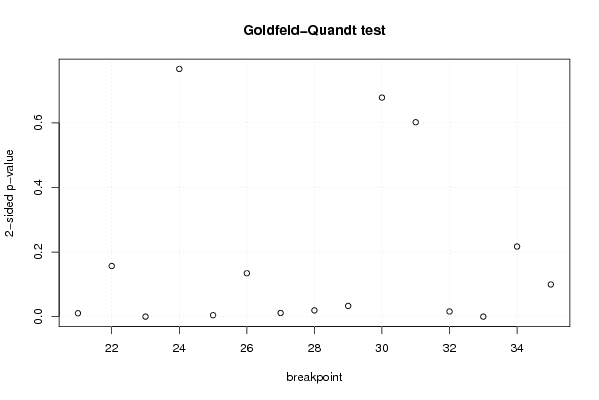
Goldfeld-Quandt test for Heteroskedasticity
p-valuesAlternative Hypothesis
breakpoint indexgreater2-sidedless
210.005272732836277680.01054546567255540.994727267163722
220.07836128134238270.1567225626847650.921638718657617
237.98105752278923e-061.59621150455785e-050.999992018942477
240.6167635798881240.7664728402237520.383236420111876
250.9977723874670380.00445522506592480.0022276125329624
260.9328344922419670.1343310155160670.0671655077580334
270.005673009074317580.01134601814863520.994326990925682
280.009694538733484950.01938907746696990.990305461266515
290.01663035463914040.03326070927828070.98336964536086
300.3389650853876130.6779301707752260.661034914612387
310.3007927797088040.6015855594176070.699207220291196
320.007964125497712070.01592825099542410.992035874502288
33100
340.891510360582870.2169792788342600.108489639417130
350.04982531868136480.09965063736272970.950174681318635

\begin{tabular}{lllllllll}
\hline
Goldfeld-Quandt test for Heteroskedasticity \tabularnewline
p-values & Alternative Hypothesis \tabularnewline
breakpoint index & greater & 2-sided & less \tabularnewline
21 & 0.00527273283627768 & 0.0105454656725554 & 0.994727267163722 \tabularnewline
22 & 0.0783612813423827 & 0.156722562684765 & 0.921638718657617 \tabularnewline
23 & 7.98105752278923e-06 & 1.59621150455785e-05 & 0.999992018942477 \tabularnewline
24 & 0.616763579888124 & 0.766472840223752 & 0.383236420111876 \tabularnewline
25 & 0.997772387467038 & 0.0044552250659248 & 0.0022276125329624 \tabularnewline
26 & 0.932834492241967 & 0.134331015516067 & 0.0671655077580334 \tabularnewline
27 & 0.00567300907431758 & 0.0113460181486352 & 0.994326990925682 \tabularnewline
28 & 0.00969453873348495 & 0.0193890774669699 & 0.990305461266515 \tabularnewline
29 & 0.0166303546391404 & 0.0332607092782807 & 0.98336964536086 \tabularnewline
30 & 0.338965085387613 & 0.677930170775226 & 0.661034914612387 \tabularnewline
31 & 0.300792779708804 & 0.601585559417607 & 0.699207220291196 \tabularnewline
32 & 0.00796412549771207 & 0.0159282509954241 & 0.992035874502288 \tabularnewline
33 & 1 & 0 & 0 \tabularnewline
34 & 0.89151036058287 & 0.216979278834260 & 0.108489639417130 \tabularnewline
35 & 0.0498253186813648 & 0.0996506373627297 & 0.950174681318635 \tabularnewline
\hline
\end{tabular}
%Source: https://freestatistics.org/blog/index.php?pk=58306&T=5

[TABLE]
[ROW][C]Goldfeld-Quandt test for Heteroskedasticity[/C][/ROW]
[ROW][C]p-values[/C][C]Alternative Hypothesis[/C][/ROW]
[ROW][C]breakpoint index[/C][C]greater[/C][C]2-sided[/C][C]less[/C][/ROW]
[ROW][C]21[/C][C]0.00527273283627768[/C][C]0.0105454656725554[/C][C]0.994727267163722[/C][/ROW]
[ROW][C]22[/C][C]0.0783612813423827[/C][C]0.156722562684765[/C][C]0.921638718657617[/C][/ROW]
[ROW][C]23[/C][C]7.98105752278923e-06[/C][C]1.59621150455785e-05[/C][C]0.999992018942477[/C][/ROW]
[ROW][C]24[/C][C]0.616763579888124[/C][C]0.766472840223752[/C][C]0.383236420111876[/C][/ROW]
[ROW][C]25[/C][C]0.997772387467038[/C][C]0.0044552250659248[/C][C]0.0022276125329624[/C][/ROW]
[ROW][C]26[/C][C]0.932834492241967[/C][C]0.134331015516067[/C][C]0.0671655077580334[/C][/ROW]
[ROW][C]27[/C][C]0.00567300907431758[/C][C]0.0113460181486352[/C][C]0.994326990925682[/C][/ROW]
[ROW][C]28[/C][C]0.00969453873348495[/C][C]0.0193890774669699[/C][C]0.990305461266515[/C][/ROW]
[ROW][C]29[/C][C]0.0166303546391404[/C][C]0.0332607092782807[/C][C]0.98336964536086[/C][/ROW]
[ROW][C]30[/C][C]0.338965085387613[/C][C]0.677930170775226[/C][C]0.661034914612387[/C][/ROW]
[ROW][C]31[/C][C]0.300792779708804[/C][C]0.601585559417607[/C][C]0.699207220291196[/C][/ROW]
[ROW][C]32[/C][C]0.00796412549771207[/C][C]0.0159282509954241[/C][C]0.992035874502288[/C][/ROW]
[ROW][C]33[/C][C]1[/C][C]0[/C][C]0[/C][/ROW]
[ROW][C]34[/C][C]0.89151036058287[/C][C]0.216979278834260[/C][C]0.108489639417130[/C][/ROW]
[ROW][C]35[/C][C]0.0498253186813648[/C][C]0.0996506373627297[/C][C]0.950174681318635[/C][/ROW]
[/TABLE]
Source: https://freestatistics.org/blog/index.php?pk=58306&T=5

Globally Unique Identifier (entire table): ba.freestatistics.org/blog/index.php?pk=58306&T=5

As an alternative you can also use a QR Code:  

The GUIDs for individual cells are displayed in the table below:

Goldfeld-Quandt test for Heteroskedasticity
p-valuesAlternative Hypothesis
breakpoint indexgreater2-sidedless
210.005272732836277680.01054546567255540.994727267163722
220.07836128134238270.1567225626847650.921638718657617
237.98105752278923e-061.59621150455785e-050.999992018942477
240.6167635798881240.7664728402237520.383236420111876
250.9977723874670380.00445522506592480.0022276125329624
260.9328344922419670.1343310155160670.0671655077580334
270.005673009074317580.01134601814863520.994326990925682
280.009694538733484950.01938907746696990.990305461266515
290.01663035463914040.03326070927828070.98336964536086
300.3389650853876130.6779301707752260.661034914612387
310.3007927797088040.6015855594176070.699207220291196
320.007964125497712070.01592825099542410.992035874502288
33100
340.891510360582870.2169792788342600.108489639417130
350.04982531868136480.09965063736272970.950174681318635


Meta Analysis of Goldfeld-Quandt test for Heteroskedasticity
Description# significant tests% significant testsOK/NOK
1% type I error level30.2NOK
5% type I error level80.533333333333333NOK
10% type I error level90.6NOK

\begin{tabular}{lllllllll}
\hline
Meta Analysis of Goldfeld-Quandt test for Heteroskedasticity \tabularnewline
Description & # significant tests & % significant tests & OK/NOK \tabularnewline
1% type I error level & 3 & 0.2 & NOK \tabularnewline
5% type I error level & 8 & 0.533333333333333 & NOK \tabularnewline
10% type I error level & 9 & 0.6 & NOK \tabularnewline
\hline
\end{tabular}
%Source: https://freestatistics.org/blog/index.php?pk=58306&T=6

[TABLE]
[ROW][C]Meta Analysis of Goldfeld-Quandt test for Heteroskedasticity[/C][/ROW]
[ROW][C]Description[/C][C]# significant tests[/C][C]% significant tests[/C][C]OK/NOK[/C][/ROW]
[ROW][C]1% type I error level[/C][C]3[/C][C]0.2[/C][C]NOK[/C][/ROW]
[ROW][C]5% type I error level[/C][C]8[/C][C]0.533333333333333[/C][C]NOK[/C][/ROW]
[ROW][C]10% type I error level[/C][C]9[/C][C]0.6[/C][C]NOK[/C][/ROW]
[/TABLE]
Source: https://freestatistics.org/blog/index.php?pk=58306&T=6

Globally Unique Identifier (entire table): ba.freestatistics.org/blog/index.php?pk=58306&T=6

As an alternative you can also use a QR Code:  

The GUIDs for individual cells are displayed in the table below:

Meta Analysis of Goldfeld-Quandt test for Heteroskedasticity
Description# significant tests% significant testsOK/NOK
1% type I error level30.2NOK
5% type I error level80.533333333333333NOK
10% type I error level90.6NOK


Parameters (Session):
par1 = 1 ; par2 = Include Monthly Dummies ; par3 = Linear Trend ;
Parameters (R input):
par1 = 1 ; par2 = Include Monthly Dummies ; par3 = Linear Trend ;
R code (references can be found in the software module):
library(lattice)
library(lmtest)
n25 <- 25 #minimum number of obs. for Goldfeld-Quandt test
par1 <- as.numeric(par1)
x <- t(y)
k <- length(x[1,])
n <- length(x[,1])
x1 <- cbind(x[,par1], x[,1:k!=par1])
mycolnames <- c(colnames(x)[par1], colnames(x)[1:k!=par1])
colnames(x1) <- mycolnames #colnames(x)[par1]
x <- x1
if (par3 == 'First Differences'){
x2 <- array(0, dim=c(n-1,k), dimnames=list(1:(n-1), paste('(1-B)',colnames(x),sep='')))
for (i in 1:n-1) {
for (j in 1:k) {
x2[i,j] <- x[i+1,j] - x[i,j]
}
}
x <- x2
}
if (par2 == 'Include Monthly Dummies'){
x2 <- array(0, dim=c(n,11), dimnames=list(1:n, paste('M', seq(1:11), sep ='')))
for (i in 1:11){
x2[seq(i,n,12),i] <- 1
}
x <- cbind(x, x2)
}
if (par2 == 'Include Quarterly Dummies'){
x2 <- array(0, dim=c(n,3), dimnames=list(1:n, paste('Q', seq(1:3), sep ='')))
for (i in 1:3){
x2[seq(i,n,4),i] <- 1
}
x <- cbind(x, x2)
}
k <- length(x[1,])
if (par3 == 'Linear Trend'){
x <- cbind(x, c(1:n))
colnames(x)[k+1] <- 't'
}
x
k <- length(x[1,])
df <- as.data.frame(x)
(mylm <- lm(df))
(mysum <- summary(mylm))
if (n > n25) {
kp3 <- k + 3
nmkm3 <- n - k - 3
gqarr <- array(NA, dim=c(nmkm3-kp3+1,3))
numgqtests <- 0
numsignificant1 <- 0
numsignificant5 <- 0
numsignificant10 <- 0
for (mypoint in kp3:nmkm3) {
j <- 0
numgqtests <- numgqtests + 1
for (myalt in c('greater', 'two.sided', 'less')) {
j <- j + 1
gqarr[mypoint-kp3+1,j] <- gqtest(mylm, point=mypoint, alternative=myalt)$p.value
}
if (gqarr[mypoint-kp3+1,2] < 0.01) numsignificant1 <- numsignificant1 + 1
if (gqarr[mypoint-kp3+1,2] < 0.05) numsignificant5 <- numsignificant5 + 1
if (gqarr[mypoint-kp3+1,2] < 0.10) numsignificant10 <- numsignificant10 + 1
}
gqarr
}
bitmap(file='test0.png')
plot(x[,1], type='l', main='Actuals and Interpolation', ylab='value of Actuals and Interpolation (dots)', xlab='time or index')
points(x[,1]-mysum$resid)
grid()
dev.off()
bitmap(file='test1.png')
plot(mysum$resid, type='b', pch=19, main='Residuals', ylab='value of Residuals', xlab='time or index')
grid()
dev.off()
bitmap(file='test2.png')
hist(mysum$resid, main='Residual Histogram', xlab='values of Residuals')
grid()
dev.off()
bitmap(file='test3.png')
densityplot(~mysum$resid,col='black',main='Residual Density Plot', xlab='values of Residuals')
dev.off()
bitmap(file='test4.png')
qqnorm(mysum$resid, main='Residual Normal Q-Q Plot')
qqline(mysum$resid)
grid()
dev.off()
(myerror <- as.ts(mysum$resid))
bitmap(file='test5.png')
dum <- cbind(lag(myerror,k=1),myerror)
dum
dum1 <- dum[2:length(myerror),]
dum1
z <- as.data.frame(dum1)
z
plot(z,main=paste('Residual Lag plot, lowess, and regression line'), ylab='values of Residuals', xlab='lagged values of Residuals')
lines(lowess(z))
abline(lm(z))
grid()
dev.off()
bitmap(file='test6.png')
acf(mysum$resid, lag.max=length(mysum$resid)/2, main='Residual Autocorrelation Function')
grid()
dev.off()
bitmap(file='test7.png')
pacf(mysum$resid, lag.max=length(mysum$resid)/2, main='Residual Partial Autocorrelation Function')
grid()
dev.off()
bitmap(file='test8.png')
opar <- par(mfrow = c(2,2), oma = c(0, 0, 1.1, 0))
plot(mylm, las = 1, sub='Residual Diagnostics')
par(opar)
dev.off()
if (n > n25) {
bitmap(file='test9.png')
plot(kp3:nmkm3,gqarr[,2], main='Goldfeld-Quandt test',ylab='2-sided p-value',xlab='breakpoint')
grid()
dev.off()
}
load(file='createtable')
a<-table.start()
a<-table.row.start(a)
a<-table.element(a, 'Multiple Linear Regression - Estimated Regression Equation', 1, TRUE)
a<-table.row.end(a)
myeq <- colnames(x)[1]
myeq <- paste(myeq, '[t] = ', sep='')
for (i in 1:k){
if (mysum$coefficients[i,1] > 0) myeq <- paste(myeq, '+', '')
myeq <- paste(myeq, mysum$coefficients[i,1], sep=' ')
if (rownames(mysum$coefficients)[i] != '(Intercept)') {
myeq <- paste(myeq, rownames(mysum$coefficients)[i], sep='')
if (rownames(mysum$coefficients)[i] != 't') myeq <- paste(myeq, '[t]', sep='')
}
}
myeq <- paste(myeq, ' + e[t]')
a<-table.row.start(a)
a<-table.element(a, myeq)
a<-table.row.end(a)
a<-table.end(a)
table.save(a,file='mytable1.tab')
a<-table.start()
a<-table.row.start(a)
a<-table.element(a,hyperlink('ols1.htm','Multiple Linear Regression - Ordinary Least Squares',''), 6, TRUE)
a<-table.row.end(a)
a<-table.row.start(a)
a<-table.element(a,'Variable',header=TRUE)
a<-table.element(a,'Parameter',header=TRUE)
a<-table.element(a,'S.D.',header=TRUE)
a<-table.element(a,'T-STAT
H0: parameter = 0',header=TRUE)
a<-table.element(a,'2-tail p-value',header=TRUE)
a<-table.element(a,'1-tail p-value',header=TRUE)
a<-table.row.end(a)
for (i in 1:k){
a<-table.row.start(a)
a<-table.element(a,rownames(mysum$coefficients)[i],header=TRUE)
a<-table.element(a,mysum$coefficients[i,1])
a<-table.element(a, round(mysum$coefficients[i,2],6))
a<-table.element(a, round(mysum$coefficients[i,3],4))
a<-table.element(a, round(mysum$coefficients[i,4],6))
a<-table.element(a, round(mysum$coefficients[i,4]/2,6))
a<-table.row.end(a)
}
a<-table.end(a)
table.save(a,file='mytable2.tab')
a<-table.start()
a<-table.row.start(a)
a<-table.element(a, 'Multiple Linear Regression - Regression Statistics', 2, TRUE)
a<-table.row.end(a)
a<-table.row.start(a)
a<-table.element(a, 'Multiple R',1,TRUE)
a<-table.element(a, sqrt(mysum$r.squared))
a<-table.row.end(a)
a<-table.row.start(a)
a<-table.element(a, 'R-squared',1,TRUE)
a<-table.element(a, mysum$r.squared)
a<-table.row.end(a)
a<-table.row.start(a)
a<-table.element(a, 'Adjusted R-squared',1,TRUE)
a<-table.element(a, mysum$adj.r.squared)
a<-table.row.end(a)
a<-table.row.start(a)
a<-table.element(a, 'F-TEST (value)',1,TRUE)
a<-table.element(a, mysum$fstatistic[1])
a<-table.row.end(a)
a<-table.row.start(a)
a<-table.element(a, 'F-TEST (DF numerator)',1,TRUE)
a<-table.element(a, mysum$fstatistic[2])
a<-table.row.end(a)
a<-table.row.start(a)
a<-table.element(a, 'F-TEST (DF denominator)',1,TRUE)
a<-table.element(a, mysum$fstatistic[3])
a<-table.row.end(a)
a<-table.row.start(a)
a<-table.element(a, 'p-value',1,TRUE)
a<-table.element(a, 1-pf(mysum$fstatistic[1],mysum$fstatistic[2],mysum$fstatistic[3]))
a<-table.row.end(a)
a<-table.row.start(a)
a<-table.element(a, 'Multiple Linear Regression - Residual Statistics', 2, TRUE)
a<-table.row.end(a)
a<-table.row.start(a)
a<-table.element(a, 'Residual Standard Deviation',1,TRUE)
a<-table.element(a, mysum$sigma)
a<-table.row.end(a)
a<-table.row.start(a)
a<-table.element(a, 'Sum Squared Residuals',1,TRUE)
a<-table.element(a, sum(myerror*myerror))
a<-table.row.end(a)
a<-table.end(a)
table.save(a,file='mytable3.tab')
a<-table.start()
a<-table.row.start(a)
a<-table.element(a, 'Multiple Linear Regression - Actuals, Interpolation, and Residuals', 4, TRUE)
a<-table.row.end(a)
a<-table.row.start(a)
a<-table.element(a, 'Time or Index', 1, TRUE)
a<-table.element(a, 'Actuals', 1, TRUE)
a<-table.element(a, 'Interpolation
Forecast', 1, TRUE)
a<-table.element(a, 'Residuals
Prediction Error', 1, TRUE)
a<-table.row.end(a)
for (i in 1:n) {
a<-table.row.start(a)
a<-table.element(a,i, 1, TRUE)
a<-table.element(a,x[i])
a<-table.element(a,x[i]-mysum$resid[i])
a<-table.element(a,mysum$resid[i])
a<-table.row.end(a)
}
a<-table.end(a)
table.save(a,file='mytable4.tab')
if (n > n25) {
a<-table.start()
a<-table.row.start(a)
a<-table.element(a,'Goldfeld-Quandt test for Heteroskedasticity',4,TRUE)
a<-table.row.end(a)
a<-table.row.start(a)
a<-table.element(a,'p-values',header=TRUE)
a<-table.element(a,'Alternative Hypothesis',3,header=TRUE)
a<-table.row.end(a)
a<-table.row.start(a)
a<-table.element(a,'breakpoint index',header=TRUE)
a<-table.element(a,'greater',header=TRUE)
a<-table.element(a,'2-sided',header=TRUE)
a<-table.element(a,'less',header=TRUE)
a<-table.row.end(a)
for (mypoint in kp3:nmkm3) {
a<-table.row.start(a)
a<-table.element(a,mypoint,header=TRUE)
a<-table.element(a,gqarr[mypoint-kp3+1,1])
a<-table.element(a,gqarr[mypoint-kp3+1,2])
a<-table.element(a,gqarr[mypoint-kp3+1,3])
a<-table.row.end(a)
}
a<-table.end(a)
table.save(a,file='mytable5.tab')
a<-table.start()
a<-table.row.start(a)
a<-table.element(a,'Meta Analysis of Goldfeld-Quandt test for Heteroskedasticity',4,TRUE)
a<-table.row.end(a)
a<-table.row.start(a)
a<-table.element(a,'Description',header=TRUE)
a<-table.element(a,'# significant tests',header=TRUE)
a<-table.element(a,'% significant tests',header=TRUE)
a<-table.element(a,'OK/NOK',header=TRUE)
a<-table.row.end(a)
a<-table.row.start(a)
a<-table.element(a,'1% type I error level',header=TRUE)
a<-table.element(a,numsignificant1)
a<-table.element(a,numsignificant1/numgqtests)
if (numsignificant1/numgqtests < 0.01) dum <- 'OK' else dum <- 'NOK'
a<-table.element(a,dum)
a<-table.row.end(a)
a<-table.row.start(a)
a<-table.element(a,'5% type I error level',header=TRUE)
a<-table.element(a,numsignificant5)
a<-table.element(a,numsignificant5/numgqtests)
if (numsignificant5/numgqtests < 0.05) dum <- 'OK' else dum <- 'NOK'
a<-table.element(a,dum)
a<-table.row.end(a)
a<-table.row.start(a)
a<-table.element(a,'10% type I error level',header=TRUE)
a<-table.element(a,numsignificant10)
a<-table.element(a,numsignificant10/numgqtests)
if (numsignificant10/numgqtests < 0.1) dum <- 'OK' else dum <- 'NOK'
a<-table.element(a,dum)
a<-table.row.end(a)
a<-table.end(a)
table.save(a,file='mytable6.tab')
}