| Multiple Linear Regression - Estimated Regression Equation |
| Y[t] = -118.138386770027 + 3.78371344759034X[t] -19.2118191206132M1[t] -99.749746567234M2[t] -114.917254356113M3[t] -86.954702524727M4[t] -45.2971407566303M5[t] -59.7821994116779M6[t] -46.7920522368219M7[t] -59.1964986084116M8[t] -37.3590286359412M9[t] -44.9661323364949M10[t] -63.3430477153376M11[t] + 0.488172121119932t + e[t] |
| Multiple Linear Regression - Ordinary Least Squares | |||||
| Variable | Parameter | S.D. | T-STAT H0: parameter = 0 | 2-tail p-value | 1-tail p-value |
| (Intercept) | -118.138386770027 | 58.247416 | -2.0282 | 0.048227 | 0.024113 |
| X | 3.78371344759034 | 0.62439 | 6.0599 | 0 | 0 |
| M1 | -19.2118191206132 | 29.603294 | -0.649 | 0.519513 | 0.259756 |
| M2 | -99.749746567234 | 33.992088 | -2.9345 | 0.005154 | 0.002577 |
| M3 | -114.917254356113 | 34.398262 | -3.3408 | 0.001644 | 0.000822 |
| M4 | -86.954702524727 | 32.340004 | -2.6888 | 0.009892 | 0.004946 |
| M5 | -45.2971407566303 | 31.063714 | -1.4582 | 0.151436 | 0.075718 |
| M6 | -59.7821994116779 | 31.533311 | -1.8958 | 0.064139 | 0.032069 |
| M7 | -46.7920522368219 | 31.405516 | -1.4899 | 0.142923 | 0.071462 |
| M8 | -59.1964986084116 | 32.406213 | -1.8267 | 0.074099 | 0.03705 |
| M9 | -37.3590286359412 | 31.67213 | -1.1796 | 0.244113 | 0.122057 |
| M10 | -44.9661323364949 | 31.627685 | -1.4217 | 0.161706 | 0.080853 |
| M11 | -63.3430477153376 | 32.699021 | -1.9372 | 0.05875 | 0.029375 |
| t | 0.488172121119932 | 0.362647 | 1.3461 | 0.184716 | 0.092358 |
| Multiple Linear Regression - Regression Statistics | |
| Multiple R | 0.704334813036706 |
| R-squared | 0.496087528855452 |
| Adjusted R-squared | 0.356707483645258 |
| F-TEST (value) | 3.55924356393571 |
| F-TEST (DF numerator) | 13 |
| F-TEST (DF denominator) | 47 |
| p-value | 0.000665857165168315 |
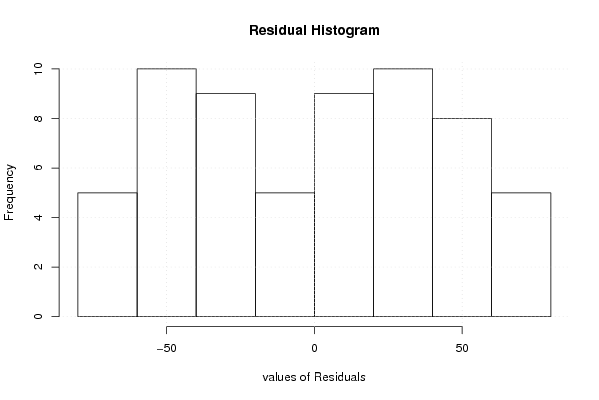
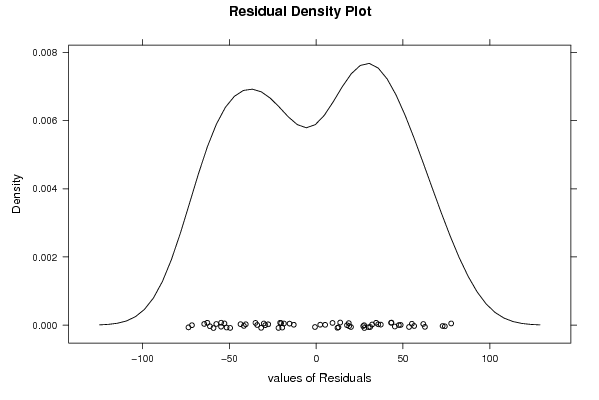
| Multiple Linear Regression - Residual Statistics | |
| Residual Standard Deviation | 48.7928286326505 |
| Sum Squared Residuals | 111894.785920834 |
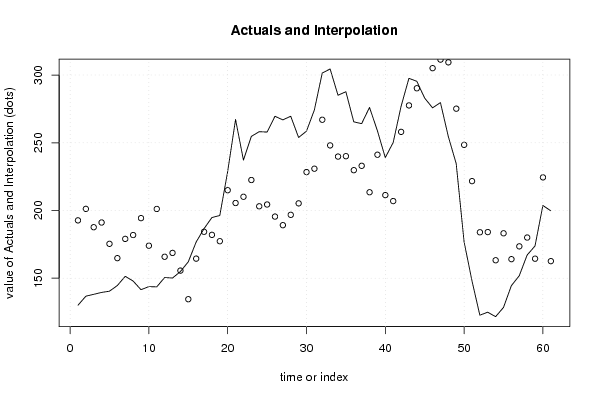
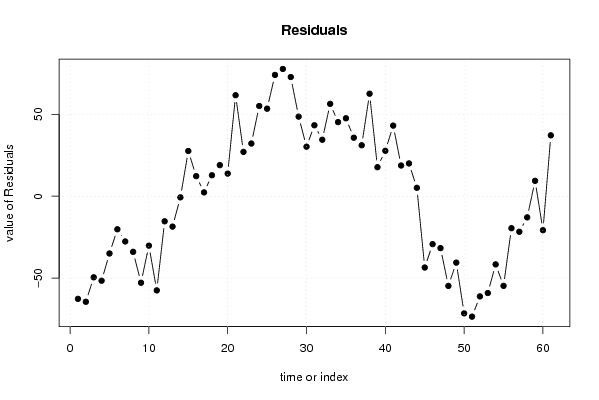
| Multiple Linear Regression - Actuals, Interpolation, and Residuals | |||
| Time or Index | Actuals | Interpolation Forecast | Residuals Prediction Error |
| 1 | 130 | 192.699407515599 | -62.6994075155985 |
| 2 | 136.7 | 201.188546863712 | -64.488546863712 |
| 3 | 138.1 | 187.64432523023 | -49.5443252302301 |
| 4 | 139.5 | 191.122540428640 | -51.6225404286396 |
| 5 | 140.4 | 175.377458569724 | -34.9774585697241 |
| 6 | 144.6 | 164.785914138628 | -20.1859141386278 |
| 7 | 151.4 | 179.020976124122 | -27.6209761241217 |
| 8 | 147.9 | 181.861184319254 | -33.9611843192543 |
| 9 | 141.5 | 194.349171449110 | -52.8491714491097 |
| 10 | 143.8 | 173.987242803110 | -30.1872428031097 |
| 11 | 143.6 | 201.124689571712 | -57.5246895717121 |
| 12 | 150.5 | 165.822617081303 | -15.3226170813026 |
| 13 | 150.1 | 168.666136733074 | -18.5661367330744 |
| 14 | 154.9 | 155.588109429923 | -0.688109429922506 |
| 15 | 162.1 | 134.47646090126 | 27.6235390987401 |
| 16 | 176.7 | 164.440670232802 | 12.2593297671981 |
| 17 | 186.6 | 184.262494781236 | 2.33750521876447 |
| 18 | 194.8 | 181.995119934838 | 12.8048800651620 |
| 19 | 196.3 | 177.311614682380 | 18.9883853176198 |
| 20 | 228.8 | 214.961986595344 | 13.8380134046560 |
| 21 | 267.2 | 205.504435729175 | 61.6955642708246 |
| 22 | 237.2 | 210.115015837272 | 27.0849841627283 |
| 23 | 254.7 | 222.495980160272 | 32.2040198397283 |
| 24 | 258.2 | 203.085504149742 | 55.1144958502583 |
| 25 | 257.9 | 204.415538422477 | 53.4844615775228 |
| 26 | 269.6 | 195.499595911675 | 74.1004040883253 |
| 27 | 266.9 | 189.144429828614 | 77.7555701713855 |
| 28 | 269.6 | 196.784729819373 | 72.8152701806266 |
| 29 | 253.9 | 205.255414025036 | 48.6445859749639 |
| 30 | 258.6 | 228.338919277494 | 30.2610807225062 |
| 31 | 274.2 | 230.844469575458 | 43.3555304245423 |
| 32 | 301.5 | 266.981356109385 | 34.5186438906147 |
| 33 | 304.5 | 248.064521624241 | 56.4354783757591 |
| 34 | 285.1 | 239.81047601053 | 45.28952398947 |
| 35 | 287.7 | 240.083557301241 | 47.6164426987591 |
| 36 | 265.5 | 229.753993564928 | 35.7460064350723 |
| 37 | 264.1 | 232.975884561458 | 31.1241154385416 |
| 38 | 276.1 | 213.465544397403 | 62.634455602597 |
| 39 | 258.9 | 241.163799342656 | 17.7362006573442 |
| 40 | 239.1 | 211.345336202270 | 27.7546637977295 |
| 41 | 250.1 | 206.951394686126 | 43.1486053138742 |
| 42 | 276.8 | 258.034379450752 | 18.7656205492478 |
| 43 | 297.6 | 277.566640262873 | 20.0333597371274 |
| 44 | 295.4 | 290.24450342174 | 5.15549657825988 |
| 45 | 283 | 326.569885271415 | -43.5698852714146 |
| 46 | 275.8 | 305.072842591138 | -29.2728425911376 |
| 47 | 279.7 | 311.399865397993 | -31.699865397993 |
| 48 | 254.6 | 309.394471246379 | -54.7944712463785 |
| 49 | 234.6 | 275.157599111765 | -40.5575991117649 |
| 50 | 176.9 | 248.458203397288 | -71.5582033972878 |
| 51 | 148.1 | 221.670984697240 | -73.5709846972397 |
| 52 | 122.7 | 183.906723316915 | -61.2067233169146 |
| 53 | 124.9 | 184.053237937878 | -59.1532379378784 |
| 54 | 121.6 | 163.245667198288 | -41.6456671982883 |
| 55 | 128.4 | 183.156299355168 | -54.7562993551677 |
| 56 | 144.5 | 164.050969554276 | -19.5509695542763 |
| 57 | 151.8 | 173.511985926059 | -21.7119859260594 |
| 58 | 167.1 | 180.014422757951 | -12.9144227579510 |
| 59 | 173.8 | 164.395907568782 | 9.40409243121765 |
| 60 | 203.7 | 224.443413957650 | -20.7434139576495 |
| 61 | 199.8 | 162.585433655626 | 37.2145663443736 |
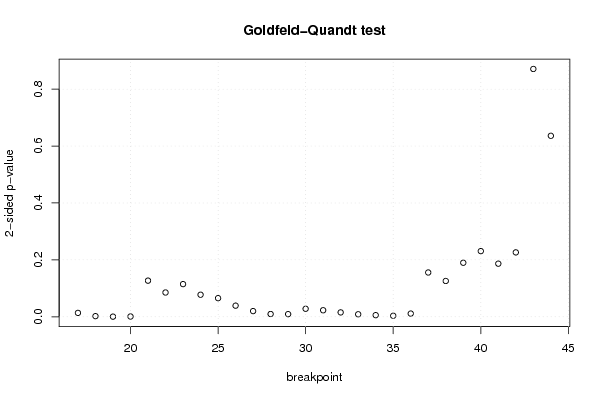
| Goldfeld-Quandt test for Heteroskedasticity | |||
| p-values | Alternative Hypothesis | ||
| breakpoint index | greater | 2-sided | less |
| 17 | 0.00676498977850726 | 0.0135299795570145 | 0.993235010221493 |
| 18 | 0.0010821720281339 | 0.0021643440562678 | 0.998917827971866 |
| 19 | 0.000194793220962173 | 0.000389586441924346 | 0.999805206779038 |
| 20 | 0.000441910606938794 | 0.000883821213877588 | 0.999558089393061 |
| 21 | 0.0634593325041474 | 0.126918665008295 | 0.936540667495853 |
| 22 | 0.0426346455642919 | 0.0852692911285838 | 0.957365354435708 |
| 23 | 0.0574275798753063 | 0.114855159750613 | 0.942572420124694 |
| 24 | 0.0387378436113169 | 0.0774756872226337 | 0.961262156388683 |
| 25 | 0.0327091883473940 | 0.0654183766947881 | 0.967290811652606 |
| 26 | 0.0194971395076855 | 0.038994279015371 | 0.980502860492314 |
| 27 | 0.0099903005777989 | 0.0199806011555978 | 0.990009699422201 |
| 28 | 0.00482361992655275 | 0.0096472398531055 | 0.995176380073447 |
| 29 | 0.00463134725042511 | 0.00926269450085022 | 0.995368652749575 |
| 30 | 0.0140344279376089 | 0.0280688558752179 | 0.98596557206239 |
| 31 | 0.0114451386560649 | 0.0228902773121298 | 0.988554861343935 |
| 32 | 0.00767768459387959 | 0.0153553691877592 | 0.99232231540612 |
| 33 | 0.00440661545737513 | 0.00881323091475026 | 0.995593384542625 |
| 34 | 0.00282097721459963 | 0.00564195442919927 | 0.9971790227854 |
| 35 | 0.00174346001154728 | 0.00348692002309456 | 0.998256539988453 |
| 36 | 0.0055894332699196 | 0.0111788665398392 | 0.99441056673008 |
| 37 | 0.0777919474576843 | 0.155583894915369 | 0.922208052542316 |
| 38 | 0.0628941930155178 | 0.125788386031036 | 0.937105806984482 |
| 39 | 0.094928388625246 | 0.189856777250492 | 0.905071611374754 |
| 40 | 0.115351286326832 | 0.230702572653665 | 0.884648713673168 |
| 41 | 0.0933042305050437 | 0.186608461010087 | 0.906695769494956 |
| 42 | 0.113144804957674 | 0.226289609915348 | 0.886855195042326 |
| 43 | 0.435526568029189 | 0.871053136058379 | 0.564473431970811 |
| 44 | 0.681969365090276 | 0.636061269819449 | 0.318030634909724 |
| Meta Analysis of Goldfeld-Quandt test for Heteroskedasticity | |||
| Description | # significant tests | % significant tests | OK/NOK |
| 1% type I error level | 8 | 0.285714285714286 | NOK |
| 5% type I error level | 15 | 0.535714285714286 | NOK |
| 10% type I error level | 18 | 0.642857142857143 | NOK |