| Multiple Linear Regression - Estimated Regression Equation |
| britse_pond[t] = + 0.136039597495012 -0.0837778395373193Zwitserse_frank[t] + 1.12933820928760`Britse_pond_-1`[t] -0.155747217813694`Britse_pond_-2`[t] + 0.00722085111187932M1[t] + 0.000961566541320923M2[t] + 0.0125782436648632M3[t] -0.000865431373813849M4[t] + 0.00785537504436781M5[t] + 0.0073783304629954M6[t] + 0.00229776282336032M7[t] + 0.00716246700968827M8[t] + 0.0033528548036246M9[t] + 0.00607844505430859M10[t] + 0.00488969511372625M11[t] + 0.000143463291902331t + e[t] |
| Multiple Linear Regression - Ordinary Least Squares | |||||
| Variable | Parameter | S.D. | T-STAT H0: parameter = 0 | 2-tail p-value | 1-tail p-value |
| (Intercept) | 0.136039597495012 | 0.063436 | 2.1445 | 0.037823 | 0.018911 |
| Zwitserse_frank | -0.0837778395373193 | 0.054173 | -1.5465 | 0.129487 | 0.064744 |
| `Britse_pond_-1` | 1.12933820928760 | 0.149549 | 7.5516 | 0 | 0 |
| `Britse_pond_-2` | -0.155747217813694 | 0.169166 | -0.9207 | 0.362477 | 0.181238 |
| M1 | 0.00722085111187932 | 0.005727 | 1.2608 | 0.214325 | 0.107162 |
| M2 | 0.000961566541320923 | 0.005705 | 0.1685 | 0.866967 | 0.433483 |
| M3 | 0.0125782436648632 | 0.005729 | 2.1955 | 0.033708 | 0.016854 |
| M4 | -0.000865431373813849 | 0.005805 | -0.1491 | 0.882207 | 0.441104 |
| M5 | 0.00785537504436781 | 0.005738 | 1.3691 | 0.178252 | 0.089126 |
| M6 | 0.0073783304629954 | 0.005725 | 1.2888 | 0.204527 | 0.102264 |
| M7 | 0.00229776282336032 | 0.005703 | 0.4029 | 0.689055 | 0.344527 |
| M8 | 0.00716246700968827 | 0.0057 | 1.2566 | 0.215825 | 0.107913 |
| M9 | 0.0033528548036246 | 0.005698 | 0.5884 | 0.559383 | 0.279691 |
| M10 | 0.00607844505430859 | 0.005695 | 1.0673 | 0.291946 | 0.145973 |
| M11 | 0.00488969511372625 | 0.005987 | 0.8168 | 0.418665 | 0.209332 |
| t | 0.000143463291902331 | 0.000112 | 1.2752 | 0.209232 | 0.104616 |
| Multiple Linear Regression - Regression Statistics | |
| Multiple R | 0.973851080073204 |
| R-squared | 0.948385926159746 |
| Adjusted R-squared | 0.929952328359655 |
| F-TEST (value) | 51.4487696023764 |
| F-TEST (DF numerator) | 15 |
| F-TEST (DF denominator) | 42 |
| p-value | 0 |
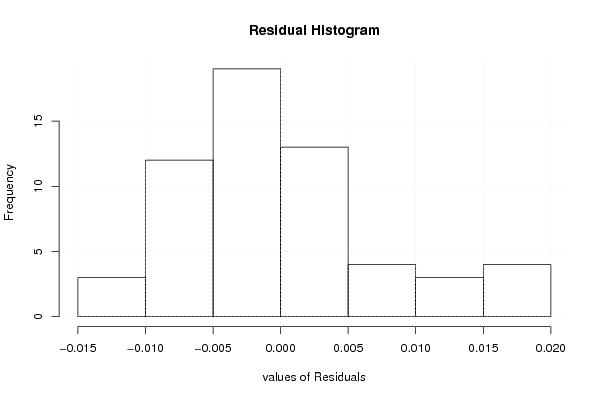
| Multiple Linear Regression - Residual Statistics | |
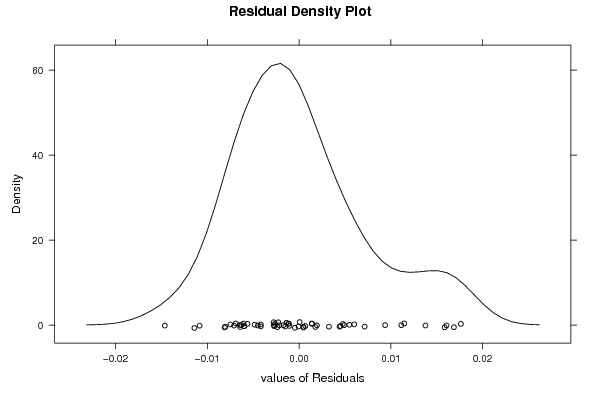
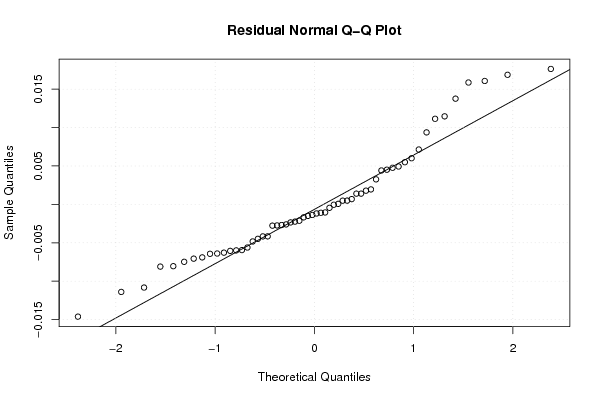
| Residual Standard Deviation | 0.00845799712280262 |
| Sum Squared Residuals | 0.00300458404383217 |
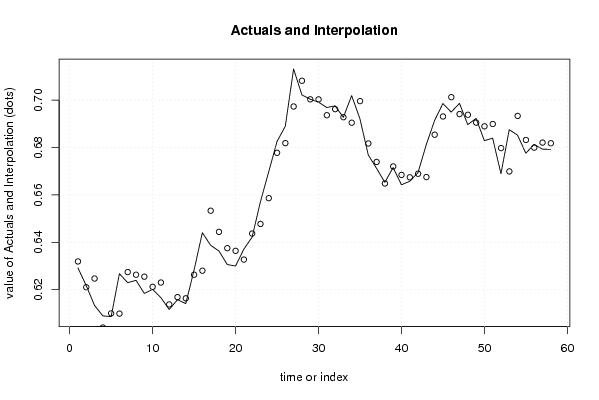
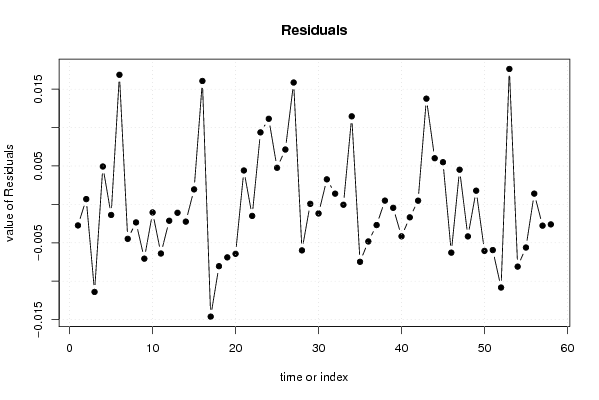
| Multiple Linear Regression - Actuals, Interpolation, and Residuals | |||
| Time or Index | Actuals | Interpolation Forecast | Residuals Prediction Error |
| 1 | 0.62915 | 0.631895130109449 | -0.00274513010944870 |
| 2 | 0.62168 | 0.620996305598852 | 0.000683694401148332 |
| 3 | 0.61328 | 0.624681907751489 | -0.0114019077514888 |
| 4 | 0.6089 | 0.603971865214723 | 0.00492813478527658 |
| 5 | 0.60857 | 0.609951910753599 | -0.00138191075359847 |
| 6 | 0.62672 | 0.609852420613504 | 0.0168675793864960 |
| 7 | 0.62291 | 0.627399469439532 | -0.00448946943953186 |
| 8 | 0.62393 | 0.626283380411506 | -0.00235338041150552 |
| 9 | 0.61838 | 0.625451665284673 | -0.00707166528467286 |
| 10 | 0.62012 | 0.621173540183522 | -0.00105354018352215 |
| 11 | 0.61659 | 0.622991210213683 | -0.0064012102136835 |
| 12 | 0.6116 | 0.613736080835466 | -0.00213608083546645 |
| 13 | 0.61573 | 0.616827430297297 | -0.00109743029729740 |
| 14 | 0.61407 | 0.616320510118964 | -0.00225051011896407 |
| 15 | 0.62823 | 0.626283202517442 | 0.00194679748255837 |
| 16 | 0.64405 | 0.627984670386644 | 0.016065329613356 |
| 17 | 0.6387 | 0.653322335006928 | -0.014622335006928 |
| 18 | 0.63633 | 0.644382339904512 | -0.00805233990451194 |
| 19 | 0.63059 | 0.637493040424672 | -0.00690304042467217 |
| 20 | 0.62994 | 0.636379549703856 | -0.00643954970385632 |
| 21 | 0.63709 | 0.632680630952973 | 0.00440936904702711 |
| 22 | 0.64217 | 0.643675421679822 | -0.00150542167982209 |
| 23 | 0.65711 | 0.647739491996272 | 0.00937050800372833 |
| 24 | 0.66977 | 0.658630354605163 | 0.0111396453948369 |
| 25 | 0.68255 | 0.677789293841361 | 0.00476070615863913 |
| 26 | 0.68902 | 0.681881031216325 | 0.00713896878367483 |
| 27 | 0.71322 | 0.697357383667039 | 0.0158626163329613 |
| 28 | 0.70224 | 0.708234759393614 | -0.00599475939361406 |
| 29 | 0.70045 | 0.700385256937636 | 6.47430623638514e-05 |
| 30 | 0.69919 | 0.700376976285619 | -0.00118697628561933 |
| 31 | 0.69693 | 0.693675737301494 | 0.00325426269850557 |
| 32 | 0.69763 | 0.696235686297689 | 0.00139431370231089 |
| 33 | 0.69278 | 0.692832395527146 | -5.23955271461109e-05 |
| 34 | 0.70196 | 0.69050051376409 | 0.0114594862359105 |
| 35 | 0.69215 | 0.699631236296295 | -0.00748123629629452 |
| 36 | 0.6769 | 0.681731347817392 | -0.00483134781739225 |
| 37 | 0.67124 | 0.673937312909329 | -0.00269731290932901 |
| 38 | 0.66532 | 0.664835049864073 | 0.000484950135927078 |
| 39 | 0.67157 | 0.672022571574559 | -0.000452571574559055 |
| 40 | 0.66428 | 0.668445326227665 | -0.00416532622766519 |
| 41 | 0.66576 | 0.667449833132316 | -0.00168983313231583 |
| 42 | 0.66942 | 0.668942868887867 | 0.000477131112133344 |
| 43 | 0.6813 | 0.667540014009798 | 0.0137599859902020 |
| 44 | 0.69144 | 0.685436573516936 | 0.00600342648306443 |
| 45 | 0.69862 | 0.693130971727608 | 0.0054890282723924 |
| 46 | 0.695 | 0.701289484799096 | -0.00628948479909576 |
| 47 | 0.69867 | 0.69415806149375 | 0.00451193850624968 |
| 48 | 0.68968 | 0.693852216741978 | -0.00417221674197820 |
| 49 | 0.69233 | 0.690550832842564 | 0.00177916715743597 |
| 50 | 0.68293 | 0.688987103201786 | -0.00605710320178615 |
| 51 | 0.68399 | 0.689944934489472 | -0.0059549344894718 |
| 52 | 0.66895 | 0.679783378777353 | -0.0108333787773533 |
| 53 | 0.68756 | 0.669930664169522 | 0.0176293358304785 |
| 54 | 0.68527 | 0.693375394308498 | -0.0081053943084981 |
| 55 | 0.6776 | 0.683221738824503 | -0.0056217388245035 |
| 56 | 0.68137 | 0.679974810070013 | 0.00139518992998652 |
| 57 | 0.67933 | 0.6821043365076 | -0.00277433650760055 |
| 58 | 0.67922 | 0.68183103957347 | -0.00261103957347046 |
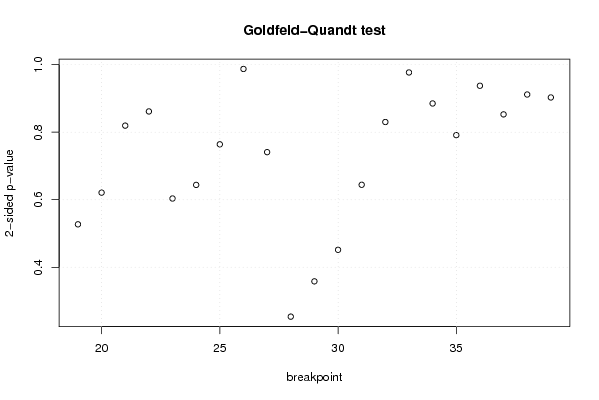
| Goldfeld-Quandt test for Heteroskedasticity | |||
| p-values | Alternative Hypothesis | ||
| breakpoint index | greater | 2-sided | less |
| 19 | 0.736396268403515 | 0.527207463192971 | 0.263603731596485 |
| 20 | 0.689496366767047 | 0.621007266465907 | 0.310503633232953 |
| 21 | 0.590286424555473 | 0.819427150889053 | 0.409713575444527 |
| 22 | 0.569252141189396 | 0.861495717621208 | 0.430747858810604 |
| 23 | 0.698187011106344 | 0.603625977787312 | 0.301812988893656 |
| 24 | 0.678057863611538 | 0.643884272776925 | 0.321942136388462 |
| 25 | 0.617943306370704 | 0.764113387258593 | 0.382056693629296 |
| 26 | 0.50634926434576 | 0.98730147130848 | 0.49365073565424 |
| 27 | 0.629536847226388 | 0.740926305547223 | 0.370463152773612 |
| 28 | 0.873124188290454 | 0.253751623419091 | 0.126875811709546 |
| 29 | 0.820852948479733 | 0.358294103040535 | 0.179147051520267 |
| 30 | 0.774182363111295 | 0.451635273777411 | 0.225817636888705 |
| 31 | 0.67786661140391 | 0.64426677719218 | 0.32213338859609 |
| 32 | 0.584939512186765 | 0.83012097562647 | 0.415060487813235 |
| 33 | 0.511527165741098 | 0.976945668517804 | 0.488472834258902 |
| 34 | 0.557429485448918 | 0.885141029102164 | 0.442570514551082 |
| 35 | 0.604349466257598 | 0.791301067484804 | 0.395650533742402 |
| 36 | 0.531236288708211 | 0.937527422583577 | 0.468763711291789 |
| 37 | 0.573611745989005 | 0.85277650802199 | 0.426388254010995 |
| 38 | 0.544185124255841 | 0.911629751488318 | 0.455814875744159 |
| 39 | 0.451443429602118 | 0.902886859204237 | 0.548556570397882 |
| Meta Analysis of Goldfeld-Quandt test for Heteroskedasticity | |||
| Description | # significant tests | % significant tests | OK/NOK |
| 1% type I error level | 0 | 0 | OK |
| 5% type I error level | 0 | 0 | OK |
| 10% type I error level | 0 | 0 | OK |