Free Statistics

of Irreproducible Research!

Author's title

Author*The author of this computation has been verified*
R Software Modulerwasp_multipleregression.wasp
Title produced by softwareMultiple Regression
Date of computationFri, 20 Nov 2009 09:05:32 -0700
Cite this page as followsStatistical Computations at FreeStatistics.org, Office for Research Development and Education, URL https://freestatistics.org/blog/index.php?v=date/2009/Nov/20/t1258733305q8zikmg1ccx8kv9.htm/, Retrieved Thu, 25 Apr 2024 22:03:06 +0000
Statistical Computations at FreeStatistics.org, Office for Research Development and Education, URL https://freestatistics.org/blog/index.php?pk=58295, Retrieved Thu, 25 Apr 2024 22:03:06 +0000
QR Codes:

Original text written by user:
IsPrivate?No (this computation is public)
User-defined keywordsworkshop 7
Estimated Impact128
Family? (F = Feedback message, R = changed R code, M = changed R Module, P = changed Parameters, D = changed Data)
-     [Multiple Regression] [Q1 The Seatbeltlaw] [2007-11-14 19:27:43] [8cd6641b921d30ebe00b648d1481bba0]
- RM D  [Multiple Regression] [Seatbelt] [2009-11-12 14:14:11] [b98453cac15ba1066b407e146608df68]
-    D      [Multiple Regression] [workshop 7] [2009-11-20 16:05:32] [6198946fb53eb5eb18db46bb758f7fde] [Current]
-    D        [Multiple Regression] [workshop 7] [2009-11-20 16:13:14] [309ee52d0058ff0a6f7eec15e07b2d9f]
Feedback Forum

Post a new message
Dataseries X:
0.62915	1.5355	0.634	0.6348
0.62168	1.5287	0.62915	0.634
0.61328	1.5334	0.62168	0.62915
0.6089	1.5225	0.61328	0.62168
0.60857	1.5135	0.6089	0.61328
0.62672	1.5144	0.60857	0.6089
0.62291	1.4913	0.62672	0.60857
0.62393	1.4793	0.62291	0.62672
0.61838	1.4663	0.62393	0.62291
0.62012	1.4749	0.61838	0.62393
0.61659	1.4745	0.62012	0.61838
0.6116	1.4775	0.61659	0.62012
0.61573	1.4678	0.6116	0.61659
0.61407	1.4658	0.61573	0.6116
0.62823	1.4572	0.61407	0.61573
0.64405	1.4721	0.62823	0.61407
0.6387	1.4624	0.64405	0.62823
0.63633	1.4636	0.6387	0.64405
0.63059	1.4649	0.63633	0.6387
0.62994	1.465	0.63059	0.63633
0.63709	1.4673	0.62994	0.63059
0.64217	1.4679	0.63709	0.62994
0.65711	1.4621	0.64217	0.63709
0.66977	1.4674	0.65711	0.64217
0.68255	1.4695	0.66977	0.65711
0.68902	1.4964	0.68255	0.66977
0.71322	1.5155	0.68902	0.68255
0.70224	1.5411	0.71322	0.68902
0.70045	1.5476	0.70224	0.71322
0.69919	1.54	0.70045	0.70224
0.69693	1.5474	0.69919	0.70045
0.69763	1.5485	0.69693	0.69919
0.69278	1.559	0.69763	0.69693
0.70196	1.5544	0.69278	0.69763
0.69215	1.5657	0.70196	0.69278
0.6769	1.5734	0.69215	0.70196
0.67124	1.567	0.6769	0.69215
0.66532	1.5547	0.67124	0.6769
0.67157	1.54	0.66532	0.67124
0.66428	1.5192	0.67157	0.66532
0.66576	1.527	0.66428	0.67157
0.66942	1.5387	0.66576	0.66428
0.6813	1.5431	0.66942	0.66576
0.69144	1.5426	0.6813	0.66942
0.69862	1.5216	0.69144	0.6813
0.695	1.5364	0.69862	0.69144
0.69867	1.5469	0.695	0.69862
0.68968	1.5501	0.69867	0.695
0.69233	1.5494	0.68968	0.69867
0.68293	1.5475	0.69233	0.68968
0.68399	1.5448	0.68293	0.69233
0.66895	1.5391	0.68399	0.68293
0.68756	1.5578	0.66895	0.68399
0.68527	1.5528	0.68756	0.66895
0.6776	1.5496	0.68527	0.68756
0.68137	1.549	0.6776	0.68527
0.67933	1.5449	0.68137	0.6776
0.67922	1.5479	0.67933	0.68137


Summary of computational transaction
Raw Inputview raw input (R code)
Raw Outputview raw output of R engine
Computing time3 seconds
R Server'Gwilym Jenkins' @ 72.249.127.135

\begin{tabular}{lllllllll}
\hline
Summary of computational transaction \tabularnewline
Raw Input & view raw input (R code)  \tabularnewline
Raw Output & view raw output of R engine  \tabularnewline
Computing time & 3 seconds \tabularnewline
R Server & 'Gwilym Jenkins' @ 72.249.127.135 \tabularnewline
\hline
\end{tabular}
%Source: https://freestatistics.org/blog/index.php?pk=58295&T=0

[TABLE]
[ROW][C]Summary of computational transaction[/C][/ROW]
[ROW][C]Raw Input[/C][C]view raw input (R code) [/C][/ROW]
[ROW][C]Raw Output[/C][C]view raw output of R engine [/C][/ROW]
[ROW][C]Computing time[/C][C]3 seconds[/C][/ROW]
[ROW][C]R Server[/C][C]'Gwilym Jenkins' @ 72.249.127.135[/C][/ROW]
[/TABLE]
Source: https://freestatistics.org/blog/index.php?pk=58295&T=0

Globally Unique Identifier (entire table): ba.freestatistics.org/blog/index.php?pk=58295&T=0

As an alternative you can also use a QR Code:  

The GUIDs for individual cells are displayed in the table below:

Summary of computational transaction
Raw Inputview raw input (R code)
Raw Outputview raw output of R engine
Computing time3 seconds
R Server'Gwilym Jenkins' @ 72.249.127.135


Multiple Linear Regression - Estimated Regression Equation
britse_pond[t] = + 0.136039597495012 -0.0837778395373193Zwitserse_frank[t] + 1.12933820928760`Britse_pond_-1`[t] -0.155747217813694`Britse_pond_-2`[t] + 0.00722085111187932M1[t] + 0.000961566541320923M2[t] + 0.0125782436648632M3[t] -0.000865431373813849M4[t] + 0.00785537504436781M5[t] + 0.0073783304629954M6[t] + 0.00229776282336032M7[t] + 0.00716246700968827M8[t] + 0.0033528548036246M9[t] + 0.00607844505430859M10[t] + 0.00488969511372625M11[t] + 0.000143463291902331t + e[t]

\begin{tabular}{lllllllll}
\hline
Multiple Linear Regression - Estimated Regression Equation \tabularnewline
britse_pond[t] =  +  0.136039597495012 -0.0837778395373193Zwitserse_frank[t] +  1.12933820928760`Britse_pond_-1`[t] -0.155747217813694`Britse_pond_-2`[t] +  0.00722085111187932M1[t] +  0.000961566541320923M2[t] +  0.0125782436648632M3[t] -0.000865431373813849M4[t] +  0.00785537504436781M5[t] +  0.0073783304629954M6[t] +  0.00229776282336032M7[t] +  0.00716246700968827M8[t] +  0.0033528548036246M9[t] +  0.00607844505430859M10[t] +  0.00488969511372625M11[t] +  0.000143463291902331t  + e[t] \tabularnewline
\hline
\end{tabular}
%Source: https://freestatistics.org/blog/index.php?pk=58295&T=1

[TABLE]
[ROW][C]Multiple Linear Regression - Estimated Regression Equation[/C][/ROW]
[ROW][C]britse_pond[t] =  +  0.136039597495012 -0.0837778395373193Zwitserse_frank[t] +  1.12933820928760`Britse_pond_-1`[t] -0.155747217813694`Britse_pond_-2`[t] +  0.00722085111187932M1[t] +  0.000961566541320923M2[t] +  0.0125782436648632M3[t] -0.000865431373813849M4[t] +  0.00785537504436781M5[t] +  0.0073783304629954M6[t] +  0.00229776282336032M7[t] +  0.00716246700968827M8[t] +  0.0033528548036246M9[t] +  0.00607844505430859M10[t] +  0.00488969511372625M11[t] +  0.000143463291902331t  + e[t][/C][/ROW]
[/TABLE]
Source: https://freestatistics.org/blog/index.php?pk=58295&T=1

Globally Unique Identifier (entire table): ba.freestatistics.org/blog/index.php?pk=58295&T=1

As an alternative you can also use a QR Code:  

The GUIDs for individual cells are displayed in the table below:

Multiple Linear Regression - Estimated Regression Equation
britse_pond[t] = + 0.136039597495012 -0.0837778395373193Zwitserse_frank[t] + 1.12933820928760`Britse_pond_-1`[t] -0.155747217813694`Britse_pond_-2`[t] + 0.00722085111187932M1[t] + 0.000961566541320923M2[t] + 0.0125782436648632M3[t] -0.000865431373813849M4[t] + 0.00785537504436781M5[t] + 0.0073783304629954M6[t] + 0.00229776282336032M7[t] + 0.00716246700968827M8[t] + 0.0033528548036246M9[t] + 0.00607844505430859M10[t] + 0.00488969511372625M11[t] + 0.000143463291902331t + e[t]


Multiple Linear Regression - Ordinary Least Squares
VariableParameterS.D.T-STATH0: parameter = 02-tail p-value1-tail p-value
(Intercept)0.1360395974950120.0634362.14450.0378230.018911
Zwitserse_frank-0.08377783953731930.054173-1.54650.1294870.064744
`Britse_pond_-1`1.129338209287600.1495497.551600
`Britse_pond_-2`-0.1557472178136940.169166-0.92070.3624770.181238
M10.007220851111879320.0057271.26080.2143250.107162
M20.0009615665413209230.0057050.16850.8669670.433483
M30.01257824366486320.0057292.19550.0337080.016854
M4-0.0008654313738138490.005805-0.14910.8822070.441104
M50.007855375044367810.0057381.36910.1782520.089126
M60.00737833046299540.0057251.28880.2045270.102264
M70.002297762823360320.0057030.40290.6890550.344527
M80.007162467009688270.00571.25660.2158250.107913
M90.00335285480362460.0056980.58840.5593830.279691
M100.006078445054308590.0056951.06730.2919460.145973
M110.004889695113726250.0059870.81680.4186650.209332
t0.0001434632919023310.0001121.27520.2092320.104616

\begin{tabular}{lllllllll}
\hline
Multiple Linear Regression - Ordinary Least Squares \tabularnewline
Variable & Parameter & S.D. & T-STATH0: parameter = 0 & 2-tail p-value & 1-tail p-value \tabularnewline
(Intercept) & 0.136039597495012 & 0.063436 & 2.1445 & 0.037823 & 0.018911 \tabularnewline
Zwitserse_frank & -0.0837778395373193 & 0.054173 & -1.5465 & 0.129487 & 0.064744 \tabularnewline
`Britse_pond_-1` & 1.12933820928760 & 0.149549 & 7.5516 & 0 & 0 \tabularnewline
`Britse_pond_-2` & -0.155747217813694 & 0.169166 & -0.9207 & 0.362477 & 0.181238 \tabularnewline
M1 & 0.00722085111187932 & 0.005727 & 1.2608 & 0.214325 & 0.107162 \tabularnewline
M2 & 0.000961566541320923 & 0.005705 & 0.1685 & 0.866967 & 0.433483 \tabularnewline
M3 & 0.0125782436648632 & 0.005729 & 2.1955 & 0.033708 & 0.016854 \tabularnewline
M4 & -0.000865431373813849 & 0.005805 & -0.1491 & 0.882207 & 0.441104 \tabularnewline
M5 & 0.00785537504436781 & 0.005738 & 1.3691 & 0.178252 & 0.089126 \tabularnewline
M6 & 0.0073783304629954 & 0.005725 & 1.2888 & 0.204527 & 0.102264 \tabularnewline
M7 & 0.00229776282336032 & 0.005703 & 0.4029 & 0.689055 & 0.344527 \tabularnewline
M8 & 0.00716246700968827 & 0.0057 & 1.2566 & 0.215825 & 0.107913 \tabularnewline
M9 & 0.0033528548036246 & 0.005698 & 0.5884 & 0.559383 & 0.279691 \tabularnewline
M10 & 0.00607844505430859 & 0.005695 & 1.0673 & 0.291946 & 0.145973 \tabularnewline
M11 & 0.00488969511372625 & 0.005987 & 0.8168 & 0.418665 & 0.209332 \tabularnewline
t & 0.000143463291902331 & 0.000112 & 1.2752 & 0.209232 & 0.104616 \tabularnewline
\hline
\end{tabular}
%Source: https://freestatistics.org/blog/index.php?pk=58295&T=2

[TABLE]
[ROW][C]Multiple Linear Regression - Ordinary Least Squares[/C][/ROW]
[ROW][C]Variable[/C][C]Parameter[/C][C]S.D.[/C][C]T-STATH0: parameter = 0[/C][C]2-tail p-value[/C][C]1-tail p-value[/C][/ROW]
[ROW][C](Intercept)[/C][C]0.136039597495012[/C][C]0.063436[/C][C]2.1445[/C][C]0.037823[/C][C]0.018911[/C][/ROW]
[ROW][C]Zwitserse_frank[/C][C]-0.0837778395373193[/C][C]0.054173[/C][C]-1.5465[/C][C]0.129487[/C][C]0.064744[/C][/ROW]
[ROW][C]`Britse_pond_-1`[/C][C]1.12933820928760[/C][C]0.149549[/C][C]7.5516[/C][C]0[/C][C]0[/C][/ROW]
[ROW][C]`Britse_pond_-2`[/C][C]-0.155747217813694[/C][C]0.169166[/C][C]-0.9207[/C][C]0.362477[/C][C]0.181238[/C][/ROW]
[ROW][C]M1[/C][C]0.00722085111187932[/C][C]0.005727[/C][C]1.2608[/C][C]0.214325[/C][C]0.107162[/C][/ROW]
[ROW][C]M2[/C][C]0.000961566541320923[/C][C]0.005705[/C][C]0.1685[/C][C]0.866967[/C][C]0.433483[/C][/ROW]
[ROW][C]M3[/C][C]0.0125782436648632[/C][C]0.005729[/C][C]2.1955[/C][C]0.033708[/C][C]0.016854[/C][/ROW]
[ROW][C]M4[/C][C]-0.000865431373813849[/C][C]0.005805[/C][C]-0.1491[/C][C]0.882207[/C][C]0.441104[/C][/ROW]
[ROW][C]M5[/C][C]0.00785537504436781[/C][C]0.005738[/C][C]1.3691[/C][C]0.178252[/C][C]0.089126[/C][/ROW]
[ROW][C]M6[/C][C]0.0073783304629954[/C][C]0.005725[/C][C]1.2888[/C][C]0.204527[/C][C]0.102264[/C][/ROW]
[ROW][C]M7[/C][C]0.00229776282336032[/C][C]0.005703[/C][C]0.4029[/C][C]0.689055[/C][C]0.344527[/C][/ROW]
[ROW][C]M8[/C][C]0.00716246700968827[/C][C]0.0057[/C][C]1.2566[/C][C]0.215825[/C][C]0.107913[/C][/ROW]
[ROW][C]M9[/C][C]0.0033528548036246[/C][C]0.005698[/C][C]0.5884[/C][C]0.559383[/C][C]0.279691[/C][/ROW]
[ROW][C]M10[/C][C]0.00607844505430859[/C][C]0.005695[/C][C]1.0673[/C][C]0.291946[/C][C]0.145973[/C][/ROW]
[ROW][C]M11[/C][C]0.00488969511372625[/C][C]0.005987[/C][C]0.8168[/C][C]0.418665[/C][C]0.209332[/C][/ROW]
[ROW][C]t[/C][C]0.000143463291902331[/C][C]0.000112[/C][C]1.2752[/C][C]0.209232[/C][C]0.104616[/C][/ROW]
[/TABLE]
Source: https://freestatistics.org/blog/index.php?pk=58295&T=2

Globally Unique Identifier (entire table): ba.freestatistics.org/blog/index.php?pk=58295&T=2

As an alternative you can also use a QR Code:  

The GUIDs for individual cells are displayed in the table below:

Multiple Linear Regression - Ordinary Least Squares
VariableParameterS.D.T-STATH0: parameter = 02-tail p-value1-tail p-value
(Intercept)0.1360395974950120.0634362.14450.0378230.018911
Zwitserse_frank-0.08377783953731930.054173-1.54650.1294870.064744
`Britse_pond_-1`1.129338209287600.1495497.551600
`Britse_pond_-2`-0.1557472178136940.169166-0.92070.3624770.181238
M10.007220851111879320.0057271.26080.2143250.107162
M20.0009615665413209230.0057050.16850.8669670.433483
M30.01257824366486320.0057292.19550.0337080.016854
M4-0.0008654313738138490.005805-0.14910.8822070.441104
M50.007855375044367810.0057381.36910.1782520.089126
M60.00737833046299540.0057251.28880.2045270.102264
M70.002297762823360320.0057030.40290.6890550.344527
M80.007162467009688270.00571.25660.2158250.107913
M90.00335285480362460.0056980.58840.5593830.279691
M100.006078445054308590.0056951.06730.2919460.145973
M110.004889695113726250.0059870.81680.4186650.209332
t0.0001434632919023310.0001121.27520.2092320.104616


Multiple Linear Regression - Regression Statistics
Multiple R0.973851080073204
R-squared0.948385926159746
Adjusted R-squared0.929952328359655
F-TEST (value)51.4487696023764
F-TEST (DF numerator)15
F-TEST (DF denominator)42
p-value0
Multiple Linear Regression - Residual Statistics
Residual Standard Deviation0.00845799712280262
Sum Squared Residuals0.00300458404383217

\begin{tabular}{lllllllll}
\hline
Multiple Linear Regression - Regression Statistics \tabularnewline
Multiple R & 0.973851080073204 \tabularnewline
R-squared & 0.948385926159746 \tabularnewline
Adjusted R-squared & 0.929952328359655 \tabularnewline
F-TEST (value) & 51.4487696023764 \tabularnewline
F-TEST (DF numerator) & 15 \tabularnewline
F-TEST (DF denominator) & 42 \tabularnewline
p-value & 0 \tabularnewline
Multiple Linear Regression - Residual Statistics \tabularnewline
Residual Standard Deviation & 0.00845799712280262 \tabularnewline
Sum Squared Residuals & 0.00300458404383217 \tabularnewline
\hline
\end{tabular}
%Source: https://freestatistics.org/blog/index.php?pk=58295&T=3

[TABLE]
[ROW][C]Multiple Linear Regression - Regression Statistics[/C][/ROW]
[ROW][C]Multiple R[/C][C]0.973851080073204[/C][/ROW]
[ROW][C]R-squared[/C][C]0.948385926159746[/C][/ROW]
[ROW][C]Adjusted R-squared[/C][C]0.929952328359655[/C][/ROW]
[ROW][C]F-TEST (value)[/C][C]51.4487696023764[/C][/ROW]
[ROW][C]F-TEST (DF numerator)[/C][C]15[/C][/ROW]
[ROW][C]F-TEST (DF denominator)[/C][C]42[/C][/ROW]
[ROW][C]p-value[/C][C]0[/C][/ROW]
[ROW][C]Multiple Linear Regression - Residual Statistics[/C][/ROW]
[ROW][C]Residual Standard Deviation[/C][C]0.00845799712280262[/C][/ROW]
[ROW][C]Sum Squared Residuals[/C][C]0.00300458404383217[/C][/ROW]
[/TABLE]
Source: https://freestatistics.org/blog/index.php?pk=58295&T=3

Globally Unique Identifier (entire table): ba.freestatistics.org/blog/index.php?pk=58295&T=3

As an alternative you can also use a QR Code:  

The GUIDs for individual cells are displayed in the table below:

Multiple Linear Regression - Regression Statistics
Multiple R0.973851080073204
R-squared0.948385926159746
Adjusted R-squared0.929952328359655
F-TEST (value)51.4487696023764
F-TEST (DF numerator)15
F-TEST (DF denominator)42
p-value0
Multiple Linear Regression - Residual Statistics
Residual Standard Deviation0.00845799712280262
Sum Squared Residuals0.00300458404383217


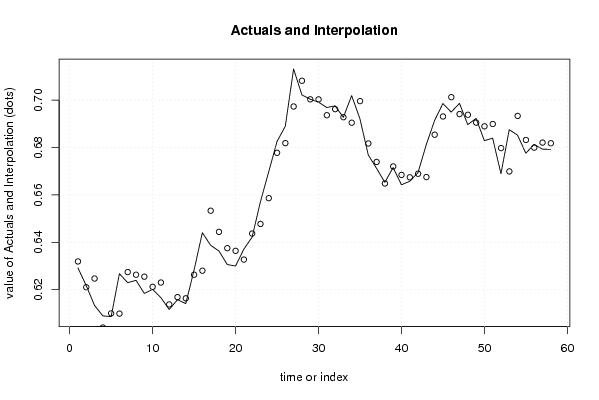
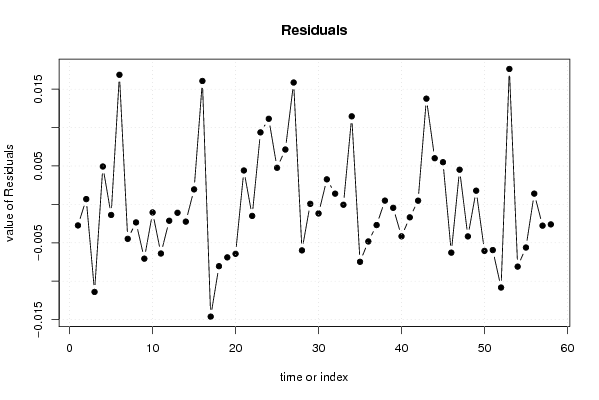
Multiple Linear Regression - Actuals, Interpolation, and Residuals
Time or IndexActualsInterpolationForecastResidualsPrediction Error
10.629150.631895130109449-0.00274513010944870
20.621680.6209963055988520.000683694401148332
30.613280.624681907751489-0.0114019077514888
40.60890.6039718652147230.00492813478527658
50.608570.609951910753599-0.00138191075359847
60.626720.6098524206135040.0168675793864960
70.622910.627399469439532-0.00448946943953186
80.623930.626283380411506-0.00235338041150552
90.618380.625451665284673-0.00707166528467286
100.620120.621173540183522-0.00105354018352215
110.616590.622991210213683-0.0064012102136835
120.61160.613736080835466-0.00213608083546645
130.615730.616827430297297-0.00109743029729740
140.614070.616320510118964-0.00225051011896407
150.628230.6262832025174420.00194679748255837
160.644050.6279846703866440.016065329613356
170.63870.653322335006928-0.014622335006928
180.636330.644382339904512-0.00805233990451194
190.630590.637493040424672-0.00690304042467217
200.629940.636379549703856-0.00643954970385632
210.637090.6326806309529730.00440936904702711
220.642170.643675421679822-0.00150542167982209
230.657110.6477394919962720.00937050800372833
240.669770.6586303546051630.0111396453948369
250.682550.6777892938413610.00476070615863913
260.689020.6818810312163250.00713896878367483
270.713220.6973573836670390.0158626163329613
280.702240.708234759393614-0.00599475939361406
290.700450.7003852569376366.47430623638514e-05
300.699190.700376976285619-0.00118697628561933
310.696930.6936757373014940.00325426269850557
320.697630.6962356862976890.00139431370231089
330.692780.692832395527146-5.23955271461109e-05
340.701960.690500513764090.0114594862359105
350.692150.699631236296295-0.00748123629629452
360.67690.681731347817392-0.00483134781739225
370.671240.673937312909329-0.00269731290932901
380.665320.6648350498640730.000484950135927078
390.671570.672022571574559-0.000452571574559055
400.664280.668445326227665-0.00416532622766519
410.665760.667449833132316-0.00168983313231583
420.669420.6689428688878670.000477131112133344
430.68130.6675400140097980.0137599859902020
440.691440.6854365735169360.00600342648306443
450.698620.6931309717276080.0054890282723924
460.6950.701289484799096-0.00628948479909576
470.698670.694158061493750.00451193850624968
480.689680.693852216741978-0.00417221674197820
490.692330.6905508328425640.00177916715743597
500.682930.688987103201786-0.00605710320178615
510.683990.689944934489472-0.0059549344894718
520.668950.679783378777353-0.0108333787773533
530.687560.6699306641695220.0176293358304785
540.685270.693375394308498-0.0081053943084981
550.67760.683221738824503-0.0056217388245035
560.681370.6799748100700130.00139518992998652
570.679330.6821043365076-0.00277433650760055
580.679220.68183103957347-0.00261103957347046

\begin{tabular}{lllllllll}
\hline
Multiple Linear Regression - Actuals, Interpolation, and Residuals \tabularnewline
Time or Index & Actuals & InterpolationForecast & ResidualsPrediction Error \tabularnewline
1 & 0.62915 & 0.631895130109449 & -0.00274513010944870 \tabularnewline
2 & 0.62168 & 0.620996305598852 & 0.000683694401148332 \tabularnewline
3 & 0.61328 & 0.624681907751489 & -0.0114019077514888 \tabularnewline
4 & 0.6089 & 0.603971865214723 & 0.00492813478527658 \tabularnewline
5 & 0.60857 & 0.609951910753599 & -0.00138191075359847 \tabularnewline
6 & 0.62672 & 0.609852420613504 & 0.0168675793864960 \tabularnewline
7 & 0.62291 & 0.627399469439532 & -0.00448946943953186 \tabularnewline
8 & 0.62393 & 0.626283380411506 & -0.00235338041150552 \tabularnewline
9 & 0.61838 & 0.625451665284673 & -0.00707166528467286 \tabularnewline
10 & 0.62012 & 0.621173540183522 & -0.00105354018352215 \tabularnewline
11 & 0.61659 & 0.622991210213683 & -0.0064012102136835 \tabularnewline
12 & 0.6116 & 0.613736080835466 & -0.00213608083546645 \tabularnewline
13 & 0.61573 & 0.616827430297297 & -0.00109743029729740 \tabularnewline
14 & 0.61407 & 0.616320510118964 & -0.00225051011896407 \tabularnewline
15 & 0.62823 & 0.626283202517442 & 0.00194679748255837 \tabularnewline
16 & 0.64405 & 0.627984670386644 & 0.016065329613356 \tabularnewline
17 & 0.6387 & 0.653322335006928 & -0.014622335006928 \tabularnewline
18 & 0.63633 & 0.644382339904512 & -0.00805233990451194 \tabularnewline
19 & 0.63059 & 0.637493040424672 & -0.00690304042467217 \tabularnewline
20 & 0.62994 & 0.636379549703856 & -0.00643954970385632 \tabularnewline
21 & 0.63709 & 0.632680630952973 & 0.00440936904702711 \tabularnewline
22 & 0.64217 & 0.643675421679822 & -0.00150542167982209 \tabularnewline
23 & 0.65711 & 0.647739491996272 & 0.00937050800372833 \tabularnewline
24 & 0.66977 & 0.658630354605163 & 0.0111396453948369 \tabularnewline
25 & 0.68255 & 0.677789293841361 & 0.00476070615863913 \tabularnewline
26 & 0.68902 & 0.681881031216325 & 0.00713896878367483 \tabularnewline
27 & 0.71322 & 0.697357383667039 & 0.0158626163329613 \tabularnewline
28 & 0.70224 & 0.708234759393614 & -0.00599475939361406 \tabularnewline
29 & 0.70045 & 0.700385256937636 & 6.47430623638514e-05 \tabularnewline
30 & 0.69919 & 0.700376976285619 & -0.00118697628561933 \tabularnewline
31 & 0.69693 & 0.693675737301494 & 0.00325426269850557 \tabularnewline
32 & 0.69763 & 0.696235686297689 & 0.00139431370231089 \tabularnewline
33 & 0.69278 & 0.692832395527146 & -5.23955271461109e-05 \tabularnewline
34 & 0.70196 & 0.69050051376409 & 0.0114594862359105 \tabularnewline
35 & 0.69215 & 0.699631236296295 & -0.00748123629629452 \tabularnewline
36 & 0.6769 & 0.681731347817392 & -0.00483134781739225 \tabularnewline
37 & 0.67124 & 0.673937312909329 & -0.00269731290932901 \tabularnewline
38 & 0.66532 & 0.664835049864073 & 0.000484950135927078 \tabularnewline
39 & 0.67157 & 0.672022571574559 & -0.000452571574559055 \tabularnewline
40 & 0.66428 & 0.668445326227665 & -0.00416532622766519 \tabularnewline
41 & 0.66576 & 0.667449833132316 & -0.00168983313231583 \tabularnewline
42 & 0.66942 & 0.668942868887867 & 0.000477131112133344 \tabularnewline
43 & 0.6813 & 0.667540014009798 & 0.0137599859902020 \tabularnewline
44 & 0.69144 & 0.685436573516936 & 0.00600342648306443 \tabularnewline
45 & 0.69862 & 0.693130971727608 & 0.0054890282723924 \tabularnewline
46 & 0.695 & 0.701289484799096 & -0.00628948479909576 \tabularnewline
47 & 0.69867 & 0.69415806149375 & 0.00451193850624968 \tabularnewline
48 & 0.68968 & 0.693852216741978 & -0.00417221674197820 \tabularnewline
49 & 0.69233 & 0.690550832842564 & 0.00177916715743597 \tabularnewline
50 & 0.68293 & 0.688987103201786 & -0.00605710320178615 \tabularnewline
51 & 0.68399 & 0.689944934489472 & -0.0059549344894718 \tabularnewline
52 & 0.66895 & 0.679783378777353 & -0.0108333787773533 \tabularnewline
53 & 0.68756 & 0.669930664169522 & 0.0176293358304785 \tabularnewline
54 & 0.68527 & 0.693375394308498 & -0.0081053943084981 \tabularnewline
55 & 0.6776 & 0.683221738824503 & -0.0056217388245035 \tabularnewline
56 & 0.68137 & 0.679974810070013 & 0.00139518992998652 \tabularnewline
57 & 0.67933 & 0.6821043365076 & -0.00277433650760055 \tabularnewline
58 & 0.67922 & 0.68183103957347 & -0.00261103957347046 \tabularnewline
\hline
\end{tabular}
%Source: https://freestatistics.org/blog/index.php?pk=58295&T=4

[TABLE]
[ROW][C]Multiple Linear Regression - Actuals, Interpolation, and Residuals[/C][/ROW]
[ROW][C]Time or Index[/C][C]Actuals[/C][C]InterpolationForecast[/C][C]ResidualsPrediction Error[/C][/ROW]
[ROW][C]1[/C][C]0.62915[/C][C]0.631895130109449[/C][C]-0.00274513010944870[/C][/ROW]
[ROW][C]2[/C][C]0.62168[/C][C]0.620996305598852[/C][C]0.000683694401148332[/C][/ROW]
[ROW][C]3[/C][C]0.61328[/C][C]0.624681907751489[/C][C]-0.0114019077514888[/C][/ROW]
[ROW][C]4[/C][C]0.6089[/C][C]0.603971865214723[/C][C]0.00492813478527658[/C][/ROW]
[ROW][C]5[/C][C]0.60857[/C][C]0.609951910753599[/C][C]-0.00138191075359847[/C][/ROW]
[ROW][C]6[/C][C]0.62672[/C][C]0.609852420613504[/C][C]0.0168675793864960[/C][/ROW]
[ROW][C]7[/C][C]0.62291[/C][C]0.627399469439532[/C][C]-0.00448946943953186[/C][/ROW]
[ROW][C]8[/C][C]0.62393[/C][C]0.626283380411506[/C][C]-0.00235338041150552[/C][/ROW]
[ROW][C]9[/C][C]0.61838[/C][C]0.625451665284673[/C][C]-0.00707166528467286[/C][/ROW]
[ROW][C]10[/C][C]0.62012[/C][C]0.621173540183522[/C][C]-0.00105354018352215[/C][/ROW]
[ROW][C]11[/C][C]0.61659[/C][C]0.622991210213683[/C][C]-0.0064012102136835[/C][/ROW]
[ROW][C]12[/C][C]0.6116[/C][C]0.613736080835466[/C][C]-0.00213608083546645[/C][/ROW]
[ROW][C]13[/C][C]0.61573[/C][C]0.616827430297297[/C][C]-0.00109743029729740[/C][/ROW]
[ROW][C]14[/C][C]0.61407[/C][C]0.616320510118964[/C][C]-0.00225051011896407[/C][/ROW]
[ROW][C]15[/C][C]0.62823[/C][C]0.626283202517442[/C][C]0.00194679748255837[/C][/ROW]
[ROW][C]16[/C][C]0.64405[/C][C]0.627984670386644[/C][C]0.016065329613356[/C][/ROW]
[ROW][C]17[/C][C]0.6387[/C][C]0.653322335006928[/C][C]-0.014622335006928[/C][/ROW]
[ROW][C]18[/C][C]0.63633[/C][C]0.644382339904512[/C][C]-0.00805233990451194[/C][/ROW]
[ROW][C]19[/C][C]0.63059[/C][C]0.637493040424672[/C][C]-0.00690304042467217[/C][/ROW]
[ROW][C]20[/C][C]0.62994[/C][C]0.636379549703856[/C][C]-0.00643954970385632[/C][/ROW]
[ROW][C]21[/C][C]0.63709[/C][C]0.632680630952973[/C][C]0.00440936904702711[/C][/ROW]
[ROW][C]22[/C][C]0.64217[/C][C]0.643675421679822[/C][C]-0.00150542167982209[/C][/ROW]
[ROW][C]23[/C][C]0.65711[/C][C]0.647739491996272[/C][C]0.00937050800372833[/C][/ROW]
[ROW][C]24[/C][C]0.66977[/C][C]0.658630354605163[/C][C]0.0111396453948369[/C][/ROW]
[ROW][C]25[/C][C]0.68255[/C][C]0.677789293841361[/C][C]0.00476070615863913[/C][/ROW]
[ROW][C]26[/C][C]0.68902[/C][C]0.681881031216325[/C][C]0.00713896878367483[/C][/ROW]
[ROW][C]27[/C][C]0.71322[/C][C]0.697357383667039[/C][C]0.0158626163329613[/C][/ROW]
[ROW][C]28[/C][C]0.70224[/C][C]0.708234759393614[/C][C]-0.00599475939361406[/C][/ROW]
[ROW][C]29[/C][C]0.70045[/C][C]0.700385256937636[/C][C]6.47430623638514e-05[/C][/ROW]
[ROW][C]30[/C][C]0.69919[/C][C]0.700376976285619[/C][C]-0.00118697628561933[/C][/ROW]
[ROW][C]31[/C][C]0.69693[/C][C]0.693675737301494[/C][C]0.00325426269850557[/C][/ROW]
[ROW][C]32[/C][C]0.69763[/C][C]0.696235686297689[/C][C]0.00139431370231089[/C][/ROW]
[ROW][C]33[/C][C]0.69278[/C][C]0.692832395527146[/C][C]-5.23955271461109e-05[/C][/ROW]
[ROW][C]34[/C][C]0.70196[/C][C]0.69050051376409[/C][C]0.0114594862359105[/C][/ROW]
[ROW][C]35[/C][C]0.69215[/C][C]0.699631236296295[/C][C]-0.00748123629629452[/C][/ROW]
[ROW][C]36[/C][C]0.6769[/C][C]0.681731347817392[/C][C]-0.00483134781739225[/C][/ROW]
[ROW][C]37[/C][C]0.67124[/C][C]0.673937312909329[/C][C]-0.00269731290932901[/C][/ROW]
[ROW][C]38[/C][C]0.66532[/C][C]0.664835049864073[/C][C]0.000484950135927078[/C][/ROW]
[ROW][C]39[/C][C]0.67157[/C][C]0.672022571574559[/C][C]-0.000452571574559055[/C][/ROW]
[ROW][C]40[/C][C]0.66428[/C][C]0.668445326227665[/C][C]-0.00416532622766519[/C][/ROW]
[ROW][C]41[/C][C]0.66576[/C][C]0.667449833132316[/C][C]-0.00168983313231583[/C][/ROW]
[ROW][C]42[/C][C]0.66942[/C][C]0.668942868887867[/C][C]0.000477131112133344[/C][/ROW]
[ROW][C]43[/C][C]0.6813[/C][C]0.667540014009798[/C][C]0.0137599859902020[/C][/ROW]
[ROW][C]44[/C][C]0.69144[/C][C]0.685436573516936[/C][C]0.00600342648306443[/C][/ROW]
[ROW][C]45[/C][C]0.69862[/C][C]0.693130971727608[/C][C]0.0054890282723924[/C][/ROW]
[ROW][C]46[/C][C]0.695[/C][C]0.701289484799096[/C][C]-0.00628948479909576[/C][/ROW]
[ROW][C]47[/C][C]0.69867[/C][C]0.69415806149375[/C][C]0.00451193850624968[/C][/ROW]
[ROW][C]48[/C][C]0.68968[/C][C]0.693852216741978[/C][C]-0.00417221674197820[/C][/ROW]
[ROW][C]49[/C][C]0.69233[/C][C]0.690550832842564[/C][C]0.00177916715743597[/C][/ROW]
[ROW][C]50[/C][C]0.68293[/C][C]0.688987103201786[/C][C]-0.00605710320178615[/C][/ROW]
[ROW][C]51[/C][C]0.68399[/C][C]0.689944934489472[/C][C]-0.0059549344894718[/C][/ROW]
[ROW][C]52[/C][C]0.66895[/C][C]0.679783378777353[/C][C]-0.0108333787773533[/C][/ROW]
[ROW][C]53[/C][C]0.68756[/C][C]0.669930664169522[/C][C]0.0176293358304785[/C][/ROW]
[ROW][C]54[/C][C]0.68527[/C][C]0.693375394308498[/C][C]-0.0081053943084981[/C][/ROW]
[ROW][C]55[/C][C]0.6776[/C][C]0.683221738824503[/C][C]-0.0056217388245035[/C][/ROW]
[ROW][C]56[/C][C]0.68137[/C][C]0.679974810070013[/C][C]0.00139518992998652[/C][/ROW]
[ROW][C]57[/C][C]0.67933[/C][C]0.6821043365076[/C][C]-0.00277433650760055[/C][/ROW]
[ROW][C]58[/C][C]0.67922[/C][C]0.68183103957347[/C][C]-0.00261103957347046[/C][/ROW]
[/TABLE]
Source: https://freestatistics.org/blog/index.php?pk=58295&T=4

Globally Unique Identifier (entire table): ba.freestatistics.org/blog/index.php?pk=58295&T=4

As an alternative you can also use a QR Code:  

The GUIDs for individual cells are displayed in the table below:

Multiple Linear Regression - Actuals, Interpolation, and Residuals
Time or IndexActualsInterpolationForecastResidualsPrediction Error
10.629150.631895130109449-0.00274513010944870
20.621680.6209963055988520.000683694401148332
30.613280.624681907751489-0.0114019077514888
40.60890.6039718652147230.00492813478527658
50.608570.609951910753599-0.00138191075359847
60.626720.6098524206135040.0168675793864960
70.622910.627399469439532-0.00448946943953186
80.623930.626283380411506-0.00235338041150552
90.618380.625451665284673-0.00707166528467286
100.620120.621173540183522-0.00105354018352215
110.616590.622991210213683-0.0064012102136835
120.61160.613736080835466-0.00213608083546645
130.615730.616827430297297-0.00109743029729740
140.614070.616320510118964-0.00225051011896407
150.628230.6262832025174420.00194679748255837
160.644050.6279846703866440.016065329613356
170.63870.653322335006928-0.014622335006928
180.636330.644382339904512-0.00805233990451194
190.630590.637493040424672-0.00690304042467217
200.629940.636379549703856-0.00643954970385632
210.637090.6326806309529730.00440936904702711
220.642170.643675421679822-0.00150542167982209
230.657110.6477394919962720.00937050800372833
240.669770.6586303546051630.0111396453948369
250.682550.6777892938413610.00476070615863913
260.689020.6818810312163250.00713896878367483
270.713220.6973573836670390.0158626163329613
280.702240.708234759393614-0.00599475939361406
290.700450.7003852569376366.47430623638514e-05
300.699190.700376976285619-0.00118697628561933
310.696930.6936757373014940.00325426269850557
320.697630.6962356862976890.00139431370231089
330.692780.692832395527146-5.23955271461109e-05
340.701960.690500513764090.0114594862359105
350.692150.699631236296295-0.00748123629629452
360.67690.681731347817392-0.00483134781739225
370.671240.673937312909329-0.00269731290932901
380.665320.6648350498640730.000484950135927078
390.671570.672022571574559-0.000452571574559055
400.664280.668445326227665-0.00416532622766519
410.665760.667449833132316-0.00168983313231583
420.669420.6689428688878670.000477131112133344
430.68130.6675400140097980.0137599859902020
440.691440.6854365735169360.00600342648306443
450.698620.6931309717276080.0054890282723924
460.6950.701289484799096-0.00628948479909576
470.698670.694158061493750.00451193850624968
480.689680.693852216741978-0.00417221674197820
490.692330.6905508328425640.00177916715743597
500.682930.688987103201786-0.00605710320178615
510.683990.689944934489472-0.0059549344894718
520.668950.679783378777353-0.0108333787773533
530.687560.6699306641695220.0176293358304785
540.685270.693375394308498-0.0081053943084981
550.67760.683221738824503-0.0056217388245035
560.681370.6799748100700130.00139518992998652
570.679330.6821043365076-0.00277433650760055
580.679220.68183103957347-0.00261103957347046


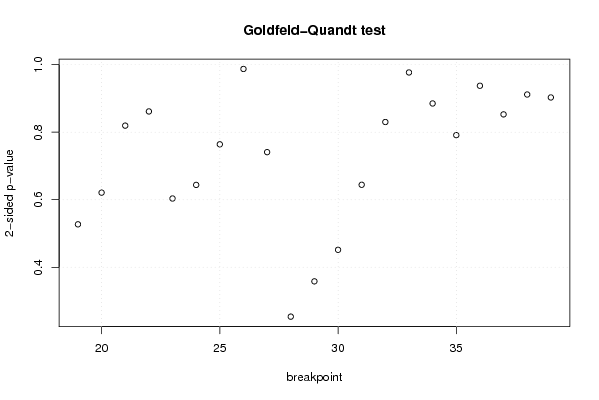
Goldfeld-Quandt test for Heteroskedasticity
p-valuesAlternative Hypothesis
breakpoint indexgreater2-sidedless
190.7363962684035150.5272074631929710.263603731596485
200.6894963667670470.6210072664659070.310503633232953
210.5902864245554730.8194271508890530.409713575444527
220.5692521411893960.8614957176212080.430747858810604
230.6981870111063440.6036259777873120.301812988893656
240.6780578636115380.6438842727769250.321942136388462
250.6179433063707040.7641133872585930.382056693629296
260.506349264345760.987301471308480.49365073565424
270.6295368472263880.7409263055472230.370463152773612
280.8731241882904540.2537516234190910.126875811709546
290.8208529484797330.3582941030405350.179147051520267
300.7741823631112950.4516352737774110.225817636888705
310.677866611403910.644266777192180.32213338859609
320.5849395121867650.830120975626470.415060487813235
330.5115271657410980.9769456685178040.488472834258902
340.5574294854489180.8851410291021640.442570514551082
350.6043494662575980.7913010674848040.395650533742402
360.5312362887082110.9375274225835770.468763711291789
370.5736117459890050.852776508021990.426388254010995
380.5441851242558410.9116297514883180.455814875744159
390.4514434296021180.9028868592042370.548556570397882

\begin{tabular}{lllllllll}
\hline
Goldfeld-Quandt test for Heteroskedasticity \tabularnewline
p-values & Alternative Hypothesis \tabularnewline
breakpoint index & greater & 2-sided & less \tabularnewline
19 & 0.736396268403515 & 0.527207463192971 & 0.263603731596485 \tabularnewline
20 & 0.689496366767047 & 0.621007266465907 & 0.310503633232953 \tabularnewline
21 & 0.590286424555473 & 0.819427150889053 & 0.409713575444527 \tabularnewline
22 & 0.569252141189396 & 0.861495717621208 & 0.430747858810604 \tabularnewline
23 & 0.698187011106344 & 0.603625977787312 & 0.301812988893656 \tabularnewline
24 & 0.678057863611538 & 0.643884272776925 & 0.321942136388462 \tabularnewline
25 & 0.617943306370704 & 0.764113387258593 & 0.382056693629296 \tabularnewline
26 & 0.50634926434576 & 0.98730147130848 & 0.49365073565424 \tabularnewline
27 & 0.629536847226388 & 0.740926305547223 & 0.370463152773612 \tabularnewline
28 & 0.873124188290454 & 0.253751623419091 & 0.126875811709546 \tabularnewline
29 & 0.820852948479733 & 0.358294103040535 & 0.179147051520267 \tabularnewline
30 & 0.774182363111295 & 0.451635273777411 & 0.225817636888705 \tabularnewline
31 & 0.67786661140391 & 0.64426677719218 & 0.32213338859609 \tabularnewline
32 & 0.584939512186765 & 0.83012097562647 & 0.415060487813235 \tabularnewline
33 & 0.511527165741098 & 0.976945668517804 & 0.488472834258902 \tabularnewline
34 & 0.557429485448918 & 0.885141029102164 & 0.442570514551082 \tabularnewline
35 & 0.604349466257598 & 0.791301067484804 & 0.395650533742402 \tabularnewline
36 & 0.531236288708211 & 0.937527422583577 & 0.468763711291789 \tabularnewline
37 & 0.573611745989005 & 0.85277650802199 & 0.426388254010995 \tabularnewline
38 & 0.544185124255841 & 0.911629751488318 & 0.455814875744159 \tabularnewline
39 & 0.451443429602118 & 0.902886859204237 & 0.548556570397882 \tabularnewline
\hline
\end{tabular}
%Source: https://freestatistics.org/blog/index.php?pk=58295&T=5

[TABLE]
[ROW][C]Goldfeld-Quandt test for Heteroskedasticity[/C][/ROW]
[ROW][C]p-values[/C][C]Alternative Hypothesis[/C][/ROW]
[ROW][C]breakpoint index[/C][C]greater[/C][C]2-sided[/C][C]less[/C][/ROW]
[ROW][C]19[/C][C]0.736396268403515[/C][C]0.527207463192971[/C][C]0.263603731596485[/C][/ROW]
[ROW][C]20[/C][C]0.689496366767047[/C][C]0.621007266465907[/C][C]0.310503633232953[/C][/ROW]
[ROW][C]21[/C][C]0.590286424555473[/C][C]0.819427150889053[/C][C]0.409713575444527[/C][/ROW]
[ROW][C]22[/C][C]0.569252141189396[/C][C]0.861495717621208[/C][C]0.430747858810604[/C][/ROW]
[ROW][C]23[/C][C]0.698187011106344[/C][C]0.603625977787312[/C][C]0.301812988893656[/C][/ROW]
[ROW][C]24[/C][C]0.678057863611538[/C][C]0.643884272776925[/C][C]0.321942136388462[/C][/ROW]
[ROW][C]25[/C][C]0.617943306370704[/C][C]0.764113387258593[/C][C]0.382056693629296[/C][/ROW]
[ROW][C]26[/C][C]0.50634926434576[/C][C]0.98730147130848[/C][C]0.49365073565424[/C][/ROW]
[ROW][C]27[/C][C]0.629536847226388[/C][C]0.740926305547223[/C][C]0.370463152773612[/C][/ROW]
[ROW][C]28[/C][C]0.873124188290454[/C][C]0.253751623419091[/C][C]0.126875811709546[/C][/ROW]
[ROW][C]29[/C][C]0.820852948479733[/C][C]0.358294103040535[/C][C]0.179147051520267[/C][/ROW]
[ROW][C]30[/C][C]0.774182363111295[/C][C]0.451635273777411[/C][C]0.225817636888705[/C][/ROW]
[ROW][C]31[/C][C]0.67786661140391[/C][C]0.64426677719218[/C][C]0.32213338859609[/C][/ROW]
[ROW][C]32[/C][C]0.584939512186765[/C][C]0.83012097562647[/C][C]0.415060487813235[/C][/ROW]
[ROW][C]33[/C][C]0.511527165741098[/C][C]0.976945668517804[/C][C]0.488472834258902[/C][/ROW]
[ROW][C]34[/C][C]0.557429485448918[/C][C]0.885141029102164[/C][C]0.442570514551082[/C][/ROW]
[ROW][C]35[/C][C]0.604349466257598[/C][C]0.791301067484804[/C][C]0.395650533742402[/C][/ROW]
[ROW][C]36[/C][C]0.531236288708211[/C][C]0.937527422583577[/C][C]0.468763711291789[/C][/ROW]
[ROW][C]37[/C][C]0.573611745989005[/C][C]0.85277650802199[/C][C]0.426388254010995[/C][/ROW]
[ROW][C]38[/C][C]0.544185124255841[/C][C]0.911629751488318[/C][C]0.455814875744159[/C][/ROW]
[ROW][C]39[/C][C]0.451443429602118[/C][C]0.902886859204237[/C][C]0.548556570397882[/C][/ROW]
[/TABLE]
Source: https://freestatistics.org/blog/index.php?pk=58295&T=5

Globally Unique Identifier (entire table): ba.freestatistics.org/blog/index.php?pk=58295&T=5

As an alternative you can also use a QR Code:  

The GUIDs for individual cells are displayed in the table below:

Goldfeld-Quandt test for Heteroskedasticity
p-valuesAlternative Hypothesis
breakpoint indexgreater2-sidedless
190.7363962684035150.5272074631929710.263603731596485
200.6894963667670470.6210072664659070.310503633232953
210.5902864245554730.8194271508890530.409713575444527
220.5692521411893960.8614957176212080.430747858810604
230.6981870111063440.6036259777873120.301812988893656
240.6780578636115380.6438842727769250.321942136388462
250.6179433063707040.7641133872585930.382056693629296
260.506349264345760.987301471308480.49365073565424
270.6295368472263880.7409263055472230.370463152773612
280.8731241882904540.2537516234190910.126875811709546
290.8208529484797330.3582941030405350.179147051520267
300.7741823631112950.4516352737774110.225817636888705
310.677866611403910.644266777192180.32213338859609
320.5849395121867650.830120975626470.415060487813235
330.5115271657410980.9769456685178040.488472834258902
340.5574294854489180.8851410291021640.442570514551082
350.6043494662575980.7913010674848040.395650533742402
360.5312362887082110.9375274225835770.468763711291789
370.5736117459890050.852776508021990.426388254010995
380.5441851242558410.9116297514883180.455814875744159
390.4514434296021180.9028868592042370.548556570397882


Meta Analysis of Goldfeld-Quandt test for Heteroskedasticity
Description# significant tests% significant testsOK/NOK
1% type I error level00OK
5% type I error level00OK
10% type I error level00OK

\begin{tabular}{lllllllll}
\hline
Meta Analysis of Goldfeld-Quandt test for Heteroskedasticity \tabularnewline
Description & # significant tests & % significant tests & OK/NOK \tabularnewline
1% type I error level & 0 & 0 & OK \tabularnewline
5% type I error level & 0 & 0 & OK \tabularnewline
10% type I error level & 0 & 0 & OK \tabularnewline
\hline
\end{tabular}
%Source: https://freestatistics.org/blog/index.php?pk=58295&T=6

[TABLE]
[ROW][C]Meta Analysis of Goldfeld-Quandt test for Heteroskedasticity[/C][/ROW]
[ROW][C]Description[/C][C]# significant tests[/C][C]% significant tests[/C][C]OK/NOK[/C][/ROW]
[ROW][C]1% type I error level[/C][C]0[/C][C]0[/C][C]OK[/C][/ROW]
[ROW][C]5% type I error level[/C][C]0[/C][C]0[/C][C]OK[/C][/ROW]
[ROW][C]10% type I error level[/C][C]0[/C][C]0[/C][C]OK[/C][/ROW]
[/TABLE]
Source: https://freestatistics.org/blog/index.php?pk=58295&T=6

Globally Unique Identifier (entire table): ba.freestatistics.org/blog/index.php?pk=58295&T=6

As an alternative you can also use a QR Code:  

The GUIDs for individual cells are displayed in the table below:

Meta Analysis of Goldfeld-Quandt test for Heteroskedasticity
Description# significant tests% significant testsOK/NOK
1% type I error level00OK
5% type I error level00OK
10% type I error level00OK


Parameters (Session):
par1 = 1 ; par2 = Include Monthly Dummies ; par3 = Linear Trend ;
Parameters (R input):
par1 = 1 ; par2 = Include Monthly Dummies ; par3 = Linear Trend ;
R code (references can be found in the software module):
library(lattice)
library(lmtest)
n25 <- 25 #minimum number of obs. for Goldfeld-Quandt test
par1 <- as.numeric(par1)
x <- t(y)
k <- length(x[1,])
n <- length(x[,1])
x1 <- cbind(x[,par1], x[,1:k!=par1])
mycolnames <- c(colnames(x)[par1], colnames(x)[1:k!=par1])
colnames(x1) <- mycolnames #colnames(x)[par1]
x <- x1
if (par3 == 'First Differences'){
x2 <- array(0, dim=c(n-1,k), dimnames=list(1:(n-1), paste('(1-B)',colnames(x),sep='')))
for (i in 1:n-1) {
for (j in 1:k) {
x2[i,j] <- x[i+1,j] - x[i,j]
}
}
x <- x2
}
if (par2 == 'Include Monthly Dummies'){
x2 <- array(0, dim=c(n,11), dimnames=list(1:n, paste('M', seq(1:11), sep ='')))
for (i in 1:11){
x2[seq(i,n,12),i] <- 1
}
x <- cbind(x, x2)
}
if (par2 == 'Include Quarterly Dummies'){
x2 <- array(0, dim=c(n,3), dimnames=list(1:n, paste('Q', seq(1:3), sep ='')))
for (i in 1:3){
x2[seq(i,n,4),i] <- 1
}
x <- cbind(x, x2)
}
k <- length(x[1,])
if (par3 == 'Linear Trend'){
x <- cbind(x, c(1:n))
colnames(x)[k+1] <- 't'
}
x
k <- length(x[1,])
df <- as.data.frame(x)
(mylm <- lm(df))
(mysum <- summary(mylm))
if (n > n25) {
kp3 <- k + 3
nmkm3 <- n - k - 3
gqarr <- array(NA, dim=c(nmkm3-kp3+1,3))
numgqtests <- 0
numsignificant1 <- 0
numsignificant5 <- 0
numsignificant10 <- 0
for (mypoint in kp3:nmkm3) {
j <- 0
numgqtests <- numgqtests + 1
for (myalt in c('greater', 'two.sided', 'less')) {
j <- j + 1
gqarr[mypoint-kp3+1,j] <- gqtest(mylm, point=mypoint, alternative=myalt)$p.value
}
if (gqarr[mypoint-kp3+1,2] < 0.01) numsignificant1 <- numsignificant1 + 1
if (gqarr[mypoint-kp3+1,2] < 0.05) numsignificant5 <- numsignificant5 + 1
if (gqarr[mypoint-kp3+1,2] < 0.10) numsignificant10 <- numsignificant10 + 1
}
gqarr
}
bitmap(file='test0.png')
plot(x[,1], type='l', main='Actuals and Interpolation', ylab='value of Actuals and Interpolation (dots)', xlab='time or index')
points(x[,1]-mysum$resid)
grid()
dev.off()
bitmap(file='test1.png')
plot(mysum$resid, type='b', pch=19, main='Residuals', ylab='value of Residuals', xlab='time or index')
grid()
dev.off()
bitmap(file='test2.png')
hist(mysum$resid, main='Residual Histogram', xlab='values of Residuals')
grid()
dev.off()
bitmap(file='test3.png')
densityplot(~mysum$resid,col='black',main='Residual Density Plot', xlab='values of Residuals')
dev.off()
bitmap(file='test4.png')
qqnorm(mysum$resid, main='Residual Normal Q-Q Plot')
qqline(mysum$resid)
grid()
dev.off()
(myerror <- as.ts(mysum$resid))
bitmap(file='test5.png')
dum <- cbind(lag(myerror,k=1),myerror)
dum
dum1 <- dum[2:length(myerror),]
dum1
z <- as.data.frame(dum1)
z
plot(z,main=paste('Residual Lag plot, lowess, and regression line'), ylab='values of Residuals', xlab='lagged values of Residuals')
lines(lowess(z))
abline(lm(z))
grid()
dev.off()
bitmap(file='test6.png')
acf(mysum$resid, lag.max=length(mysum$resid)/2, main='Residual Autocorrelation Function')
grid()
dev.off()
bitmap(file='test7.png')
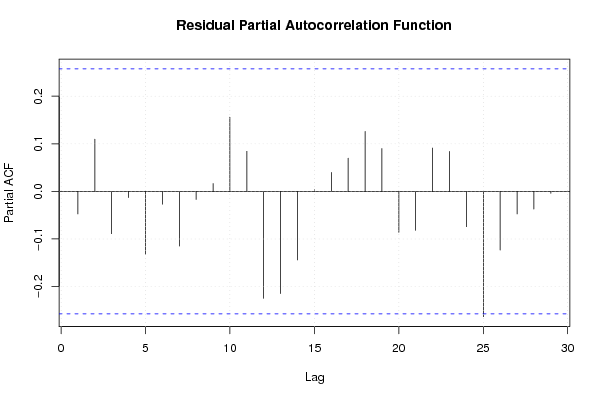
pacf(mysum$resid, lag.max=length(mysum$resid)/2, main='Residual Partial Autocorrelation Function')
grid()
dev.off()
bitmap(file='test8.png')
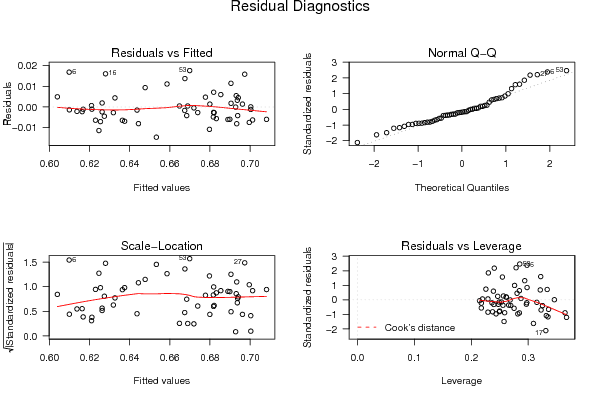
opar <- par(mfrow = c(2,2), oma = c(0, 0, 1.1, 0))
plot(mylm, las = 1, sub='Residual Diagnostics')
par(opar)
dev.off()
if (n > n25) {
bitmap(file='test9.png')
plot(kp3:nmkm3,gqarr[,2], main='Goldfeld-Quandt test',ylab='2-sided p-value',xlab='breakpoint')
grid()
dev.off()
}
load(file='createtable')
a<-table.start()
a<-table.row.start(a)
a<-table.element(a, 'Multiple Linear Regression - Estimated Regression Equation', 1, TRUE)
a<-table.row.end(a)
myeq <- colnames(x)[1]
myeq <- paste(myeq, '[t] = ', sep='')
for (i in 1:k){
if (mysum$coefficients[i,1] > 0) myeq <- paste(myeq, '+', '')
myeq <- paste(myeq, mysum$coefficients[i,1], sep=' ')
if (rownames(mysum$coefficients)[i] != '(Intercept)') {
myeq <- paste(myeq, rownames(mysum$coefficients)[i], sep='')
if (rownames(mysum$coefficients)[i] != 't') myeq <- paste(myeq, '[t]', sep='')
}
}
myeq <- paste(myeq, ' + e[t]')
a<-table.row.start(a)
a<-table.element(a, myeq)
a<-table.row.end(a)
a<-table.end(a)
table.save(a,file='mytable1.tab')
a<-table.start()
a<-table.row.start(a)
a<-table.element(a,hyperlink('ols1.htm','Multiple Linear Regression - Ordinary Least Squares',''), 6, TRUE)
a<-table.row.end(a)
a<-table.row.start(a)
a<-table.element(a,'Variable',header=TRUE)
a<-table.element(a,'Parameter',header=TRUE)
a<-table.element(a,'S.D.',header=TRUE)
a<-table.element(a,'T-STAT
H0: parameter = 0',header=TRUE)
a<-table.element(a,'2-tail p-value',header=TRUE)
a<-table.element(a,'1-tail p-value',header=TRUE)
a<-table.row.end(a)
for (i in 1:k){
a<-table.row.start(a)
a<-table.element(a,rownames(mysum$coefficients)[i],header=TRUE)
a<-table.element(a,mysum$coefficients[i,1])
a<-table.element(a, round(mysum$coefficients[i,2],6))
a<-table.element(a, round(mysum$coefficients[i,3],4))
a<-table.element(a, round(mysum$coefficients[i,4],6))
a<-table.element(a, round(mysum$coefficients[i,4]/2,6))
a<-table.row.end(a)
}
a<-table.end(a)
table.save(a,file='mytable2.tab')
a<-table.start()
a<-table.row.start(a)
a<-table.element(a, 'Multiple Linear Regression - Regression Statistics', 2, TRUE)
a<-table.row.end(a)
a<-table.row.start(a)
a<-table.element(a, 'Multiple R',1,TRUE)
a<-table.element(a, sqrt(mysum$r.squared))
a<-table.row.end(a)
a<-table.row.start(a)
a<-table.element(a, 'R-squared',1,TRUE)
a<-table.element(a, mysum$r.squared)
a<-table.row.end(a)
a<-table.row.start(a)
a<-table.element(a, 'Adjusted R-squared',1,TRUE)
a<-table.element(a, mysum$adj.r.squared)
a<-table.row.end(a)
a<-table.row.start(a)
a<-table.element(a, 'F-TEST (value)',1,TRUE)
a<-table.element(a, mysum$fstatistic[1])
a<-table.row.end(a)
a<-table.row.start(a)
a<-table.element(a, 'F-TEST (DF numerator)',1,TRUE)
a<-table.element(a, mysum$fstatistic[2])
a<-table.row.end(a)
a<-table.row.start(a)
a<-table.element(a, 'F-TEST (DF denominator)',1,TRUE)
a<-table.element(a, mysum$fstatistic[3])
a<-table.row.end(a)
a<-table.row.start(a)
a<-table.element(a, 'p-value',1,TRUE)
a<-table.element(a, 1-pf(mysum$fstatistic[1],mysum$fstatistic[2],mysum$fstatistic[3]))
a<-table.row.end(a)
a<-table.row.start(a)
a<-table.element(a, 'Multiple Linear Regression - Residual Statistics', 2, TRUE)
a<-table.row.end(a)
a<-table.row.start(a)
a<-table.element(a, 'Residual Standard Deviation',1,TRUE)
a<-table.element(a, mysum$sigma)
a<-table.row.end(a)
a<-table.row.start(a)
a<-table.element(a, 'Sum Squared Residuals',1,TRUE)
a<-table.element(a, sum(myerror*myerror))
a<-table.row.end(a)
a<-table.end(a)
table.save(a,file='mytable3.tab')
a<-table.start()
a<-table.row.start(a)
a<-table.element(a, 'Multiple Linear Regression - Actuals, Interpolation, and Residuals', 4, TRUE)
a<-table.row.end(a)
a<-table.row.start(a)
a<-table.element(a, 'Time or Index', 1, TRUE)
a<-table.element(a, 'Actuals', 1, TRUE)
a<-table.element(a, 'Interpolation
Forecast', 1, TRUE)
a<-table.element(a, 'Residuals
Prediction Error', 1, TRUE)
a<-table.row.end(a)
for (i in 1:n) {
a<-table.row.start(a)
a<-table.element(a,i, 1, TRUE)
a<-table.element(a,x[i])
a<-table.element(a,x[i]-mysum$resid[i])
a<-table.element(a,mysum$resid[i])
a<-table.row.end(a)
}
a<-table.end(a)
table.save(a,file='mytable4.tab')
if (n > n25) {
a<-table.start()
a<-table.row.start(a)
a<-table.element(a,'Goldfeld-Quandt test for Heteroskedasticity',4,TRUE)
a<-table.row.end(a)
a<-table.row.start(a)
a<-table.element(a,'p-values',header=TRUE)
a<-table.element(a,'Alternative Hypothesis',3,header=TRUE)
a<-table.row.end(a)
a<-table.row.start(a)
a<-table.element(a,'breakpoint index',header=TRUE)
a<-table.element(a,'greater',header=TRUE)
a<-table.element(a,'2-sided',header=TRUE)
a<-table.element(a,'less',header=TRUE)
a<-table.row.end(a)
for (mypoint in kp3:nmkm3) {
a<-table.row.start(a)
a<-table.element(a,mypoint,header=TRUE)
a<-table.element(a,gqarr[mypoint-kp3+1,1])
a<-table.element(a,gqarr[mypoint-kp3+1,2])
a<-table.element(a,gqarr[mypoint-kp3+1,3])
a<-table.row.end(a)
}
a<-table.end(a)
table.save(a,file='mytable5.tab')
a<-table.start()
a<-table.row.start(a)
a<-table.element(a,'Meta Analysis of Goldfeld-Quandt test for Heteroskedasticity',4,TRUE)
a<-table.row.end(a)
a<-table.row.start(a)
a<-table.element(a,'Description',header=TRUE)
a<-table.element(a,'# significant tests',header=TRUE)
a<-table.element(a,'% significant tests',header=TRUE)
a<-table.element(a,'OK/NOK',header=TRUE)
a<-table.row.end(a)
a<-table.row.start(a)
a<-table.element(a,'1% type I error level',header=TRUE)
a<-table.element(a,numsignificant1)
a<-table.element(a,numsignificant1/numgqtests)
if (numsignificant1/numgqtests < 0.01) dum <- 'OK' else dum <- 'NOK'
a<-table.element(a,dum)
a<-table.row.end(a)
a<-table.row.start(a)
a<-table.element(a,'5% type I error level',header=TRUE)
a<-table.element(a,numsignificant5)
a<-table.element(a,numsignificant5/numgqtests)
if (numsignificant5/numgqtests < 0.05) dum <- 'OK' else dum <- 'NOK'
a<-table.element(a,dum)
a<-table.row.end(a)
a<-table.row.start(a)
a<-table.element(a,'10% type I error level',header=TRUE)
a<-table.element(a,numsignificant10)
a<-table.element(a,numsignificant10/numgqtests)
if (numsignificant10/numgqtests < 0.1) dum <- 'OK' else dum <- 'NOK'
a<-table.element(a,dum)
a<-table.row.end(a)
a<-table.end(a)
table.save(a,file='mytable6.tab')
}