Free Statistics

of Irreproducible Research!

Author's title

Author*The author of this computation has been verified*
R Software Modulerwasp_multipleregression.wasp
Title produced by softwareMultiple Regression
Date of computationFri, 20 Nov 2009 08:59:24 -0700
Cite this page as followsStatistical Computations at FreeStatistics.org, Office for Research Development and Education, URL https://freestatistics.org/blog/index.php?v=date/2009/Nov/20/t125873287591n3c748jdtrsse.htm/, Retrieved Thu, 25 Apr 2024 13:27:15 +0000
Statistical Computations at FreeStatistics.org, Office for Research Development and Education, URL https://freestatistics.org/blog/index.php?pk=58293, Retrieved Thu, 25 Apr 2024 13:27:15 +0000
QR Codes:

Original text written by user:
IsPrivate?No (this computation is public)
User-defined keywords
Estimated Impact101
Family? (F = Feedback message, R = changed R code, M = changed R Module, P = changed Parameters, D = changed Data)
-     [Multiple Regression] [Q1 The Seatbeltlaw] [2007-11-14 19:27:43] [8cd6641b921d30ebe00b648d1481bba0]
- RMPD  [Multiple Regression] [Seatbelt] [2009-11-12 13:54:52] [b98453cac15ba1066b407e146608df68]
-   PD    [Multiple Regression] [Model 4] [2009-11-18 19:08:24] [9c2d53170eb755e9ae5fcf19d2174a32]
-   PD        [Multiple Regression] [Model_1] [2009-11-20 15:59:24] [82f29a5d509ab8039aab37a0145f886d] [Current]
Feedback Forum

Post a new message
Dataseries X:
562	573
561	572
555	566
544	555
537	548
543	554
594	605
611	622
613	624
611	622
594	605
595	606
591	602
589	600
584	595
573	584
567	578
569	580
621	632
629	640
628	639
612	623
595	606
597	608
593	604
590	601
580	591
574	585
573	584
573	584
620	631
626	637
620	631
588	599
566	577
557	568
561	572
549	560
532	543
526	537
511	522
499	510
555	566
565	576
542	553
527	538
510	521
514	525
517	528
508	519
493	504
490	501
469	480
478	489
528	539
534	545
518	529
506	517
502	513
516	527
528	539


Summary of computational transaction
Raw Inputview raw input (R code)
Raw Outputview raw output of R engine
Computing time3 seconds
R Server'Gwilym Jenkins' @ 72.249.127.135

\begin{tabular}{lllllllll}
\hline
Summary of computational transaction \tabularnewline
Raw Input & view raw input (R code)  \tabularnewline
Raw Output & view raw output of R engine  \tabularnewline
Computing time & 3 seconds \tabularnewline
R Server & 'Gwilym Jenkins' @ 72.249.127.135 \tabularnewline
\hline
\end{tabular}
%Source: https://freestatistics.org/blog/index.php?pk=58293&T=0

[TABLE]
[ROW][C]Summary of computational transaction[/C][/ROW]
[ROW][C]Raw Input[/C][C]view raw input (R code) [/C][/ROW]
[ROW][C]Raw Output[/C][C]view raw output of R engine [/C][/ROW]
[ROW][C]Computing time[/C][C]3 seconds[/C][/ROW]
[ROW][C]R Server[/C][C]'Gwilym Jenkins' @ 72.249.127.135[/C][/ROW]
[/TABLE]
Source: https://freestatistics.org/blog/index.php?pk=58293&T=0

Globally Unique Identifier (entire table): ba.freestatistics.org/blog/index.php?pk=58293&T=0

As an alternative you can also use a QR Code:  

The GUIDs for individual cells are displayed in the table below:

Summary of computational transaction
Raw Inputview raw input (R code)
Raw Outputview raw output of R engine
Computing time3 seconds
R Server'Gwilym Jenkins' @ 72.249.127.135


Multiple Linear Regression - Estimated Regression Equation
Y[t] = -10.9999999999998 + 1X[t] + e[t]

\begin{tabular}{lllllllll}
\hline
Multiple Linear Regression - Estimated Regression Equation \tabularnewline
Y[t] =  -10.9999999999998 +  1X[t]  + e[t] \tabularnewline
\hline
\end{tabular}
%Source: https://freestatistics.org/blog/index.php?pk=58293&T=1

[TABLE]
[ROW][C]Multiple Linear Regression - Estimated Regression Equation[/C][/ROW]
[ROW][C]Y[t] =  -10.9999999999998 +  1X[t]  + e[t][/C][/ROW]
[/TABLE]
Source: https://freestatistics.org/blog/index.php?pk=58293&T=1

Globally Unique Identifier (entire table): ba.freestatistics.org/blog/index.php?pk=58293&T=1

As an alternative you can also use a QR Code:  

The GUIDs for individual cells are displayed in the table below:

Multiple Linear Regression - Estimated Regression Equation
Y[t] = -10.9999999999998 + 1X[t] + e[t]


Multiple Linear Regression - Ordinary Least Squares
VariableParameterS.D.T-STATH0: parameter = 02-tail p-value1-tail p-value
(Intercept)-10.99999999999980-54235051562800.900
X10281891939478415600

\begin{tabular}{lllllllll}
\hline
Multiple Linear Regression - Ordinary Least Squares \tabularnewline
Variable & Parameter & S.D. & T-STATH0: parameter = 0 & 2-tail p-value & 1-tail p-value \tabularnewline
(Intercept) & -10.9999999999998 & 0 & -54235051562800.9 & 0 & 0 \tabularnewline
X & 1 & 0 & 2818919394784156 & 0 & 0 \tabularnewline
\hline
\end{tabular}
%Source: https://freestatistics.org/blog/index.php?pk=58293&T=2

[TABLE]
[ROW][C]Multiple Linear Regression - Ordinary Least Squares[/C][/ROW]
[ROW][C]Variable[/C][C]Parameter[/C][C]S.D.[/C][C]T-STATH0: parameter = 0[/C][C]2-tail p-value[/C][C]1-tail p-value[/C][/ROW]
[ROW][C](Intercept)[/C][C]-10.9999999999998[/C][C]0[/C][C]-54235051562800.9[/C][C]0[/C][C]0[/C][/ROW]
[ROW][C]X[/C][C]1[/C][C]0[/C][C]2818919394784156[/C][C]0[/C][C]0[/C][/ROW]
[/TABLE]
Source: https://freestatistics.org/blog/index.php?pk=58293&T=2

Globally Unique Identifier (entire table): ba.freestatistics.org/blog/index.php?pk=58293&T=2

As an alternative you can also use a QR Code:  

The GUIDs for individual cells are displayed in the table below:

Multiple Linear Regression - Ordinary Least Squares
VariableParameterS.D.T-STATH0: parameter = 02-tail p-value1-tail p-value
(Intercept)-10.99999999999980-54235051562800.900
X10281891939478415600


Multiple Linear Regression - Regression Statistics
Multiple R1
R-squared1
Adjusted R-squared1
F-TEST (value)7.94630655429027e+30
F-TEST (DF numerator)1
F-TEST (DF denominator)59
p-value0
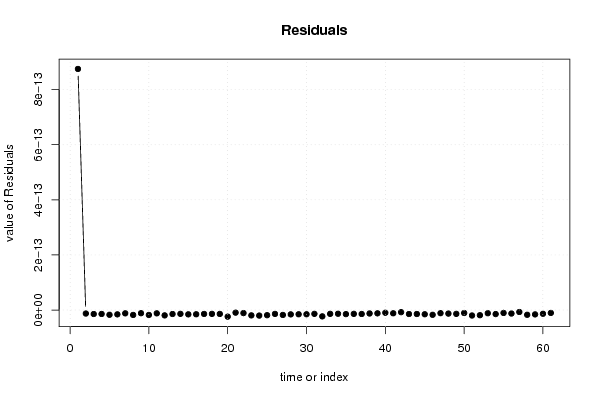
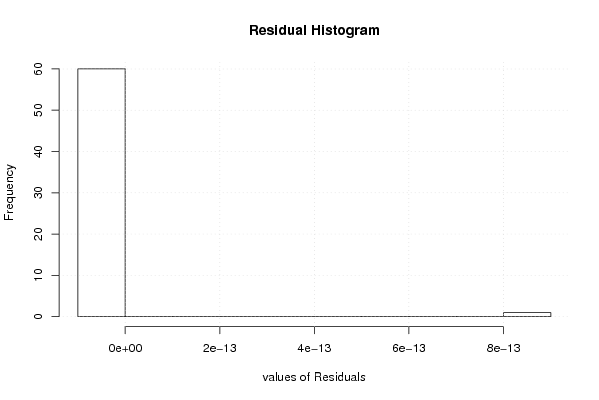
Multiple Linear Regression - Residual Statistics
Residual Standard Deviation1.14906334931848e-13
Sum Squared Residuals7.79004482640727e-25

\begin{tabular}{lllllllll}
\hline
Multiple Linear Regression - Regression Statistics \tabularnewline
Multiple R & 1 \tabularnewline
R-squared & 1 \tabularnewline
Adjusted R-squared & 1 \tabularnewline
F-TEST (value) & 7.94630655429027e+30 \tabularnewline
F-TEST (DF numerator) & 1 \tabularnewline
F-TEST (DF denominator) & 59 \tabularnewline
p-value & 0 \tabularnewline
Multiple Linear Regression - Residual Statistics \tabularnewline
Residual Standard Deviation & 1.14906334931848e-13 \tabularnewline
Sum Squared Residuals & 7.79004482640727e-25 \tabularnewline
\hline
\end{tabular}
%Source: https://freestatistics.org/blog/index.php?pk=58293&T=3

[TABLE]
[ROW][C]Multiple Linear Regression - Regression Statistics[/C][/ROW]
[ROW][C]Multiple R[/C][C]1[/C][/ROW]
[ROW][C]R-squared[/C][C]1[/C][/ROW]
[ROW][C]Adjusted R-squared[/C][C]1[/C][/ROW]
[ROW][C]F-TEST (value)[/C][C]7.94630655429027e+30[/C][/ROW]
[ROW][C]F-TEST (DF numerator)[/C][C]1[/C][/ROW]
[ROW][C]F-TEST (DF denominator)[/C][C]59[/C][/ROW]
[ROW][C]p-value[/C][C]0[/C][/ROW]
[ROW][C]Multiple Linear Regression - Residual Statistics[/C][/ROW]
[ROW][C]Residual Standard Deviation[/C][C]1.14906334931848e-13[/C][/ROW]
[ROW][C]Sum Squared Residuals[/C][C]7.79004482640727e-25[/C][/ROW]
[/TABLE]
Source: https://freestatistics.org/blog/index.php?pk=58293&T=3

Globally Unique Identifier (entire table): ba.freestatistics.org/blog/index.php?pk=58293&T=3

As an alternative you can also use a QR Code:  

The GUIDs for individual cells are displayed in the table below:

Multiple Linear Regression - Regression Statistics
Multiple R1
R-squared1
Adjusted R-squared1
F-TEST (value)7.94630655429027e+30
F-TEST (DF numerator)1
F-TEST (DF denominator)59
p-value0
Multiple Linear Regression - Residual Statistics
Residual Standard Deviation1.14906334931848e-13
Sum Squared Residuals7.79004482640727e-25


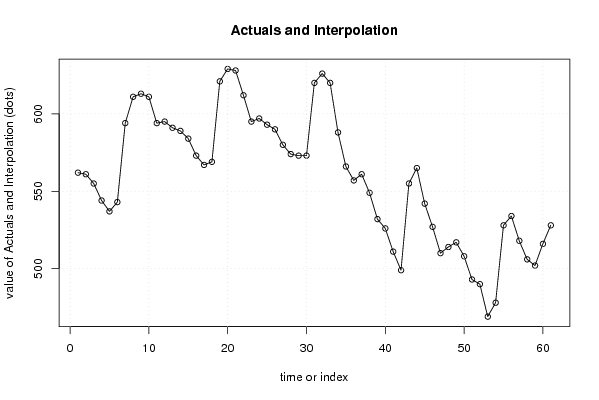
Multiple Linear Regression - Actuals, Interpolation, and Residuals
Time or IndexActualsInterpolationForecastResidualsPrediction Error
1562561.9999999999998.7498286696373e-13
2561561-1.27465237899230e-14
3555555-1.45839977517006e-14
4544544-1.43481736451483e-14
5537537-1.72663564817609e-14
6543543-1.57801179586074e-14
7594594-1.20288747088037e-14
8611611-1.78838876498035e-14
9613613-1.14672853440849e-14
10611611-1.78838876498035e-14
11594594-1.20288747088037e-14
12595595-1.94787145923459e-14
13591591-1.45483508097808e-14
14589589-1.38595257578984e-14
15584584-1.56901768069931e-14
16573573-1.54543527004408e-14
17567567-1.42760559644939e-14
18569569-1.40767025966762e-14
19621621-1.42225855516142e-14
20629629-2.40833131167445e-14
21628628-9.52804587560131e-15
22612612-1.11228728181437e-14
23595595-1.94787145923459e-14
24597597-2.01675396442282e-14
25593593-1.87898895404636e-14
26590590-1.42039382838396e-14
27580580-1.78652403820289e-14
28574574-1.57987652263820e-14
29573573-1.54543527004408e-14
30573573-1.54543527004408e-14
31620620-1.3878173025673e-14
32626626-2.3050075538921e-14
33620620-1.3878173025673e-14
34588588-1.35151132319573e-14
35566566-1.48198218582529e-14
36557557-1.39405551740327e-14
37561561-1.44300268580973e-14
38549549-1.25175225960536e-14
39532532-1.19915801732546e-14
40526526-9.9251050176076e-15
41511511-1.18643444860911e-14
42499499-7.73139417479719e-15
43555555-1.45839977517006e-14
44565565-1.44754093323117e-14
45542542-1.54357054326662e-14
46527527-1.73749449011498e-14
47510510-1.151993196015e-14
48514514-1.28975820639146e-14
49517517-1.39308196417381e-14
50508508-1.08311069082677e-14
51493493-1.98757737343522e-14
52490490-1.88425361565287e-14
53469469-1.16098731117643e-14
54478478-1.47095858452347e-14
55528528-1.06139300694899e-14
56534534-1.26804052251369e-14
57518518-7.16980481007829e-15
58506506-1.72477092139863e-14
59502502-1.58700591102217e-14
60516516-1.35864071157970e-14
61528528-1.06139300694899e-14

\begin{tabular}{lllllllll}
\hline
Multiple Linear Regression - Actuals, Interpolation, and Residuals \tabularnewline
Time or Index & Actuals & InterpolationForecast & ResidualsPrediction Error \tabularnewline
1 & 562 & 561.999999999999 & 8.7498286696373e-13 \tabularnewline
2 & 561 & 561 & -1.27465237899230e-14 \tabularnewline
3 & 555 & 555 & -1.45839977517006e-14 \tabularnewline
4 & 544 & 544 & -1.43481736451483e-14 \tabularnewline
5 & 537 & 537 & -1.72663564817609e-14 \tabularnewline
6 & 543 & 543 & -1.57801179586074e-14 \tabularnewline
7 & 594 & 594 & -1.20288747088037e-14 \tabularnewline
8 & 611 & 611 & -1.78838876498035e-14 \tabularnewline
9 & 613 & 613 & -1.14672853440849e-14 \tabularnewline
10 & 611 & 611 & -1.78838876498035e-14 \tabularnewline
11 & 594 & 594 & -1.20288747088037e-14 \tabularnewline
12 & 595 & 595 & -1.94787145923459e-14 \tabularnewline
13 & 591 & 591 & -1.45483508097808e-14 \tabularnewline
14 & 589 & 589 & -1.38595257578984e-14 \tabularnewline
15 & 584 & 584 & -1.56901768069931e-14 \tabularnewline
16 & 573 & 573 & -1.54543527004408e-14 \tabularnewline
17 & 567 & 567 & -1.42760559644939e-14 \tabularnewline
18 & 569 & 569 & -1.40767025966762e-14 \tabularnewline
19 & 621 & 621 & -1.42225855516142e-14 \tabularnewline
20 & 629 & 629 & -2.40833131167445e-14 \tabularnewline
21 & 628 & 628 & -9.52804587560131e-15 \tabularnewline
22 & 612 & 612 & -1.11228728181437e-14 \tabularnewline
23 & 595 & 595 & -1.94787145923459e-14 \tabularnewline
24 & 597 & 597 & -2.01675396442282e-14 \tabularnewline
25 & 593 & 593 & -1.87898895404636e-14 \tabularnewline
26 & 590 & 590 & -1.42039382838396e-14 \tabularnewline
27 & 580 & 580 & -1.78652403820289e-14 \tabularnewline
28 & 574 & 574 & -1.57987652263820e-14 \tabularnewline
29 & 573 & 573 & -1.54543527004408e-14 \tabularnewline
30 & 573 & 573 & -1.54543527004408e-14 \tabularnewline
31 & 620 & 620 & -1.3878173025673e-14 \tabularnewline
32 & 626 & 626 & -2.3050075538921e-14 \tabularnewline
33 & 620 & 620 & -1.3878173025673e-14 \tabularnewline
34 & 588 & 588 & -1.35151132319573e-14 \tabularnewline
35 & 566 & 566 & -1.48198218582529e-14 \tabularnewline
36 & 557 & 557 & -1.39405551740327e-14 \tabularnewline
37 & 561 & 561 & -1.44300268580973e-14 \tabularnewline
38 & 549 & 549 & -1.25175225960536e-14 \tabularnewline
39 & 532 & 532 & -1.19915801732546e-14 \tabularnewline
40 & 526 & 526 & -9.9251050176076e-15 \tabularnewline
41 & 511 & 511 & -1.18643444860911e-14 \tabularnewline
42 & 499 & 499 & -7.73139417479719e-15 \tabularnewline
43 & 555 & 555 & -1.45839977517006e-14 \tabularnewline
44 & 565 & 565 & -1.44754093323117e-14 \tabularnewline
45 & 542 & 542 & -1.54357054326662e-14 \tabularnewline
46 & 527 & 527 & -1.73749449011498e-14 \tabularnewline
47 & 510 & 510 & -1.151993196015e-14 \tabularnewline
48 & 514 & 514 & -1.28975820639146e-14 \tabularnewline
49 & 517 & 517 & -1.39308196417381e-14 \tabularnewline
50 & 508 & 508 & -1.08311069082677e-14 \tabularnewline
51 & 493 & 493 & -1.98757737343522e-14 \tabularnewline
52 & 490 & 490 & -1.88425361565287e-14 \tabularnewline
53 & 469 & 469 & -1.16098731117643e-14 \tabularnewline
54 & 478 & 478 & -1.47095858452347e-14 \tabularnewline
55 & 528 & 528 & -1.06139300694899e-14 \tabularnewline
56 & 534 & 534 & -1.26804052251369e-14 \tabularnewline
57 & 518 & 518 & -7.16980481007829e-15 \tabularnewline
58 & 506 & 506 & -1.72477092139863e-14 \tabularnewline
59 & 502 & 502 & -1.58700591102217e-14 \tabularnewline
60 & 516 & 516 & -1.35864071157970e-14 \tabularnewline
61 & 528 & 528 & -1.06139300694899e-14 \tabularnewline
\hline
\end{tabular}
%Source: https://freestatistics.org/blog/index.php?pk=58293&T=4

[TABLE]
[ROW][C]Multiple Linear Regression - Actuals, Interpolation, and Residuals[/C][/ROW]
[ROW][C]Time or Index[/C][C]Actuals[/C][C]InterpolationForecast[/C][C]ResidualsPrediction Error[/C][/ROW]
[ROW][C]1[/C][C]562[/C][C]561.999999999999[/C][C]8.7498286696373e-13[/C][/ROW]
[ROW][C]2[/C][C]561[/C][C]561[/C][C]-1.27465237899230e-14[/C][/ROW]
[ROW][C]3[/C][C]555[/C][C]555[/C][C]-1.45839977517006e-14[/C][/ROW]
[ROW][C]4[/C][C]544[/C][C]544[/C][C]-1.43481736451483e-14[/C][/ROW]
[ROW][C]5[/C][C]537[/C][C]537[/C][C]-1.72663564817609e-14[/C][/ROW]
[ROW][C]6[/C][C]543[/C][C]543[/C][C]-1.57801179586074e-14[/C][/ROW]
[ROW][C]7[/C][C]594[/C][C]594[/C][C]-1.20288747088037e-14[/C][/ROW]
[ROW][C]8[/C][C]611[/C][C]611[/C][C]-1.78838876498035e-14[/C][/ROW]
[ROW][C]9[/C][C]613[/C][C]613[/C][C]-1.14672853440849e-14[/C][/ROW]
[ROW][C]10[/C][C]611[/C][C]611[/C][C]-1.78838876498035e-14[/C][/ROW]
[ROW][C]11[/C][C]594[/C][C]594[/C][C]-1.20288747088037e-14[/C][/ROW]
[ROW][C]12[/C][C]595[/C][C]595[/C][C]-1.94787145923459e-14[/C][/ROW]
[ROW][C]13[/C][C]591[/C][C]591[/C][C]-1.45483508097808e-14[/C][/ROW]
[ROW][C]14[/C][C]589[/C][C]589[/C][C]-1.38595257578984e-14[/C][/ROW]
[ROW][C]15[/C][C]584[/C][C]584[/C][C]-1.56901768069931e-14[/C][/ROW]
[ROW][C]16[/C][C]573[/C][C]573[/C][C]-1.54543527004408e-14[/C][/ROW]
[ROW][C]17[/C][C]567[/C][C]567[/C][C]-1.42760559644939e-14[/C][/ROW]
[ROW][C]18[/C][C]569[/C][C]569[/C][C]-1.40767025966762e-14[/C][/ROW]
[ROW][C]19[/C][C]621[/C][C]621[/C][C]-1.42225855516142e-14[/C][/ROW]
[ROW][C]20[/C][C]629[/C][C]629[/C][C]-2.40833131167445e-14[/C][/ROW]
[ROW][C]21[/C][C]628[/C][C]628[/C][C]-9.52804587560131e-15[/C][/ROW]
[ROW][C]22[/C][C]612[/C][C]612[/C][C]-1.11228728181437e-14[/C][/ROW]
[ROW][C]23[/C][C]595[/C][C]595[/C][C]-1.94787145923459e-14[/C][/ROW]
[ROW][C]24[/C][C]597[/C][C]597[/C][C]-2.01675396442282e-14[/C][/ROW]
[ROW][C]25[/C][C]593[/C][C]593[/C][C]-1.87898895404636e-14[/C][/ROW]
[ROW][C]26[/C][C]590[/C][C]590[/C][C]-1.42039382838396e-14[/C][/ROW]
[ROW][C]27[/C][C]580[/C][C]580[/C][C]-1.78652403820289e-14[/C][/ROW]
[ROW][C]28[/C][C]574[/C][C]574[/C][C]-1.57987652263820e-14[/C][/ROW]
[ROW][C]29[/C][C]573[/C][C]573[/C][C]-1.54543527004408e-14[/C][/ROW]
[ROW][C]30[/C][C]573[/C][C]573[/C][C]-1.54543527004408e-14[/C][/ROW]
[ROW][C]31[/C][C]620[/C][C]620[/C][C]-1.3878173025673e-14[/C][/ROW]
[ROW][C]32[/C][C]626[/C][C]626[/C][C]-2.3050075538921e-14[/C][/ROW]
[ROW][C]33[/C][C]620[/C][C]620[/C][C]-1.3878173025673e-14[/C][/ROW]
[ROW][C]34[/C][C]588[/C][C]588[/C][C]-1.35151132319573e-14[/C][/ROW]
[ROW][C]35[/C][C]566[/C][C]566[/C][C]-1.48198218582529e-14[/C][/ROW]
[ROW][C]36[/C][C]557[/C][C]557[/C][C]-1.39405551740327e-14[/C][/ROW]
[ROW][C]37[/C][C]561[/C][C]561[/C][C]-1.44300268580973e-14[/C][/ROW]
[ROW][C]38[/C][C]549[/C][C]549[/C][C]-1.25175225960536e-14[/C][/ROW]
[ROW][C]39[/C][C]532[/C][C]532[/C][C]-1.19915801732546e-14[/C][/ROW]
[ROW][C]40[/C][C]526[/C][C]526[/C][C]-9.9251050176076e-15[/C][/ROW]
[ROW][C]41[/C][C]511[/C][C]511[/C][C]-1.18643444860911e-14[/C][/ROW]
[ROW][C]42[/C][C]499[/C][C]499[/C][C]-7.73139417479719e-15[/C][/ROW]
[ROW][C]43[/C][C]555[/C][C]555[/C][C]-1.45839977517006e-14[/C][/ROW]
[ROW][C]44[/C][C]565[/C][C]565[/C][C]-1.44754093323117e-14[/C][/ROW]
[ROW][C]45[/C][C]542[/C][C]542[/C][C]-1.54357054326662e-14[/C][/ROW]
[ROW][C]46[/C][C]527[/C][C]527[/C][C]-1.73749449011498e-14[/C][/ROW]
[ROW][C]47[/C][C]510[/C][C]510[/C][C]-1.151993196015e-14[/C][/ROW]
[ROW][C]48[/C][C]514[/C][C]514[/C][C]-1.28975820639146e-14[/C][/ROW]
[ROW][C]49[/C][C]517[/C][C]517[/C][C]-1.39308196417381e-14[/C][/ROW]
[ROW][C]50[/C][C]508[/C][C]508[/C][C]-1.08311069082677e-14[/C][/ROW]
[ROW][C]51[/C][C]493[/C][C]493[/C][C]-1.98757737343522e-14[/C][/ROW]
[ROW][C]52[/C][C]490[/C][C]490[/C][C]-1.88425361565287e-14[/C][/ROW]
[ROW][C]53[/C][C]469[/C][C]469[/C][C]-1.16098731117643e-14[/C][/ROW]
[ROW][C]54[/C][C]478[/C][C]478[/C][C]-1.47095858452347e-14[/C][/ROW]
[ROW][C]55[/C][C]528[/C][C]528[/C][C]-1.06139300694899e-14[/C][/ROW]
[ROW][C]56[/C][C]534[/C][C]534[/C][C]-1.26804052251369e-14[/C][/ROW]
[ROW][C]57[/C][C]518[/C][C]518[/C][C]-7.16980481007829e-15[/C][/ROW]
[ROW][C]58[/C][C]506[/C][C]506[/C][C]-1.72477092139863e-14[/C][/ROW]
[ROW][C]59[/C][C]502[/C][C]502[/C][C]-1.58700591102217e-14[/C][/ROW]
[ROW][C]60[/C][C]516[/C][C]516[/C][C]-1.35864071157970e-14[/C][/ROW]
[ROW][C]61[/C][C]528[/C][C]528[/C][C]-1.06139300694899e-14[/C][/ROW]
[/TABLE]
Source: https://freestatistics.org/blog/index.php?pk=58293&T=4

Globally Unique Identifier (entire table): ba.freestatistics.org/blog/index.php?pk=58293&T=4

As an alternative you can also use a QR Code:  

The GUIDs for individual cells are displayed in the table below:

Multiple Linear Regression - Actuals, Interpolation, and Residuals
Time or IndexActualsInterpolationForecastResidualsPrediction Error
1562561.9999999999998.7498286696373e-13
2561561-1.27465237899230e-14
3555555-1.45839977517006e-14
4544544-1.43481736451483e-14
5537537-1.72663564817609e-14
6543543-1.57801179586074e-14
7594594-1.20288747088037e-14
8611611-1.78838876498035e-14
9613613-1.14672853440849e-14
10611611-1.78838876498035e-14
11594594-1.20288747088037e-14
12595595-1.94787145923459e-14
13591591-1.45483508097808e-14
14589589-1.38595257578984e-14
15584584-1.56901768069931e-14
16573573-1.54543527004408e-14
17567567-1.42760559644939e-14
18569569-1.40767025966762e-14
19621621-1.42225855516142e-14
20629629-2.40833131167445e-14
21628628-9.52804587560131e-15
22612612-1.11228728181437e-14
23595595-1.94787145923459e-14
24597597-2.01675396442282e-14
25593593-1.87898895404636e-14
26590590-1.42039382838396e-14
27580580-1.78652403820289e-14
28574574-1.57987652263820e-14
29573573-1.54543527004408e-14
30573573-1.54543527004408e-14
31620620-1.3878173025673e-14
32626626-2.3050075538921e-14
33620620-1.3878173025673e-14
34588588-1.35151132319573e-14
35566566-1.48198218582529e-14
36557557-1.39405551740327e-14
37561561-1.44300268580973e-14
38549549-1.25175225960536e-14
39532532-1.19915801732546e-14
40526526-9.9251050176076e-15
41511511-1.18643444860911e-14
42499499-7.73139417479719e-15
43555555-1.45839977517006e-14
44565565-1.44754093323117e-14
45542542-1.54357054326662e-14
46527527-1.73749449011498e-14
47510510-1.151993196015e-14
48514514-1.28975820639146e-14
49517517-1.39308196417381e-14
50508508-1.08311069082677e-14
51493493-1.98757737343522e-14
52490490-1.88425361565287e-14
53469469-1.16098731117643e-14
54478478-1.47095858452347e-14
55528528-1.06139300694899e-14
56534534-1.26804052251369e-14
57518518-7.16980481007829e-15
58506506-1.72477092139863e-14
59502502-1.58700591102217e-14
60516516-1.35864071157970e-14
61528528-1.06139300694899e-14


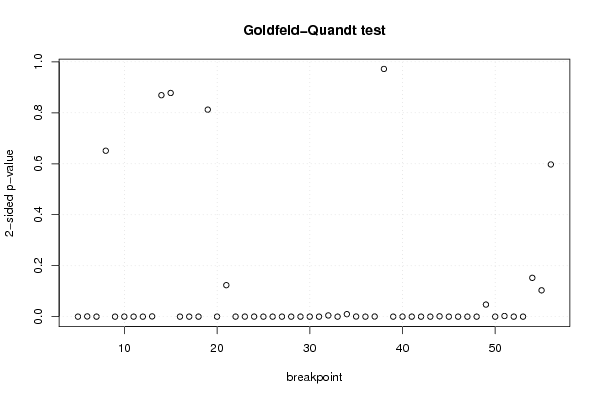
Goldfeld-Quandt test for Heteroskedasticity
p-valuesAlternative Hypothesis
breakpoint indexgreater2-sidedless
51.03471779602571e-062.06943559205142e-060.999998965282204
60.0004744855933740270.0009489711867480550.999525514406626
711.01113848317708e-355.05569241588539e-36
80.6744715051543870.6510569896912260.325528494845613
918.65796250173894e-614.32898125086947e-61
104.84201941228151e-059.68403882456302e-050.999951579805877
1115.25540310806625e-562.62770155403313e-56
122.79778802958151e-155.59557605916302e-150.999999999999997
130.9994898382793170.001020323441366180.000510161720683091
140.4345107812181930.8690215624363850.565489218781807
150.5610951950418890.8778096099162220.438904804958111
163.86802413799862e-237.73604827599725e-231
171.94159059550450e-223.88318119100901e-221
181.11166999174810e-402.22333998349621e-401
190.5938406274520850.812318745095830.406159372547915
2012.95888856202590e-831.47944428101295e-83
210.9382291110389220.1235417779221570.0617708889610783
220.9999191879308650.0001616241382708338.08120691354164e-05
230.9998694785692380.0002610428615235800.000130521430761790
240.9998721205999610.0002557588000770840.000127879400038542
253.24024184322771e-326.48048368645542e-321
263.62790035365853e-257.25580070731706e-251
2716.49723521571497e-353.24861760785749e-35
2811.14724398879949e-545.73621994399743e-55
2919.85796444983566e-174.92898222491783e-17
303.9387900015696e-077.8775800031392e-070.999999606121
312.94926964189101e-455.89853928378202e-451
320.002381870106666480.004763740213332960.997618129893334
3313.38453029540524e-171.69226514770262e-17
340.004898402224988250.00979680444997650.995101597775012
350.9997524072147790.0004951855704429310.000247592785221466
367.40160208070831e-481.48032041614166e-471
370.0002518045537659880.0005036091075319770.999748195446234
380.4860151552899950.972030310579990.513984844710005
3913.38926834391317e-281.69463417195658e-28
407.60318929450352e-201.52063785890070e-191
4111.56218266805104e-247.81091334025521e-25
4213.6889737533062e-361.8444868766531e-36
4314.50999965680094e-232.25499982840047e-23
440.000659061291362850.00131812258272570.999340938708637
4514.49029208836164e-222.24514604418082e-22
460.9999999999999091.82812310516569e-139.14061552582847e-14
4711.26654086808440e-176.33270434042201e-18
488.47779184640072e-331.69555836928014e-321
490.02369519102942370.04739038205884740.976304808970576
501.0560877894018e-542.1121755788036e-541
510.001247902977869060.002495805955738130.99875209702213
520.9999999997624624.75075007704935e-102.37537503852467e-10
533.33493002470245e-456.6698600494049e-451
540.9238393554519480.1523212890961040.0761606445480518
550.9483106920464080.1033786159071850.0516893079535924
560.2986325164885870.5972650329771740.701367483511413

\begin{tabular}{lllllllll}
\hline
Goldfeld-Quandt test for Heteroskedasticity \tabularnewline
p-values & Alternative Hypothesis \tabularnewline
breakpoint index & greater & 2-sided & less \tabularnewline
5 & 1.03471779602571e-06 & 2.06943559205142e-06 & 0.999998965282204 \tabularnewline
6 & 0.000474485593374027 & 0.000948971186748055 & 0.999525514406626 \tabularnewline
7 & 1 & 1.01113848317708e-35 & 5.05569241588539e-36 \tabularnewline
8 & 0.674471505154387 & 0.651056989691226 & 0.325528494845613 \tabularnewline
9 & 1 & 8.65796250173894e-61 & 4.32898125086947e-61 \tabularnewline
10 & 4.84201941228151e-05 & 9.68403882456302e-05 & 0.999951579805877 \tabularnewline
11 & 1 & 5.25540310806625e-56 & 2.62770155403313e-56 \tabularnewline
12 & 2.79778802958151e-15 & 5.59557605916302e-15 & 0.999999999999997 \tabularnewline
13 & 0.999489838279317 & 0.00102032344136618 & 0.000510161720683091 \tabularnewline
14 & 0.434510781218193 & 0.869021562436385 & 0.565489218781807 \tabularnewline
15 & 0.561095195041889 & 0.877809609916222 & 0.438904804958111 \tabularnewline
16 & 3.86802413799862e-23 & 7.73604827599725e-23 & 1 \tabularnewline
17 & 1.94159059550450e-22 & 3.88318119100901e-22 & 1 \tabularnewline
18 & 1.11166999174810e-40 & 2.22333998349621e-40 & 1 \tabularnewline
19 & 0.593840627452085 & 0.81231874509583 & 0.406159372547915 \tabularnewline
20 & 1 & 2.95888856202590e-83 & 1.47944428101295e-83 \tabularnewline
21 & 0.938229111038922 & 0.123541777922157 & 0.0617708889610783 \tabularnewline
22 & 0.999919187930865 & 0.000161624138270833 & 8.08120691354164e-05 \tabularnewline
23 & 0.999869478569238 & 0.000261042861523580 & 0.000130521430761790 \tabularnewline
24 & 0.999872120599961 & 0.000255758800077084 & 0.000127879400038542 \tabularnewline
25 & 3.24024184322771e-32 & 6.48048368645542e-32 & 1 \tabularnewline
26 & 3.62790035365853e-25 & 7.25580070731706e-25 & 1 \tabularnewline
27 & 1 & 6.49723521571497e-35 & 3.24861760785749e-35 \tabularnewline
28 & 1 & 1.14724398879949e-54 & 5.73621994399743e-55 \tabularnewline
29 & 1 & 9.85796444983566e-17 & 4.92898222491783e-17 \tabularnewline
30 & 3.9387900015696e-07 & 7.8775800031392e-07 & 0.999999606121 \tabularnewline
31 & 2.94926964189101e-45 & 5.89853928378202e-45 & 1 \tabularnewline
32 & 0.00238187010666648 & 0.00476374021333296 & 0.997618129893334 \tabularnewline
33 & 1 & 3.38453029540524e-17 & 1.69226514770262e-17 \tabularnewline
34 & 0.00489840222498825 & 0.0097968044499765 & 0.995101597775012 \tabularnewline
35 & 0.999752407214779 & 0.000495185570442931 & 0.000247592785221466 \tabularnewline
36 & 7.40160208070831e-48 & 1.48032041614166e-47 & 1 \tabularnewline
37 & 0.000251804553765988 & 0.000503609107531977 & 0.999748195446234 \tabularnewline
38 & 0.486015155289995 & 0.97203031057999 & 0.513984844710005 \tabularnewline
39 & 1 & 3.38926834391317e-28 & 1.69463417195658e-28 \tabularnewline
40 & 7.60318929450352e-20 & 1.52063785890070e-19 & 1 \tabularnewline
41 & 1 & 1.56218266805104e-24 & 7.81091334025521e-25 \tabularnewline
42 & 1 & 3.6889737533062e-36 & 1.8444868766531e-36 \tabularnewline
43 & 1 & 4.50999965680094e-23 & 2.25499982840047e-23 \tabularnewline
44 & 0.00065906129136285 & 0.0013181225827257 & 0.999340938708637 \tabularnewline
45 & 1 & 4.49029208836164e-22 & 2.24514604418082e-22 \tabularnewline
46 & 0.999999999999909 & 1.82812310516569e-13 & 9.14061552582847e-14 \tabularnewline
47 & 1 & 1.26654086808440e-17 & 6.33270434042201e-18 \tabularnewline
48 & 8.47779184640072e-33 & 1.69555836928014e-32 & 1 \tabularnewline
49 & 0.0236951910294237 & 0.0473903820588474 & 0.976304808970576 \tabularnewline
50 & 1.0560877894018e-54 & 2.1121755788036e-54 & 1 \tabularnewline
51 & 0.00124790297786906 & 0.00249580595573813 & 0.99875209702213 \tabularnewline
52 & 0.999999999762462 & 4.75075007704935e-10 & 2.37537503852467e-10 \tabularnewline
53 & 3.33493002470245e-45 & 6.6698600494049e-45 & 1 \tabularnewline
54 & 0.923839355451948 & 0.152321289096104 & 0.0761606445480518 \tabularnewline
55 & 0.948310692046408 & 0.103378615907185 & 0.0516893079535924 \tabularnewline
56 & 0.298632516488587 & 0.597265032977174 & 0.701367483511413 \tabularnewline
\hline
\end{tabular}
%Source: https://freestatistics.org/blog/index.php?pk=58293&T=5

[TABLE]
[ROW][C]Goldfeld-Quandt test for Heteroskedasticity[/C][/ROW]
[ROW][C]p-values[/C][C]Alternative Hypothesis[/C][/ROW]
[ROW][C]breakpoint index[/C][C]greater[/C][C]2-sided[/C][C]less[/C][/ROW]
[ROW][C]5[/C][C]1.03471779602571e-06[/C][C]2.06943559205142e-06[/C][C]0.999998965282204[/C][/ROW]
[ROW][C]6[/C][C]0.000474485593374027[/C][C]0.000948971186748055[/C][C]0.999525514406626[/C][/ROW]
[ROW][C]7[/C][C]1[/C][C]1.01113848317708e-35[/C][C]5.05569241588539e-36[/C][/ROW]
[ROW][C]8[/C][C]0.674471505154387[/C][C]0.651056989691226[/C][C]0.325528494845613[/C][/ROW]
[ROW][C]9[/C][C]1[/C][C]8.65796250173894e-61[/C][C]4.32898125086947e-61[/C][/ROW]
[ROW][C]10[/C][C]4.84201941228151e-05[/C][C]9.68403882456302e-05[/C][C]0.999951579805877[/C][/ROW]
[ROW][C]11[/C][C]1[/C][C]5.25540310806625e-56[/C][C]2.62770155403313e-56[/C][/ROW]
[ROW][C]12[/C][C]2.79778802958151e-15[/C][C]5.59557605916302e-15[/C][C]0.999999999999997[/C][/ROW]
[ROW][C]13[/C][C]0.999489838279317[/C][C]0.00102032344136618[/C][C]0.000510161720683091[/C][/ROW]
[ROW][C]14[/C][C]0.434510781218193[/C][C]0.869021562436385[/C][C]0.565489218781807[/C][/ROW]
[ROW][C]15[/C][C]0.561095195041889[/C][C]0.877809609916222[/C][C]0.438904804958111[/C][/ROW]
[ROW][C]16[/C][C]3.86802413799862e-23[/C][C]7.73604827599725e-23[/C][C]1[/C][/ROW]
[ROW][C]17[/C][C]1.94159059550450e-22[/C][C]3.88318119100901e-22[/C][C]1[/C][/ROW]
[ROW][C]18[/C][C]1.11166999174810e-40[/C][C]2.22333998349621e-40[/C][C]1[/C][/ROW]
[ROW][C]19[/C][C]0.593840627452085[/C][C]0.81231874509583[/C][C]0.406159372547915[/C][/ROW]
[ROW][C]20[/C][C]1[/C][C]2.95888856202590e-83[/C][C]1.47944428101295e-83[/C][/ROW]
[ROW][C]21[/C][C]0.938229111038922[/C][C]0.123541777922157[/C][C]0.0617708889610783[/C][/ROW]
[ROW][C]22[/C][C]0.999919187930865[/C][C]0.000161624138270833[/C][C]8.08120691354164e-05[/C][/ROW]
[ROW][C]23[/C][C]0.999869478569238[/C][C]0.000261042861523580[/C][C]0.000130521430761790[/C][/ROW]
[ROW][C]24[/C][C]0.999872120599961[/C][C]0.000255758800077084[/C][C]0.000127879400038542[/C][/ROW]
[ROW][C]25[/C][C]3.24024184322771e-32[/C][C]6.48048368645542e-32[/C][C]1[/C][/ROW]
[ROW][C]26[/C][C]3.62790035365853e-25[/C][C]7.25580070731706e-25[/C][C]1[/C][/ROW]
[ROW][C]27[/C][C]1[/C][C]6.49723521571497e-35[/C][C]3.24861760785749e-35[/C][/ROW]
[ROW][C]28[/C][C]1[/C][C]1.14724398879949e-54[/C][C]5.73621994399743e-55[/C][/ROW]
[ROW][C]29[/C][C]1[/C][C]9.85796444983566e-17[/C][C]4.92898222491783e-17[/C][/ROW]
[ROW][C]30[/C][C]3.9387900015696e-07[/C][C]7.8775800031392e-07[/C][C]0.999999606121[/C][/ROW]
[ROW][C]31[/C][C]2.94926964189101e-45[/C][C]5.89853928378202e-45[/C][C]1[/C][/ROW]
[ROW][C]32[/C][C]0.00238187010666648[/C][C]0.00476374021333296[/C][C]0.997618129893334[/C][/ROW]
[ROW][C]33[/C][C]1[/C][C]3.38453029540524e-17[/C][C]1.69226514770262e-17[/C][/ROW]
[ROW][C]34[/C][C]0.00489840222498825[/C][C]0.0097968044499765[/C][C]0.995101597775012[/C][/ROW]
[ROW][C]35[/C][C]0.999752407214779[/C][C]0.000495185570442931[/C][C]0.000247592785221466[/C][/ROW]
[ROW][C]36[/C][C]7.40160208070831e-48[/C][C]1.48032041614166e-47[/C][C]1[/C][/ROW]
[ROW][C]37[/C][C]0.000251804553765988[/C][C]0.000503609107531977[/C][C]0.999748195446234[/C][/ROW]
[ROW][C]38[/C][C]0.486015155289995[/C][C]0.97203031057999[/C][C]0.513984844710005[/C][/ROW]
[ROW][C]39[/C][C]1[/C][C]3.38926834391317e-28[/C][C]1.69463417195658e-28[/C][/ROW]
[ROW][C]40[/C][C]7.60318929450352e-20[/C][C]1.52063785890070e-19[/C][C]1[/C][/ROW]
[ROW][C]41[/C][C]1[/C][C]1.56218266805104e-24[/C][C]7.81091334025521e-25[/C][/ROW]
[ROW][C]42[/C][C]1[/C][C]3.6889737533062e-36[/C][C]1.8444868766531e-36[/C][/ROW]
[ROW][C]43[/C][C]1[/C][C]4.50999965680094e-23[/C][C]2.25499982840047e-23[/C][/ROW]
[ROW][C]44[/C][C]0.00065906129136285[/C][C]0.0013181225827257[/C][C]0.999340938708637[/C][/ROW]
[ROW][C]45[/C][C]1[/C][C]4.49029208836164e-22[/C][C]2.24514604418082e-22[/C][/ROW]
[ROW][C]46[/C][C]0.999999999999909[/C][C]1.82812310516569e-13[/C][C]9.14061552582847e-14[/C][/ROW]
[ROW][C]47[/C][C]1[/C][C]1.26654086808440e-17[/C][C]6.33270434042201e-18[/C][/ROW]
[ROW][C]48[/C][C]8.47779184640072e-33[/C][C]1.69555836928014e-32[/C][C]1[/C][/ROW]
[ROW][C]49[/C][C]0.0236951910294237[/C][C]0.0473903820588474[/C][C]0.976304808970576[/C][/ROW]
[ROW][C]50[/C][C]1.0560877894018e-54[/C][C]2.1121755788036e-54[/C][C]1[/C][/ROW]
[ROW][C]51[/C][C]0.00124790297786906[/C][C]0.00249580595573813[/C][C]0.99875209702213[/C][/ROW]
[ROW][C]52[/C][C]0.999999999762462[/C][C]4.75075007704935e-10[/C][C]2.37537503852467e-10[/C][/ROW]
[ROW][C]53[/C][C]3.33493002470245e-45[/C][C]6.6698600494049e-45[/C][C]1[/C][/ROW]
[ROW][C]54[/C][C]0.923839355451948[/C][C]0.152321289096104[/C][C]0.0761606445480518[/C][/ROW]
[ROW][C]55[/C][C]0.948310692046408[/C][C]0.103378615907185[/C][C]0.0516893079535924[/C][/ROW]
[ROW][C]56[/C][C]0.298632516488587[/C][C]0.597265032977174[/C][C]0.701367483511413[/C][/ROW]
[/TABLE]
Source: https://freestatistics.org/blog/index.php?pk=58293&T=5

Globally Unique Identifier (entire table): ba.freestatistics.org/blog/index.php?pk=58293&T=5

As an alternative you can also use a QR Code:  

The GUIDs for individual cells are displayed in the table below:

Goldfeld-Quandt test for Heteroskedasticity
p-valuesAlternative Hypothesis
breakpoint indexgreater2-sidedless
51.03471779602571e-062.06943559205142e-060.999998965282204
60.0004744855933740270.0009489711867480550.999525514406626
711.01113848317708e-355.05569241588539e-36
80.6744715051543870.6510569896912260.325528494845613
918.65796250173894e-614.32898125086947e-61
104.84201941228151e-059.68403882456302e-050.999951579805877
1115.25540310806625e-562.62770155403313e-56
122.79778802958151e-155.59557605916302e-150.999999999999997
130.9994898382793170.001020323441366180.000510161720683091
140.4345107812181930.8690215624363850.565489218781807
150.5610951950418890.8778096099162220.438904804958111
163.86802413799862e-237.73604827599725e-231
171.94159059550450e-223.88318119100901e-221
181.11166999174810e-402.22333998349621e-401
190.5938406274520850.812318745095830.406159372547915
2012.95888856202590e-831.47944428101295e-83
210.9382291110389220.1235417779221570.0617708889610783
220.9999191879308650.0001616241382708338.08120691354164e-05
230.9998694785692380.0002610428615235800.000130521430761790
240.9998721205999610.0002557588000770840.000127879400038542
253.24024184322771e-326.48048368645542e-321
263.62790035365853e-257.25580070731706e-251
2716.49723521571497e-353.24861760785749e-35
2811.14724398879949e-545.73621994399743e-55
2919.85796444983566e-174.92898222491783e-17
303.9387900015696e-077.8775800031392e-070.999999606121
312.94926964189101e-455.89853928378202e-451
320.002381870106666480.004763740213332960.997618129893334
3313.38453029540524e-171.69226514770262e-17
340.004898402224988250.00979680444997650.995101597775012
350.9997524072147790.0004951855704429310.000247592785221466
367.40160208070831e-481.48032041614166e-471
370.0002518045537659880.0005036091075319770.999748195446234
380.4860151552899950.972030310579990.513984844710005
3913.38926834391317e-281.69463417195658e-28
407.60318929450352e-201.52063785890070e-191
4111.56218266805104e-247.81091334025521e-25
4213.6889737533062e-361.8444868766531e-36
4314.50999965680094e-232.25499982840047e-23
440.000659061291362850.00131812258272570.999340938708637
4514.49029208836164e-222.24514604418082e-22
460.9999999999999091.82812310516569e-139.14061552582847e-14
4711.26654086808440e-176.33270434042201e-18
488.47779184640072e-331.69555836928014e-321
490.02369519102942370.04739038205884740.976304808970576
501.0560877894018e-542.1121755788036e-541
510.001247902977869060.002495805955738130.99875209702213
520.9999999997624624.75075007704935e-102.37537503852467e-10
533.33493002470245e-456.6698600494049e-451
540.9238393554519480.1523212890961040.0761606445480518
550.9483106920464080.1033786159071850.0516893079535924
560.2986325164885870.5972650329771740.701367483511413


Meta Analysis of Goldfeld-Quandt test for Heteroskedasticity
Description# significant tests% significant testsOK/NOK
1% type I error level420.807692307692308NOK
5% type I error level430.826923076923077NOK
10% type I error level430.826923076923077NOK

\begin{tabular}{lllllllll}
\hline
Meta Analysis of Goldfeld-Quandt test for Heteroskedasticity \tabularnewline
Description & # significant tests & % significant tests & OK/NOK \tabularnewline
1% type I error level & 42 & 0.807692307692308 & NOK \tabularnewline
5% type I error level & 43 & 0.826923076923077 & NOK \tabularnewline
10% type I error level & 43 & 0.826923076923077 & NOK \tabularnewline
\hline
\end{tabular}
%Source: https://freestatistics.org/blog/index.php?pk=58293&T=6

[TABLE]
[ROW][C]Meta Analysis of Goldfeld-Quandt test for Heteroskedasticity[/C][/ROW]
[ROW][C]Description[/C][C]# significant tests[/C][C]% significant tests[/C][C]OK/NOK[/C][/ROW]
[ROW][C]1% type I error level[/C][C]42[/C][C]0.807692307692308[/C][C]NOK[/C][/ROW]
[ROW][C]5% type I error level[/C][C]43[/C][C]0.826923076923077[/C][C]NOK[/C][/ROW]
[ROW][C]10% type I error level[/C][C]43[/C][C]0.826923076923077[/C][C]NOK[/C][/ROW]
[/TABLE]
Source: https://freestatistics.org/blog/index.php?pk=58293&T=6

Globally Unique Identifier (entire table): ba.freestatistics.org/blog/index.php?pk=58293&T=6

As an alternative you can also use a QR Code:  

The GUIDs for individual cells are displayed in the table below:

Meta Analysis of Goldfeld-Quandt test for Heteroskedasticity
Description# significant tests% significant testsOK/NOK
1% type I error level420.807692307692308NOK
5% type I error level430.826923076923077NOK
10% type I error level430.826923076923077NOK


Parameters (Session):
par1 = 1 ; par2 = Do not include Seasonal Dummies ; par3 = No Linear Trend ;
Parameters (R input):
par1 = 1 ; par2 = Do not include Seasonal Dummies ; par3 = No Linear Trend ;
R code (references can be found in the software module):
library(lattice)
library(lmtest)
n25 <- 25 #minimum number of obs. for Goldfeld-Quandt test
par1 <- as.numeric(par1)
x <- t(y)
k <- length(x[1,])
n <- length(x[,1])
x1 <- cbind(x[,par1], x[,1:k!=par1])
mycolnames <- c(colnames(x)[par1], colnames(x)[1:k!=par1])
colnames(x1) <- mycolnames #colnames(x)[par1]
x <- x1
if (par3 == 'First Differences'){
x2 <- array(0, dim=c(n-1,k), dimnames=list(1:(n-1), paste('(1-B)',colnames(x),sep='')))
for (i in 1:n-1) {
for (j in 1:k) {
x2[i,j] <- x[i+1,j] - x[i,j]
}
}
x <- x2
}
if (par2 == 'Include Monthly Dummies'){
x2 <- array(0, dim=c(n,11), dimnames=list(1:n, paste('M', seq(1:11), sep ='')))
for (i in 1:11){
x2[seq(i,n,12),i] <- 1
}
x <- cbind(x, x2)
}
if (par2 == 'Include Quarterly Dummies'){
x2 <- array(0, dim=c(n,3), dimnames=list(1:n, paste('Q', seq(1:3), sep ='')))
for (i in 1:3){
x2[seq(i,n,4),i] <- 1
}
x <- cbind(x, x2)
}
k <- length(x[1,])
if (par3 == 'Linear Trend'){
x <- cbind(x, c(1:n))
colnames(x)[k+1] <- 't'
}
x
k <- length(x[1,])
df <- as.data.frame(x)
(mylm <- lm(df))
(mysum <- summary(mylm))
if (n > n25) {
kp3 <- k + 3
nmkm3 <- n - k - 3
gqarr <- array(NA, dim=c(nmkm3-kp3+1,3))
numgqtests <- 0
numsignificant1 <- 0
numsignificant5 <- 0
numsignificant10 <- 0
for (mypoint in kp3:nmkm3) {
j <- 0
numgqtests <- numgqtests + 1
for (myalt in c('greater', 'two.sided', 'less')) {
j <- j + 1
gqarr[mypoint-kp3+1,j] <- gqtest(mylm, point=mypoint, alternative=myalt)$p.value
}
if (gqarr[mypoint-kp3+1,2] < 0.01) numsignificant1 <- numsignificant1 + 1
if (gqarr[mypoint-kp3+1,2] < 0.05) numsignificant5 <- numsignificant5 + 1
if (gqarr[mypoint-kp3+1,2] < 0.10) numsignificant10 <- numsignificant10 + 1
}
gqarr
}
bitmap(file='test0.png')
plot(x[,1], type='l', main='Actuals and Interpolation', ylab='value of Actuals and Interpolation (dots)', xlab='time or index')
points(x[,1]-mysum$resid)
grid()
dev.off()
bitmap(file='test1.png')
plot(mysum$resid, type='b', pch=19, main='Residuals', ylab='value of Residuals', xlab='time or index')
grid()
dev.off()
bitmap(file='test2.png')
hist(mysum$resid, main='Residual Histogram', xlab='values of Residuals')
grid()
dev.off()
bitmap(file='test3.png')
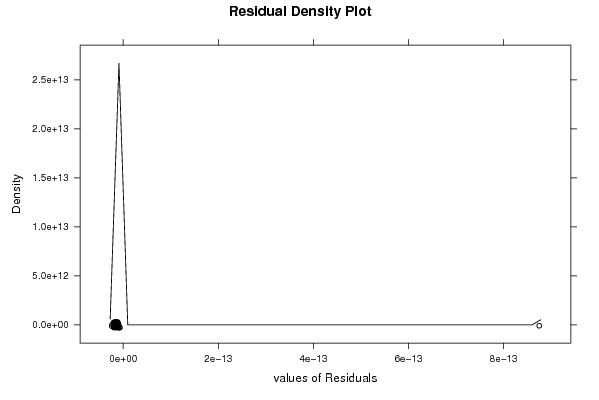
densityplot(~mysum$resid,col='black',main='Residual Density Plot', xlab='values of Residuals')
dev.off()
bitmap(file='test4.png')
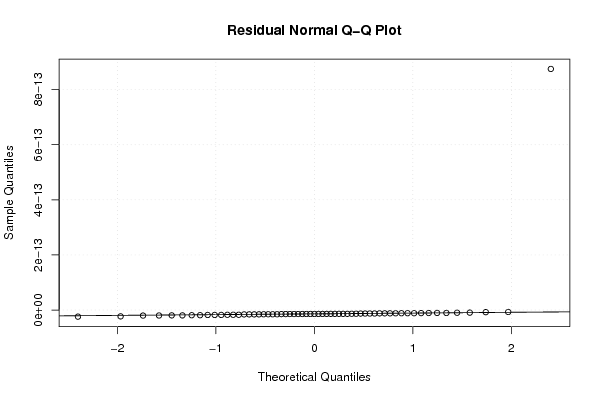
qqnorm(mysum$resid, main='Residual Normal Q-Q Plot')
qqline(mysum$resid)
grid()
dev.off()
(myerror <- as.ts(mysum$resid))
bitmap(file='test5.png')
dum <- cbind(lag(myerror,k=1),myerror)
dum
dum1 <- dum[2:length(myerror),]
dum1
z <- as.data.frame(dum1)
z
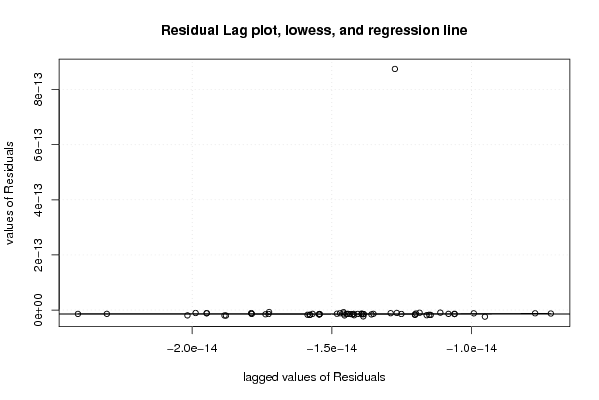
plot(z,main=paste('Residual Lag plot, lowess, and regression line'), ylab='values of Residuals', xlab='lagged values of Residuals')
lines(lowess(z))
abline(lm(z))
grid()
dev.off()
bitmap(file='test6.png')
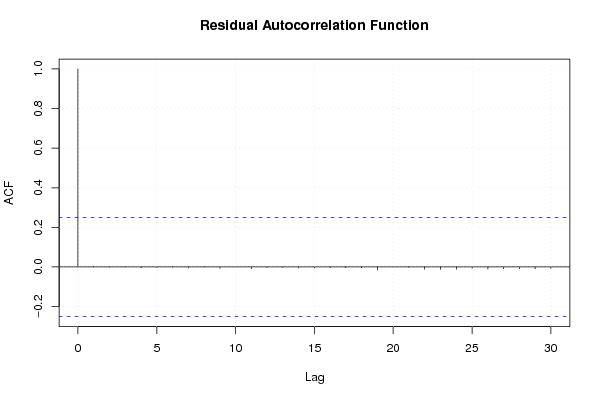
acf(mysum$resid, lag.max=length(mysum$resid)/2, main='Residual Autocorrelation Function')
grid()
dev.off()
bitmap(file='test7.png')
pacf(mysum$resid, lag.max=length(mysum$resid)/2, main='Residual Partial Autocorrelation Function')
grid()
dev.off()
bitmap(file='test8.png')
opar <- par(mfrow = c(2,2), oma = c(0, 0, 1.1, 0))
plot(mylm, las = 1, sub='Residual Diagnostics')
par(opar)
dev.off()
if (n > n25) {
bitmap(file='test9.png')
plot(kp3:nmkm3,gqarr[,2], main='Goldfeld-Quandt test',ylab='2-sided p-value',xlab='breakpoint')
grid()
dev.off()
}
load(file='createtable')
a<-table.start()
a<-table.row.start(a)
a<-table.element(a, 'Multiple Linear Regression - Estimated Regression Equation', 1, TRUE)
a<-table.row.end(a)
myeq <- colnames(x)[1]
myeq <- paste(myeq, '[t] = ', sep='')
for (i in 1:k){
if (mysum$coefficients[i,1] > 0) myeq <- paste(myeq, '+', '')
myeq <- paste(myeq, mysum$coefficients[i,1], sep=' ')
if (rownames(mysum$coefficients)[i] != '(Intercept)') {
myeq <- paste(myeq, rownames(mysum$coefficients)[i], sep='')
if (rownames(mysum$coefficients)[i] != 't') myeq <- paste(myeq, '[t]', sep='')
}
}
myeq <- paste(myeq, ' + e[t]')
a<-table.row.start(a)
a<-table.element(a, myeq)
a<-table.row.end(a)
a<-table.end(a)
table.save(a,file='mytable1.tab')
a<-table.start()
a<-table.row.start(a)
a<-table.element(a,hyperlink('ols1.htm','Multiple Linear Regression - Ordinary Least Squares',''), 6, TRUE)
a<-table.row.end(a)
a<-table.row.start(a)
a<-table.element(a,'Variable',header=TRUE)
a<-table.element(a,'Parameter',header=TRUE)
a<-table.element(a,'S.D.',header=TRUE)
a<-table.element(a,'T-STAT
H0: parameter = 0',header=TRUE)
a<-table.element(a,'2-tail p-value',header=TRUE)
a<-table.element(a,'1-tail p-value',header=TRUE)
a<-table.row.end(a)
for (i in 1:k){
a<-table.row.start(a)
a<-table.element(a,rownames(mysum$coefficients)[i],header=TRUE)
a<-table.element(a,mysum$coefficients[i,1])
a<-table.element(a, round(mysum$coefficients[i,2],6))
a<-table.element(a, round(mysum$coefficients[i,3],4))
a<-table.element(a, round(mysum$coefficients[i,4],6))
a<-table.element(a, round(mysum$coefficients[i,4]/2,6))
a<-table.row.end(a)
}
a<-table.end(a)
table.save(a,file='mytable2.tab')
a<-table.start()
a<-table.row.start(a)
a<-table.element(a, 'Multiple Linear Regression - Regression Statistics', 2, TRUE)
a<-table.row.end(a)
a<-table.row.start(a)
a<-table.element(a, 'Multiple R',1,TRUE)
a<-table.element(a, sqrt(mysum$r.squared))
a<-table.row.end(a)
a<-table.row.start(a)
a<-table.element(a, 'R-squared',1,TRUE)
a<-table.element(a, mysum$r.squared)
a<-table.row.end(a)
a<-table.row.start(a)
a<-table.element(a, 'Adjusted R-squared',1,TRUE)
a<-table.element(a, mysum$adj.r.squared)
a<-table.row.end(a)
a<-table.row.start(a)
a<-table.element(a, 'F-TEST (value)',1,TRUE)
a<-table.element(a, mysum$fstatistic[1])
a<-table.row.end(a)
a<-table.row.start(a)
a<-table.element(a, 'F-TEST (DF numerator)',1,TRUE)
a<-table.element(a, mysum$fstatistic[2])
a<-table.row.end(a)
a<-table.row.start(a)
a<-table.element(a, 'F-TEST (DF denominator)',1,TRUE)
a<-table.element(a, mysum$fstatistic[3])
a<-table.row.end(a)
a<-table.row.start(a)
a<-table.element(a, 'p-value',1,TRUE)
a<-table.element(a, 1-pf(mysum$fstatistic[1],mysum$fstatistic[2],mysum$fstatistic[3]))
a<-table.row.end(a)
a<-table.row.start(a)
a<-table.element(a, 'Multiple Linear Regression - Residual Statistics', 2, TRUE)
a<-table.row.end(a)
a<-table.row.start(a)
a<-table.element(a, 'Residual Standard Deviation',1,TRUE)
a<-table.element(a, mysum$sigma)
a<-table.row.end(a)
a<-table.row.start(a)
a<-table.element(a, 'Sum Squared Residuals',1,TRUE)
a<-table.element(a, sum(myerror*myerror))
a<-table.row.end(a)
a<-table.end(a)
table.save(a,file='mytable3.tab')
a<-table.start()
a<-table.row.start(a)
a<-table.element(a, 'Multiple Linear Regression - Actuals, Interpolation, and Residuals', 4, TRUE)
a<-table.row.end(a)
a<-table.row.start(a)
a<-table.element(a, 'Time or Index', 1, TRUE)
a<-table.element(a, 'Actuals', 1, TRUE)
a<-table.element(a, 'Interpolation
Forecast', 1, TRUE)
a<-table.element(a, 'Residuals
Prediction Error', 1, TRUE)
a<-table.row.end(a)
for (i in 1:n) {
a<-table.row.start(a)
a<-table.element(a,i, 1, TRUE)
a<-table.element(a,x[i])
a<-table.element(a,x[i]-mysum$resid[i])
a<-table.element(a,mysum$resid[i])
a<-table.row.end(a)
}
a<-table.end(a)
table.save(a,file='mytable4.tab')
if (n > n25) {
a<-table.start()
a<-table.row.start(a)
a<-table.element(a,'Goldfeld-Quandt test for Heteroskedasticity',4,TRUE)
a<-table.row.end(a)
a<-table.row.start(a)
a<-table.element(a,'p-values',header=TRUE)
a<-table.element(a,'Alternative Hypothesis',3,header=TRUE)
a<-table.row.end(a)
a<-table.row.start(a)
a<-table.element(a,'breakpoint index',header=TRUE)
a<-table.element(a,'greater',header=TRUE)
a<-table.element(a,'2-sided',header=TRUE)
a<-table.element(a,'less',header=TRUE)
a<-table.row.end(a)
for (mypoint in kp3:nmkm3) {
a<-table.row.start(a)
a<-table.element(a,mypoint,header=TRUE)
a<-table.element(a,gqarr[mypoint-kp3+1,1])
a<-table.element(a,gqarr[mypoint-kp3+1,2])
a<-table.element(a,gqarr[mypoint-kp3+1,3])
a<-table.row.end(a)
}
a<-table.end(a)
table.save(a,file='mytable5.tab')
a<-table.start()
a<-table.row.start(a)
a<-table.element(a,'Meta Analysis of Goldfeld-Quandt test for Heteroskedasticity',4,TRUE)
a<-table.row.end(a)
a<-table.row.start(a)
a<-table.element(a,'Description',header=TRUE)
a<-table.element(a,'# significant tests',header=TRUE)
a<-table.element(a,'% significant tests',header=TRUE)
a<-table.element(a,'OK/NOK',header=TRUE)
a<-table.row.end(a)
a<-table.row.start(a)
a<-table.element(a,'1% type I error level',header=TRUE)
a<-table.element(a,numsignificant1)
a<-table.element(a,numsignificant1/numgqtests)
if (numsignificant1/numgqtests < 0.01) dum <- 'OK' else dum <- 'NOK'
a<-table.element(a,dum)
a<-table.row.end(a)
a<-table.row.start(a)
a<-table.element(a,'5% type I error level',header=TRUE)
a<-table.element(a,numsignificant5)
a<-table.element(a,numsignificant5/numgqtests)
if (numsignificant5/numgqtests < 0.05) dum <- 'OK' else dum <- 'NOK'
a<-table.element(a,dum)
a<-table.row.end(a)
a<-table.row.start(a)
a<-table.element(a,'10% type I error level',header=TRUE)
a<-table.element(a,numsignificant10)
a<-table.element(a,numsignificant10/numgqtests)
if (numsignificant10/numgqtests < 0.1) dum <- 'OK' else dum <- 'NOK'
a<-table.element(a,dum)
a<-table.row.end(a)
a<-table.end(a)
table.save(a,file='mytable6.tab')
}