| Multiple Linear Regression - Estimated Regression Equation |
| wisselkoers[t] = + 233.307819420314 -1.33554955628248consumptieprijzen[t] + e[t] |
| Multiple Linear Regression - Ordinary Least Squares | |||||
| Variable | Parameter | S.D. | T-STAT H0: parameter = 0 | 2-tail p-value | 1-tail p-value |
| (Intercept) | 233.307819420314 | 18.395584 | 12.6828 | 0 | 0 |
| consumptieprijzen | -1.33554955628248 | 0.173914 | -7.6794 | 0 | 0 |
| Multiple Linear Regression - Regression Statistics | |
| Multiple R | 0.710040543404176 |
| R-squared | 0.504157573277698 |
| Adjusted R-squared | 0.495608565920417 |
| F-TEST (value) | 58.9726446835156 |
| F-TEST (DF numerator) | 1 |
| F-TEST (DF denominator) | 58 |
| p-value | 2.11436645969343e-10 |
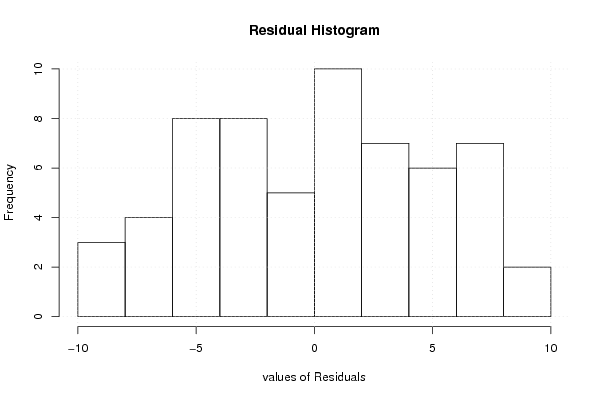
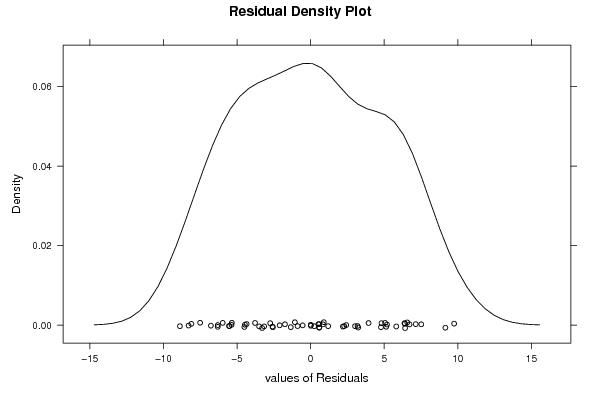
| Multiple Linear Regression - Residual Statistics | |
| Residual Standard Deviation | 4.93021886529721 |
| Sum Squared Residuals | 1409.80936746449 |
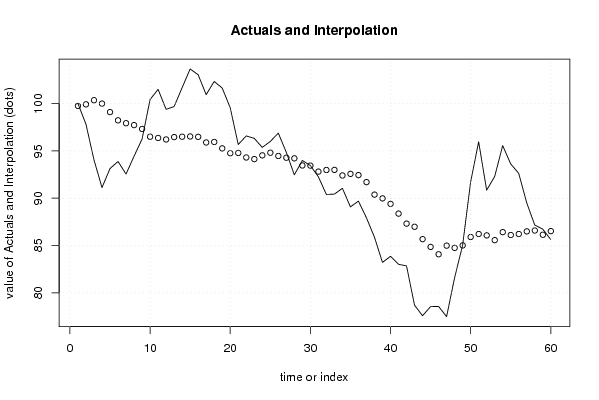
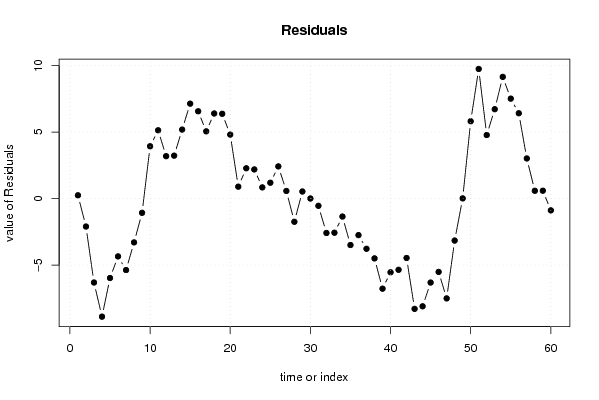
| Multiple Linear Regression - Actuals, Interpolation, and Residuals | |||
| Time or Index | Actuals | Interpolation Forecast | Residuals Prediction Error |
| 1 | 100 | 99.752863792066 | 0.247136207934112 |
| 2 | 97.82226485 | 99.9247491935809 | -2.10248434358088 |
| 3 | 94.04971502 | 100.361073674350 | -6.31135865434974 |
| 4 | 91.12460521 | 100.004080917357 | -8.87947570735703 |
| 5 | 93.13202153 | 99.1049880345385 | -5.97296650453847 |
| 6 | 93.88342812 | 98.2323391531338 | -4.34891103313376 |
| 7 | 92.55349954 | 97.9282341185034 | -5.37473457850338 |
| 8 | 94.43494835 | 97.7299048758405 | -3.29495652584047 |
| 9 | 96.25017563 | 97.3200243163525 | -1.06984868635251 |
| 10 | 100.4355715 | 96.5002631973766 | 3.93530830262341 |
| 11 | 101.5036685 | 96.3680436577497 | 5.13562484225034 |
| 12 | 99.39789728 | 96.2093801033534 | 3.18851717664659 |
| 13 | 99.68990733 | 96.460597242 | 3.22931008799996 |
| 14 | 101.6895041 | 96.5002631973766 | 5.18924090262341 |
| 15 | 103.6652759 | 96.526707078591 | 7.13856882140901 |
| 16 | 103.0532766 | 96.4870412567694 | 6.56623534323062 |
| 17 | 100.9500712 | 95.8920532616708 | 5.05801793832923 |
| 18 | 102.345366 | 95.9449410240995 | 6.40042497590045 |
| 19 | 101.6472299 | 95.2706213853578 | 6.37660851464225 |
| 20 | 99.56809393 | 94.7549653010122 | 4.8131286289878 |
| 21 | 95.67727392 | 94.7814091822266 | 0.8958647377734 |
| 22 | 96.58494865 | 94.3054187861477 | 2.27952986385229 |
| 23 | 96.32604937 | 94.1335334246992 | 2.19251594530081 |
| 24 | 95.37109101 | 94.53019204358 | 0.840898966420034 |
| 25 | 96.00056203 | 94.807853063441 | 1.19270896655899 |
| 26 | 96.88367859 | 94.464082206989 | 2.41959638301098 |
| 27 | 94.85280372 | 94.2789749049333 | 0.573828815066687 |
| 28 | 92.46943974 | 94.2128652018973 | -1.74342546189734 |
| 29 | 93.99180173 | 93.4592137859574 | 0.532587944042605 |
| 30 | 93.45262168 | 93.4459918453502 | 0.00662983464979145 |
| 31 | 92.26698759 | 92.81133802843 | -0.544350438429988 |
| 32 | 90.39653498 | 92.9832233898785 | -2.58668840987849 |
| 33 | 90.43001228 | 92.9964453304857 | -2.56643305048568 |
| 34 | 91.04995327 | 92.401457468942 | -1.35150419894201 |
| 35 | 89.07845784 | 92.5733428303905 | -3.49488499039053 |
| 36 | 89.69314509 | 92.4411232907636 | -2.74797820076361 |
| 37 | 87.92459054 | 91.7006939489858 | -3.77610340898583 |
| 38 | 85.8789319 | 90.3784985527166 | -4.4995666527166 |
| 39 | 83.20612366 | 89.9818399338358 | -6.77571627383584 |
| 40 | 83.85722053 | 89.4000738793444 | -5.5428533493444 |
| 41 | 83.01393462 | 88.3687615770984 | -5.35482695709839 |
| 42 | 82.84508195 | 87.311005260083 | -4.46592331008302 |
| 43 | 78.68864276 | 86.9804563442382 | -8.29181358423824 |
| 44 | 77.56959675 | 85.6714830221312 | -8.10188627213118 |
| 45 | 78.53689529 | 84.8517217696003 | -6.3148264796003 |
| 46 | 78.55717715 | 84.071626606001 | -5.51444945600092 |
| 47 | 77.4761291 | 84.9839413092272 | -7.50781220922723 |
| 48 | 81.58931659 | 84.7459462447427 | -3.15662965474274 |
| 49 | 85.02428326 | 85.0103853239966 | 0.0138979360034356 |
| 50 | 91.71290159 | 85.8962561460085 | 5.81664544399153 |
| 51 | 95.96293061 | 86.213583121246 | 9.74934748875395 |
| 52 | 90.84689022 | 86.068141641012 | 4.77874857898807 |
| 53 | 92.28788036 | 85.5657073637186 | 6.72217299628136 |
| 54 | 95.56511274 | 86.411912363909 | 9.15320037609104 |
| 55 | 93.62452884 | 86.1078074628335 | 7.51672137716646 |
| 56 | 92.63071726 | 86.213583121246 | 6.41713413875394 |
| 57 | 89.50914211 | 86.491244141107 | 3.01789796889291 |
| 58 | 87.17171779 | 86.5837977253575 | 0.58792006464252 |
| 59 | 86.72624975 | 86.134251344048 | 0.591998405952063 |
| 60 | 85.63212844 | 86.5176880223215 | -0.885559582321485 |
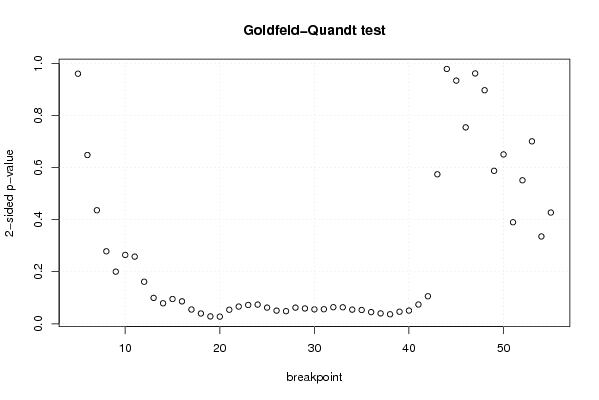
| Goldfeld-Quandt test for Heteroskedasticity | |||
| p-values | Alternative Hypothesis | ||
| breakpoint index | greater | 2-sided | less |
| 5 | 0.479929079355645 | 0.95985815871129 | 0.520070920644355 |
| 6 | 0.323949466783065 | 0.64789893356613 | 0.676050533216935 |
| 7 | 0.217982995632918 | 0.435965991265836 | 0.782017004367082 |
| 8 | 0.139198617197231 | 0.278397234394462 | 0.860801382802769 |
| 9 | 0.100116204657262 | 0.200232409314524 | 0.899883795342738 |
| 10 | 0.132228445842863 | 0.264456891685726 | 0.867771554157137 |
| 11 | 0.128986044308164 | 0.257972088616329 | 0.871013955691836 |
| 12 | 0.080784937867967 | 0.161569875735934 | 0.919215062132033 |
| 13 | 0.0497817805120952 | 0.0995635610241904 | 0.950218219487905 |
| 14 | 0.0394676172501249 | 0.0789352345002498 | 0.960532382749875 |
| 15 | 0.047635259829139 | 0.095270519658278 | 0.95236474017086 |
| 16 | 0.0431586326998295 | 0.086317265399659 | 0.95684136730017 |
| 17 | 0.0274748830218659 | 0.0549497660437318 | 0.972525116978134 |
| 18 | 0.0198712130615129 | 0.0397424261230258 | 0.980128786938487 |
| 19 | 0.0142841965122697 | 0.0285683930245394 | 0.98571580348773 |
| 20 | 0.0137988304808838 | 0.0275976609617675 | 0.986201169519116 |
| 21 | 0.0270633119323554 | 0.0541266238647108 | 0.972936688067645 |
| 22 | 0.0331645615084389 | 0.0663291230168779 | 0.966835438491561 |
| 23 | 0.0362006441352625 | 0.0724012882705251 | 0.963799355864738 |
| 24 | 0.0369682937282169 | 0.0739365874564339 | 0.963031706271783 |
| 25 | 0.0311473274121832 | 0.0622946548243665 | 0.968852672587817 |
| 26 | 0.0253446032944876 | 0.0506892065889752 | 0.974655396705512 |
| 27 | 0.0243455782119932 | 0.0486911564239863 | 0.975654421788007 |
| 28 | 0.0311115551562202 | 0.0622231103124404 | 0.96888844484378 |
| 29 | 0.0295600312419677 | 0.0591200624839353 | 0.970439968758032 |
| 30 | 0.0278015826836675 | 0.055603165367335 | 0.972198417316332 |
| 31 | 0.0280371672250735 | 0.056074334450147 | 0.971962832774927 |
| 32 | 0.0319198406606106 | 0.0638396813212212 | 0.96808015933939 |
| 33 | 0.0317457439091099 | 0.0634914878182199 | 0.96825425609089 |
| 34 | 0.0272498887073565 | 0.054499777414713 | 0.972750111292644 |
| 35 | 0.0265953000712182 | 0.0531906001424365 | 0.973404699928782 |
| 36 | 0.0225057357131662 | 0.0450114714263325 | 0.977494264286834 |
| 37 | 0.0200815914109683 | 0.0401631828219367 | 0.979918408589032 |
| 38 | 0.0183762922070337 | 0.0367525844140674 | 0.981623707792966 |
| 39 | 0.0232320289567030 | 0.0464640579134061 | 0.976767971043297 |
| 40 | 0.0254790804519042 | 0.0509581609038084 | 0.974520919548096 |
| 41 | 0.0370792069489186 | 0.0741584138978373 | 0.962920793051081 |
| 42 | 0.0529449717350824 | 0.105889943470165 | 0.947055028264917 |
| 43 | 0.286995328757749 | 0.573990657515499 | 0.713004671242251 |
| 44 | 0.489108221337385 | 0.97821644267477 | 0.510891778662615 |
| 45 | 0.466704052156769 | 0.933408104313537 | 0.533295947843231 |
| 46 | 0.376995358661403 | 0.753990717322806 | 0.623004641338597 |
| 47 | 0.519478923194649 | 0.961042153610702 | 0.480521076805351 |
| 48 | 0.551739409292992 | 0.896521181414016 | 0.448260590707008 |
| 49 | 0.706375813005033 | 0.587248373989934 | 0.293624186994967 |
| 50 | 0.674892229028196 | 0.650215541943609 | 0.325107770971804 |
| 51 | 0.805030889153968 | 0.389938221692064 | 0.194969110846032 |
| 52 | 0.724564428545442 | 0.550871142909116 | 0.275435571454558 |
| 53 | 0.64973651650714 | 0.70052696698572 | 0.35026348349286 |
| 54 | 0.832318259560017 | 0.335363480879967 | 0.167681740439983 |
| 55 | 0.78644901404926 | 0.42710197190148 | 0.21355098595074 |
| Meta Analysis of Goldfeld-Quandt test for Heteroskedasticity | |||
| Description | # significant tests | % significant tests | OK/NOK |
| 1% type I error level | 0 | 0 | OK |
| 5% type I error level | 8 | 0.156862745098039 | NOK |
| 10% type I error level | 29 | 0.568627450980392 | NOK |