| Multiple Linear Regression - Estimated Regression Equation |
| Y[t] = + 315.014586098755 + 1.01436997434097X[t] + e[t] |
| Multiple Linear Regression - Ordinary Least Squares | |||||
| Variable | Parameter | S.D. | T-STAT H0: parameter = 0 | 2-tail p-value | 1-tail p-value |
| (Intercept) | 315.014586098755 | 14.797195 | 21.2888 | 0 | 0 |
| X | 1.01436997434097 | 0.121032 | 8.381 | 0 | 0 |
| Multiple Linear Regression - Regression Statistics | |
| Multiple R | 0.740084845814715 |
| R-squared | 0.547725579004591 |
| Adjusted R-squared | 0.539927744159842 |
| F-TEST (value) | 70.2407257796007 |
| F-TEST (DF numerator) | 1 |
| F-TEST (DF denominator) | 58 |
| p-value | 1.41233691408615e-11 |
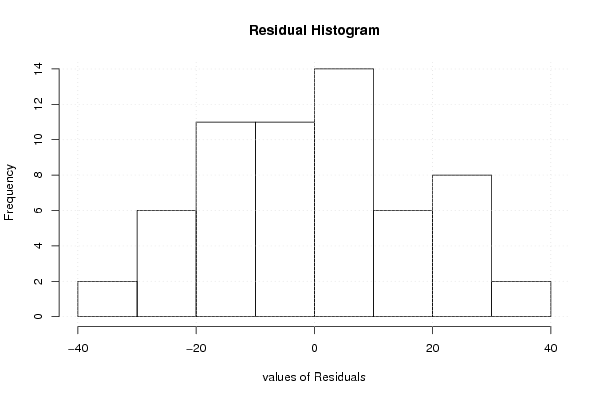
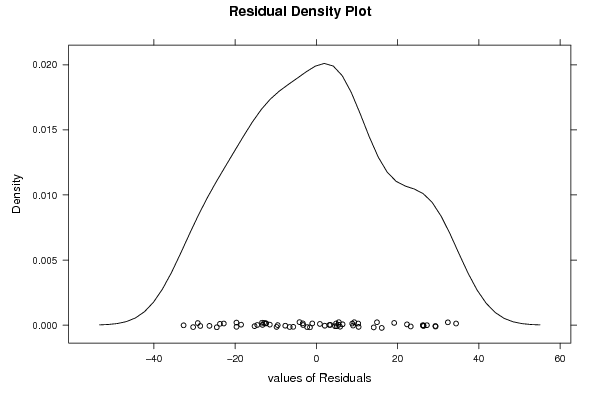
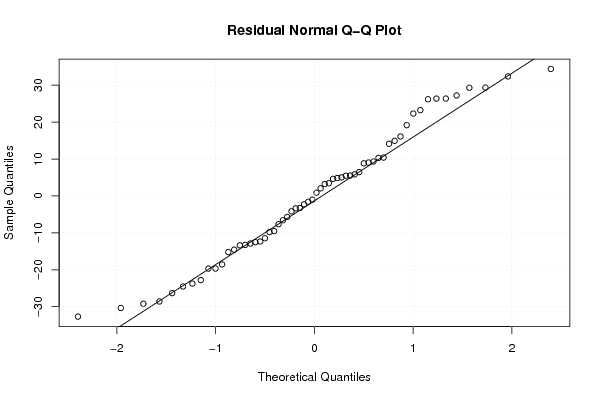
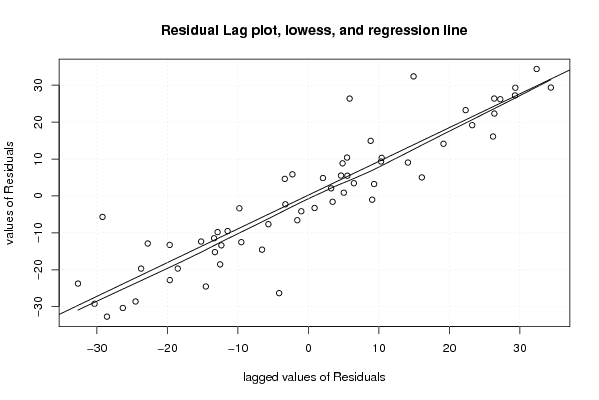
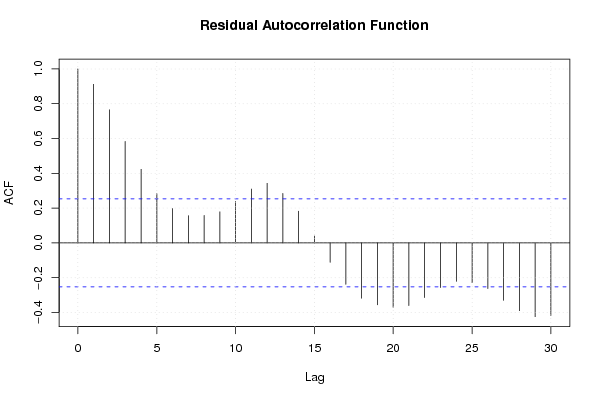
| Multiple Linear Regression - Residual Statistics | |
| Residual Standard Deviation | 17.8483841551159 |
| Sum Squared Residuals | 18476.7593830185 |
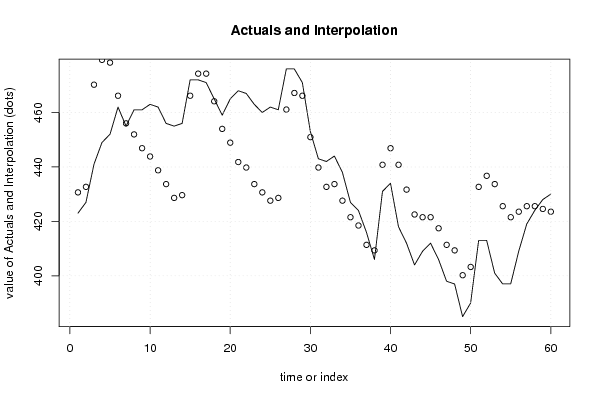
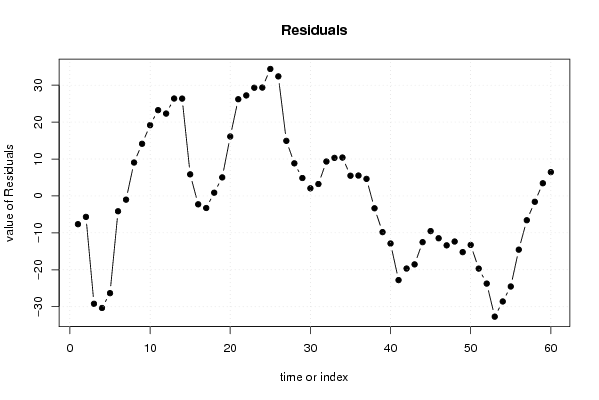
| Multiple Linear Regression - Actuals, Interpolation, and Residuals | |||
| Time or Index | Actuals | Interpolation Forecast | Residuals Prediction Error |
| 1 | 423 | 430.652763173627 | -7.65276317362673 |
| 2 | 427 | 432.681503122308 | -5.68150312230792 |
| 3 | 441 | 470.213192172924 | -29.2131921729241 |
| 4 | 449 | 479.342521941993 | -30.3425219419928 |
| 5 | 452 | 478.328151967652 | -26.3281519676519 |
| 6 | 462 | 466.15571227556 | -4.15571227556016 |
| 7 | 455 | 456.01201253215 | -1.01201253215042 |
| 8 | 461 | 451.954532634787 | 9.04546736521348 |
| 9 | 461 | 446.882682763082 | 14.1173172369183 |
| 10 | 463 | 443.839572840059 | 19.1604271599413 |
| 11 | 462 | 438.767722968354 | 23.2322770316461 |
| 12 | 456 | 433.695873096649 | 22.304126903351 |
| 13 | 455 | 428.624023224944 | 26.3759767750559 |
| 14 | 456 | 429.638393199285 | 26.3616068007149 |
| 15 | 472 | 466.15571227556 | 5.84428772443984 |
| 16 | 472 | 474.270672070288 | -2.27067207028795 |
| 17 | 471 | 474.270672070288 | -3.27067207028795 |
| 18 | 465 | 464.126972326878 | 0.87302767312179 |
| 19 | 459 | 453.983272583468 | 5.01672741653153 |
| 20 | 465 | 448.911422711764 | 16.0885772882364 |
| 21 | 468 | 441.810832891377 | 26.1891671086232 |
| 22 | 467 | 439.782092942695 | 27.2179070573052 |
| 23 | 463 | 433.695873096649 | 29.304126903351 |
| 24 | 460 | 430.652763173626 | 29.3472368263739 |
| 25 | 462 | 427.609653250603 | 34.3903467493969 |
| 26 | 461 | 428.624023224944 | 32.3759767750559 |
| 27 | 476 | 461.083862403855 | 14.9161375961447 |
| 28 | 476 | 467.170082249901 | 8.82991775009886 |
| 29 | 471 | 466.15571227556 | 4.84428772443984 |
| 30 | 453 | 450.940162660446 | 2.05983733955445 |
| 31 | 443 | 439.782092942695 | 3.21790705730516 |
| 32 | 442 | 432.681503122308 | 9.31849687769198 |
| 33 | 444 | 433.695873096649 | 10.304126903351 |
| 34 | 438 | 427.609653250603 | 10.3903467493969 |
| 35 | 427 | 421.523433404557 | 5.4765665954427 |
| 36 | 424 | 418.480323481534 | 5.51967651846562 |
| 37 | 416 | 411.379733661148 | 4.62026633885244 |
| 38 | 406 | 409.350993712466 | -3.35099371246562 |
| 39 | 431 | 440.796462917036 | -9.7964629170358 |
| 40 | 434 | 446.882682763082 | -12.8826827630817 |
| 41 | 418 | 440.796462917036 | -22.7964629170358 |
| 42 | 412 | 431.667133147967 | -19.6671331479670 |
| 43 | 404 | 422.537803378898 | -18.5378033788983 |
| 44 | 409 | 421.523433404557 | -12.5234334045573 |
| 45 | 412 | 421.523433404557 | -9.5234334045573 |
| 46 | 406 | 417.465953507193 | -11.4659535071934 |
| 47 | 398 | 411.379733661148 | -13.3797336611476 |
| 48 | 397 | 409.350993712466 | -12.3509937124656 |
| 49 | 385 | 400.221663943397 | -15.2216639433968 |
| 50 | 390 | 403.26477386642 | -13.2647738664198 |
| 51 | 413 | 432.681503122308 | -19.681503122308 |
| 52 | 413 | 436.738983019672 | -23.7389830196719 |
| 53 | 401 | 433.695873096649 | -32.695873096649 |
| 54 | 397 | 425.580913301921 | -28.5809133019212 |
| 55 | 397 | 421.523433404557 | -24.5234334045573 |
| 56 | 409 | 423.552173353239 | -14.5521733532393 |
| 57 | 419 | 425.580913301921 | -6.5809133019212 |
| 58 | 424 | 425.580913301921 | -1.5809133019212 |
| 59 | 428 | 424.56654332758 | 3.43345667241977 |
| 60 | 430 | 423.552173353239 | 6.44782664676075 |
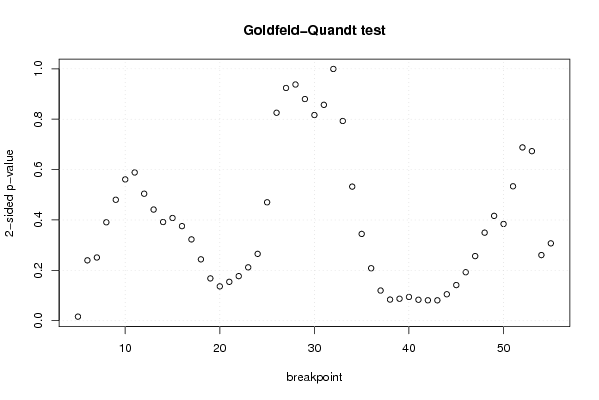
| Goldfeld-Quandt test for Heteroskedasticity | |||
| p-values | Alternative Hypothesis | ||
| breakpoint index | greater | 2-sided | less |
| 5 | 0.00802807410300564 | 0.0160561482060113 | 0.991971925896994 |
| 6 | 0.119833317014239 | 0.239666634028478 | 0.88016668298576 |
| 7 | 0.125488890239168 | 0.250977780478337 | 0.874511109760832 |
| 8 | 0.195345815357037 | 0.390691630714073 | 0.804654184642963 |
| 9 | 0.240031784361804 | 0.480063568723609 | 0.759968215638196 |
| 10 | 0.280432836375595 | 0.560865672751191 | 0.719567163624405 |
| 11 | 0.294261364911667 | 0.588522729823334 | 0.705738635088333 |
| 12 | 0.252034447360624 | 0.504068894721248 | 0.747965552639376 |
| 13 | 0.220615860370385 | 0.44123172074077 | 0.779384139629615 |
| 14 | 0.195854059552947 | 0.391708119105894 | 0.804145940447053 |
| 15 | 0.203888787599536 | 0.407777575199072 | 0.796111212400464 |
| 16 | 0.187735542369193 | 0.375471084738387 | 0.812264457630807 |
| 17 | 0.161421872104140 | 0.322843744208280 | 0.83857812789586 |
| 18 | 0.121769347790746 | 0.243538695581492 | 0.878230652209254 |
| 19 | 0.0839762847840472 | 0.167952569568094 | 0.916023715215953 |
| 20 | 0.0681454147720377 | 0.136290829544075 | 0.931854585227962 |
| 21 | 0.0771397943335713 | 0.154279588667143 | 0.922860205666429 |
| 22 | 0.0884771366814836 | 0.176954273362967 | 0.911522863318516 |
| 23 | 0.1059157297998 | 0.2118314595996 | 0.8940842702002 |
| 24 | 0.13265778824083 | 0.26531557648166 | 0.86734221175917 |
| 25 | 0.235048300406526 | 0.470096600813051 | 0.764951699593474 |
| 26 | 0.412792763345829 | 0.825585526691657 | 0.587207236654171 |
| 27 | 0.461978761027825 | 0.92395752205565 | 0.538021238972175 |
| 28 | 0.468829811495344 | 0.937659622990687 | 0.531170188504656 |
| 29 | 0.440008970447382 | 0.880017940894764 | 0.559991029552618 |
| 30 | 0.408237649742318 | 0.816475299484635 | 0.591762350257682 |
| 31 | 0.428545584977197 | 0.857091169954393 | 0.571454415022803 |
| 32 | 0.500250644538914 | 0.999498710922172 | 0.499749355461086 |
| 33 | 0.603552523404407 | 0.792894953191185 | 0.396447476595593 |
| 34 | 0.733849607506292 | 0.532300784987415 | 0.266150392493708 |
| 35 | 0.827712996689425 | 0.344574006621149 | 0.172287003310575 |
| 36 | 0.895890004391894 | 0.208219991216213 | 0.104109995608106 |
| 37 | 0.940150382058067 | 0.119699235883865 | 0.0598496179419327 |
| 38 | 0.958078170847133 | 0.0838436583057344 | 0.0419218291528672 |
| 39 | 0.956410089753458 | 0.0871798204930839 | 0.0435899102465419 |
| 40 | 0.952896576375722 | 0.094206847248557 | 0.0471034236242785 |
| 41 | 0.958421362851975 | 0.08315727429605 | 0.041578637148025 |
| 42 | 0.959464678150373 | 0.0810706436992538 | 0.0405353218496269 |
| 43 | 0.959537012830988 | 0.0809259743380248 | 0.0404629871690124 |
| 44 | 0.947501093910528 | 0.104997812178945 | 0.0524989060894723 |
| 45 | 0.929307561732935 | 0.141384876534130 | 0.0706924382670648 |
| 46 | 0.903805849781808 | 0.192388300436383 | 0.0961941502181916 |
| 47 | 0.871771024545723 | 0.256457950908555 | 0.128228975454277 |
| 48 | 0.825253828239941 | 0.349492343520118 | 0.174746171760059 |
| 49 | 0.79191219193627 | 0.41617561612746 | 0.20808780806373 |
| 50 | 0.807984005710756 | 0.384031988578487 | 0.192015994289244 |
| 51 | 0.73318050975012 | 0.533638980499759 | 0.266819490249879 |
| 52 | 0.656010065710008 | 0.687979868579984 | 0.343989934289992 |
| 53 | 0.663439316594966 | 0.673121366810068 | 0.336560683405034 |
| 54 | 0.869769150122112 | 0.260461699755775 | 0.130230849877888 |
| 55 | 0.846435187117987 | 0.307129625764025 | 0.153564812882013 |
| Meta Analysis of Goldfeld-Quandt test for Heteroskedasticity | |||
| Description | # significant tests | % significant tests | OK/NOK |
| 1% type I error level | 0 | 0 | OK |
| 5% type I error level | 1 | 0.0196078431372549 | OK |
| 10% type I error level | 7 | 0.137254901960784 | NOK |