| Multiple Linear Regression - Estimated Regression Equation |
| WLMan[t] = + 3.06136906151439 + 0.483974470410013WLVrouw[t] + 0.259166439019543M1[t] + 0.253554573223732M2[t] + 0.164737601509922M3[t] + 0.104318076837112M4[t] + 0.00582161571510191M5[t] -0.237226165346313M6[t] -0.255209948593140M7[t] -0.355693644920158M8[t] -0.284510616633968M9[t] -0.266212183673976M10[t] -0.176952218938585M11[t] -0.00534966597958625t + e[t] |
| Multiple Linear Regression - Ordinary Least Squares | |||||
| Variable | Parameter | S.D. | T-STAT H0: parameter = 0 | 2-tail p-value | 1-tail p-value |
| (Intercept) | 3.06136906151439 | 0.994852 | 3.0772 | 0.003515 | 0.001757 |
| WLVrouw | 0.483974470410013 | 0.095914 | 5.0459 | 8e-06 | 4e-06 |
| M1 | 0.259166439019543 | 0.250677 | 1.0339 | 0.306604 | 0.153302 |
| M2 | 0.253554573223732 | 0.250278 | 1.0131 | 0.316315 | 0.158158 |
| M3 | 0.164737601509922 | 0.250602 | 0.6574 | 0.514221 | 0.25711 |
| M4 | 0.104318076837112 | 0.254379 | 0.4101 | 0.683645 | 0.341822 |
| M5 | 0.00582161571510191 | 0.258465 | 0.0225 | 0.982128 | 0.491064 |
| M6 | -0.237226165346313 | 0.255006 | -0.9303 | 0.357083 | 0.178542 |
| M7 | -0.255209948593140 | 0.253746 | -1.0058 | 0.319789 | 0.159895 |
| M8 | -0.355693644920158 | 0.260746 | -1.3641 | 0.179161 | 0.089581 |
| M9 | -0.284510616633968 | 0.255123 | -1.1152 | 0.270562 | 0.135281 |
| M10 | -0.266212183673976 | 0.249265 | -1.068 | 0.291099 | 0.14555 |
| M11 | -0.176952218938585 | 0.248861 | -0.711 | 0.480644 | 0.240322 |
| t | -0.00534966597958625 | 0.004964 | -1.0778 | 0.286762 | 0.143381 |
| Multiple Linear Regression - Regression Statistics | |
| Multiple R | 0.855373338223595 |
| R-squared | 0.731663547743777 |
| Adjusted R-squared | 0.655829332975714 |
| F-TEST (value) | 9.64819837564813 |
| F-TEST (DF numerator) | 13 |
| F-TEST (DF denominator) | 46 |
| p-value | 3.1079736562134e-09 |
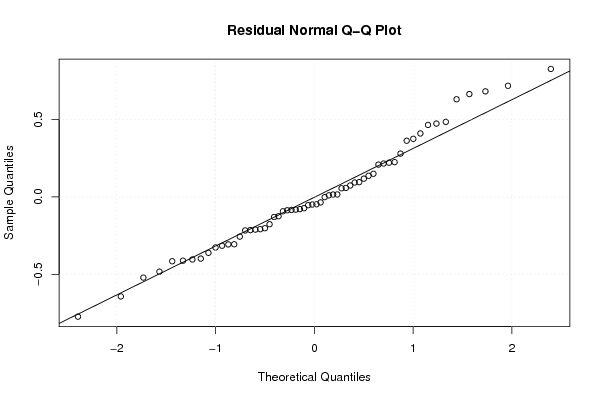
| Multiple Linear Regression - Residual Statistics | |
| Residual Standard Deviation | 0.392871359511733 |
| Sum Squared Residuals | 7.10000363573149 |
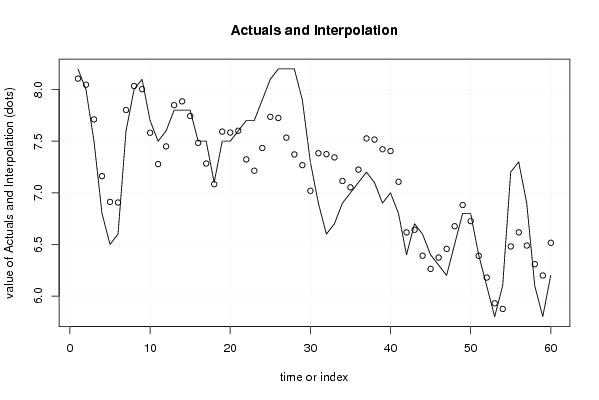
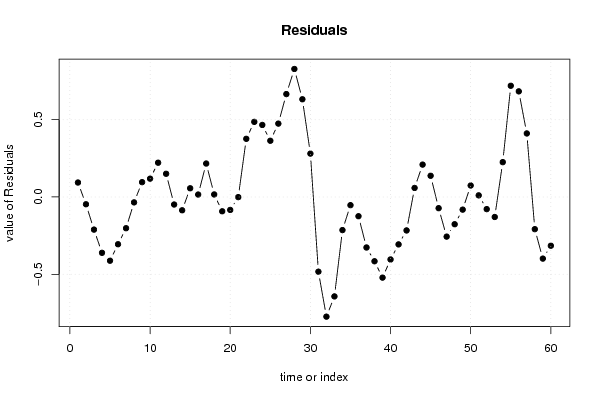
| Multiple Linear Regression - Actuals, Interpolation, and Residuals | |||
| Time or Index | Actuals | Interpolation Forecast | Residuals Prediction Error |
| 1 | 8.2 | 8.10653309161349 | 0.0934669083865133 |
| 2 | 8 | 8.04717411279708 | -0.0471741127970784 |
| 3 | 7.5 | 7.71102023989868 | -0.211020239898676 |
| 4 | 6.8 | 7.16127657883627 | -0.361276578836268 |
| 5 | 6.5 | 6.91223811061167 | -0.412238110611666 |
| 6 | 6.6 | 6.90582789877567 | -0.305827898775672 |
| 7 | 7.6 | 7.80204594332828 | -0.202045943328284 |
| 8 | 8 | 8.03499471030869 | -0.034994710308689 |
| 9 | 8.1 | 8.00403317853329 | 0.0959668214667092 |
| 10 | 7.7 | 7.58140492214468 | 0.118595077855316 |
| 11 | 7.5 | 7.27813564457248 | 0.221864355427522 |
| 12 | 7.6 | 7.44973819753148 | 0.150261802468523 |
| 13 | 7.8 | 7.84874731169444 | -0.0487473116944376 |
| 14 | 7.8 | 7.88618322696004 | -0.0861832269600417 |
| 15 | 7.8 | 7.74361914222564 | 0.0563808577743558 |
| 16 | 7.5 | 7.48426016340924 | 0.0157398365907572 |
| 17 | 7.5 | 7.28361914222564 | 0.216380857774356 |
| 18 | 7.1 | 7.08361914222564 | 0.0163808577743564 |
| 19 | 7.5 | 7.59265761045024 | -0.0926576104502444 |
| 20 | 7.5 | 7.58361914222564 | -0.0836191422256437 |
| 21 | 7.6 | 7.60105505749125 | -0.00105505749124558 |
| 22 | 7.7 | 7.32361914222564 | 0.376380857774357 |
| 23 | 7.7 | 7.21393965281744 | 0.486060347182557 |
| 24 | 7.9 | 7.43393965281744 | 0.466060347182557 |
| 25 | 8.1 | 7.7361538728984 | 0.363846127101598 |
| 26 | 8.2 | 7.725192341123 | 0.474807658876995 |
| 27 | 8.2 | 7.5342308093476 | 0.665769190652395 |
| 28 | 8.2 | 7.3716667246132 | 0.828333275386793 |
| 29 | 7.9 | 7.26782059751161 | 0.63217940248839 |
| 30 | 7.3 | 7.01942315047061 | 0.280576849529392 |
| 31 | 6.9 | 7.3832692775722 | -0.483269277572206 |
| 32 | 6.6 | 7.3742308093476 | -0.774230809347605 |
| 33 | 6.7 | 7.3432692775722 | -0.643269277572206 |
| 34 | 6.9 | 7.1142308093476 | -0.214230809347605 |
| 35 | 7 | 7.05294876698041 | -0.052948766980406 |
| 36 | 7.1 | 7.2245513199394 | -0.124551319939405 |
| 37 | 7.2 | 7.52676554002036 | -0.326765540020362 |
| 38 | 7.1 | 7.51580400824496 | -0.415804008244965 |
| 39 | 6.9 | 7.42163737055157 | -0.521637370551568 |
| 40 | 7 | 7.40426562694017 | -0.404265626940174 |
| 41 | 6.8 | 7.10682971167457 | -0.306829711674573 |
| 42 | 6.4 | 6.61644502942856 | -0.216445029428564 |
| 43 | 6.7 | 6.64150902724315 | 0.0584909727568479 |
| 44 | 6.6 | 6.39048332381354 | 0.209516676186455 |
| 45 | 6.4 | 6.26272689795614 | 0.137273102043858 |
| 46 | 6.3 | 6.37247055901855 | -0.0724705590185516 |
| 47 | 6.2 | 6.45638085777436 | -0.256380857774356 |
| 48 | 6.5 | 6.67638085777436 | -0.176380857774356 |
| 49 | 6.8 | 6.88180018377331 | -0.0818001837733118 |
| 50 | 6.8 | 6.72564631087491 | 0.0743536891250899 |
| 51 | 6.4 | 6.3894924379765 | 0.0105075620234931 |
| 52 | 6.1 | 6.17853090620111 | -0.0785309062011079 |
| 53 | 5.8 | 5.9294924379765 | -0.129492437976507 |
| 54 | 6.1 | 5.87468477909951 | 0.225315220900489 |
| 55 | 7.2 | 6.48051814140611 | 0.719481858593886 |
| 56 | 7.3 | 6.61667201430452 | 0.683327985695483 |
| 57 | 6.9 | 6.48891558844712 | 0.411084411552884 |
| 58 | 6.1 | 6.30827456726352 | -0.208274567263517 |
| 59 | 5.8 | 6.19859507785532 | -0.398595077855316 |
| 60 | 6.2 | 6.51538997193732 | -0.315389971937318 |
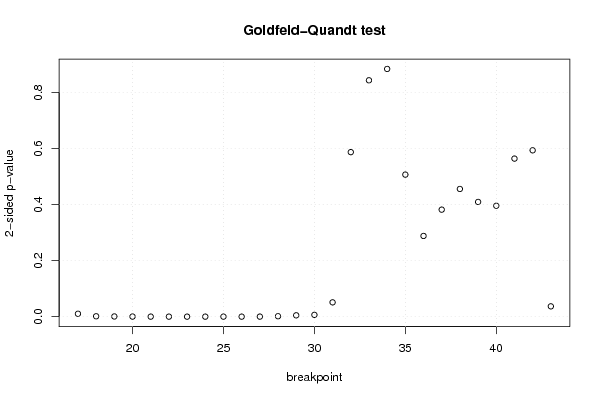
| Goldfeld-Quandt test for Heteroskedasticity | |||
| p-values | Alternative Hypothesis | ||
| breakpoint index | greater | 2-sided | less |
| 17 | 0.00513356096995604 | 0.0102671219399121 | 0.994866439030044 |
| 18 | 0.000665141526255712 | 0.00133028305251142 | 0.999334858473744 |
| 19 | 0.000343403723960222 | 0.000686807447920444 | 0.99965659627604 |
| 20 | 0.000144520318826106 | 0.000289040637652212 | 0.999855479681174 |
| 21 | 2.25283597051782e-05 | 4.50567194103564e-05 | 0.999977471640295 |
| 22 | 2.96577437613986e-05 | 5.93154875227972e-05 | 0.999970342256239 |
| 23 | 7.21257982427057e-06 | 1.44251596485411e-05 | 0.999992787420176 |
| 24 | 1.84097440275898e-06 | 3.68194880551796e-06 | 0.999998159025597 |
| 25 | 8.53108423484873e-07 | 1.70621684696975e-06 | 0.999999146891577 |
| 26 | 3.58514114687643e-06 | 7.17028229375285e-06 | 0.999996414858853 |
| 27 | 5.04561291695984e-05 | 0.000100912258339197 | 0.99994954387083 |
| 28 | 0.000793478065906939 | 0.00158695613181388 | 0.999206521934093 |
| 29 | 0.00239820882817506 | 0.00479641765635012 | 0.997601791171825 |
| 30 | 0.00323409178307338 | 0.00646818356614675 | 0.996765908216927 |
| 31 | 0.0255119974074922 | 0.0510239948149845 | 0.974488002592508 |
| 32 | 0.293338948277132 | 0.586677896554264 | 0.706661051722868 |
| 33 | 0.578556758615424 | 0.842886482769151 | 0.421443241384576 |
| 34 | 0.558323125011833 | 0.883353749976333 | 0.441676874988167 |
| 35 | 0.746721497579959 | 0.506557004840082 | 0.253278502420041 |
| 36 | 0.856101155273515 | 0.28779768945297 | 0.143898844726485 |
| 37 | 0.809205990993958 | 0.381588018012084 | 0.190794009006042 |
| 38 | 0.772309583486857 | 0.455380833026285 | 0.227690416513143 |
| 39 | 0.795453688984419 | 0.409092622031162 | 0.204546311015581 |
| 40 | 0.80229504481593 | 0.395409910368138 | 0.197704955184069 |
| 41 | 0.718170931870497 | 0.563658136259006 | 0.281829068129503 |
| 42 | 0.703399219492943 | 0.593201561014114 | 0.296600780507057 |
| 43 | 0.981605046481812 | 0.0367899070363755 | 0.0183949535181878 |
| Meta Analysis of Goldfeld-Quandt test for Heteroskedasticity | |||
| Description | # significant tests | % significant tests | OK/NOK |
| 1% type I error level | 13 | 0.481481481481481 | NOK |
| 5% type I error level | 15 | 0.555555555555556 | NOK |
| 10% type I error level | 16 | 0.592592592592593 | NOK |