| Multiple Linear Regression - Estimated Regression Equation |
| Import[t] = + 159.23583988678 -0.527705277557674Wisselkoers[t] -1.42952943199583M1[t] -9.62959659104806M2[t] -1.74482004101209M3[t] + 4.7166932453793M4[t] + 2.2752518187206M5[t] -4.09312791143662M6[t] -8.21383428477751M7[t] -12.0086173119050M8[t] + 4.34543457019099M9[t] -8.35340229011195M10[t] -1.39536111330011M11[t] + 0.355466572662176t + e[t] |
| Multiple Linear Regression - Ordinary Least Squares | |||||
| Variable | Parameter | S.D. | T-STAT H0: parameter = 0 | 2-tail p-value | 1-tail p-value |
| (Intercept) | 159.23583988678 | 33.816236 | 4.7089 | 2.3e-05 | 1.2e-05 |
| Wisselkoers | -0.527705277557674 | 0.333419 | -1.5827 | 0.12034 | 0.06017 |
| M1 | -1.42952943199583 | 8.631223 | -0.1656 | 0.869179 | 0.43459 |
| M2 | -9.62959659104806 | 8.641211 | -1.1144 | 0.270905 | 0.135452 |
| M3 | -1.74482004101209 | 8.624537 | -0.2023 | 0.840567 | 0.420284 |
| M4 | 4.7166932453793 | 8.5931 | 0.5489 | 0.585733 | 0.292867 |
| M5 | 2.2752518187206 | 8.586352 | 0.265 | 0.792205 | 0.396103 |
| M6 | -4.09312791143662 | 8.597037 | -0.4761 | 0.63625 | 0.318125 |
| M7 | -8.21383428477751 | 8.569283 | -0.9585 | 0.342811 | 0.171406 |
| M8 | -12.0086173119050 | 8.564508 | -1.4021 | 0.167587 | 0.083793 |
| M9 | 4.34543457019099 | 8.56554 | 0.5073 | 0.614357 | 0.307178 |
| M10 | -8.35340229011195 | 8.55609 | -0.9763 | 0.334017 | 0.167009 |
| M11 | -1.39536111330011 | 8.555046 | -0.1631 | 0.871151 | 0.435576 |
| t | 0.355466572662176 | 0.131429 | 2.7046 | 0.009555 | 0.004777 |
| Multiple Linear Regression - Regression Statistics | |
| Multiple R | 0.660933492374028 |
| R-squared | 0.436833081341729 |
| Adjusted R-squared | 0.277677213025261 |
| F-TEST (value) | 2.74468724252834 |
| F-TEST (DF numerator) | 13 |
| F-TEST (DF denominator) | 46 |
| p-value | 0.00585073172241857 |
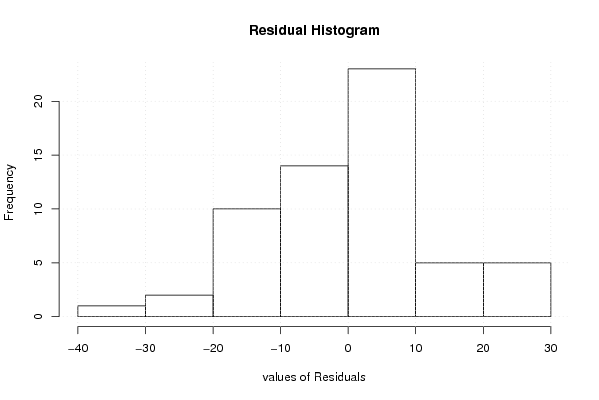
| Multiple Linear Regression - Residual Statistics | |
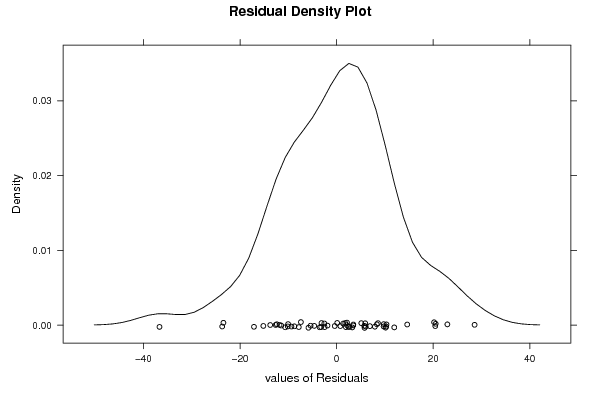
| Residual Standard Deviation | 13.5244071167880 |
| Sum Squared Residuals | 8413.84104158875 |
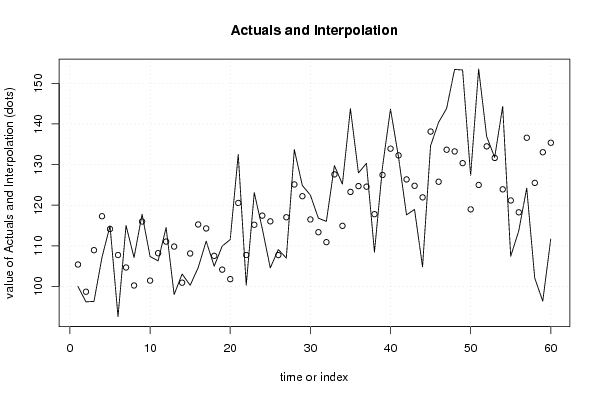
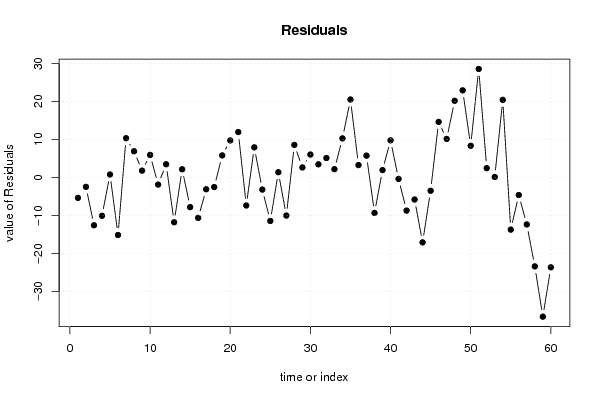
| Multiple Linear Regression - Actuals, Interpolation, and Residuals | |||
| Time or Index | Actuals | Interpolation Forecast | Residuals Prediction Error |
| 1 | 100 | 105.391249271679 | -5.39124927167932 |
| 2 | 96.21064363 | 98.695851017067 | -2.48520738706693 |
| 3 | 96.31280765 | 108.926888594905 | -12.6140809449054 |
| 4 | 107.1793443 | 117.287464338132 | -10.1081200381317 |
| 5 | 114.9066592 | 114.142165297816 | 0.764493902184287 |
| 6 | 92.56060184 | 107.732730917186 | -15.1721290771860 |
| 7 | 114.9995356 | 104.669301446948 | 10.3302341530519 |
| 8 | 107.1236185 | 100.237134525991 | 6.88648397400883 |
| 9 | 117.7765394 | 115.988747965127 | 1.78779143487328 |
| 10 | 107.3650971 | 101.436722188219 | 5.92837491178112 |
| 11 | 106.2970187 | 108.186589513849 | -1.88957081384937 |
| 12 | 114.5072908 | 111.048643785935 | 3.45864701406529 |
| 13 | 98.0031578 | 109.820485682116 | -11.8173278821162 |
| 14 | 103.0649206 | 100.920687327210 | 2.14423327279016 |
| 15 | 100.2879168 | 108.118305243798 | -7.83038844379835 |
| 16 | 104.6066685 | 115.258240363324 | -10.6515718633235 |
| 17 | 111.1544534 | 114.282138098695 | -3.12768469869481 |
| 18 | 104.9874617 | 107.532920511491 | -2.54545881149098 |
| 19 | 109.9284852 | 104.136090815236 | 5.79239438476421 |
| 20 | 111.5352466 | 101.793945384899 | 9.74130121510055 |
| 21 | 132.4974459 | 120.556670092962 | 11.9407758070384 |
| 22 | 100.3436426 | 107.734315059994 | -7.39067245999414 |
| 23 | 123.0983561 | 115.18444532588 | 7.91391077411996 |
| 24 | 114.2379493 | 117.439209578262 | -3.20126027826215 |
| 25 | 104.569518 | 116.032971539605 | -11.4634535396049 |
| 26 | 109.0833101 | 107.722345683804 | 1.36096441619577 |
| 27 | 106.9843039 | 117.034292193461 | -10.0499882934606 |
| 28 | 133.6769759 | 125.108985803101 | 8.56799009689892 |
| 29 | 124.8537197 | 122.219652492628 | 2.63406720737165 |
| 30 | 122.5132349 | 116.491267493072 | 6.02196740692788 |
| 31 | 116.8013374 | 113.351693058939 | 3.44964434106131 |
| 32 | 116.0118882 | 110.899424318192 | 5.11246388180813 |
| 33 | 129.7575926 | 127.591276625062 | 2.16631597493833 |
| 34 | 125.1973623 | 114.920760205224 | 10.2766020947764 |
| 35 | 143.7912139 | 123.274636497789 | 20.5165774022106 |
| 36 | 127.9465032 | 124.701090477879 | 3.24541272212068 |
| 37 | 130.2962757 | 124.560303188229 | 5.7359725117707 |
| 38 | 108.4424631 | 117.795207462249 | -9.35274436224869 |
| 39 | 129.3675118 | 127.445905599094 | 1.92160620090552 |
| 40 | 143.6797622 | 133.919298203648 | 9.76046399635223 |
| 41 | 131.8844618 | 132.278329774848 | -0.393867974848265 |
| 42 | 117.6186496 | 126.354521062442 | -8.73587146244193 |
| 43 | 118.9560695 | 124.782656158174 | -5.82658665817375 |
| 44 | 104.8202842 | 121.933866189015 | -17.1135819890153 |
| 45 | 134.624315 | 138.132936099242 | -3.50862109924163 |
| 46 | 140.401226 | 125.778862967040 | 14.6223630329598 |
| 47 | 143.8005015 | 133.662845477793 | 10.1376560222074 |
| 48 | 153.4317823 | 133.243122417698 | 20.1886598823023 |
| 49 | 153.2924677 | 130.356409518370 | 22.9360581816297 |
| 50 | 127.3149438 | 118.982189739670 | 8.3327540603297 |
| 51 | 153.5525216 | 124.979670118741 | 28.5728514812588 |
| 52 | 136.9276493 | 134.496411491796 | 2.43123780820405 |
| 53 | 131.7730101 | 131.650018536013 | 0.122991563987134 |
| 54 | 144.3391845 | 123.907692555809 | 20.4314919441911 |
| 55 | 107.4208229 | 121.166509120704 | -13.7456862207037 |
| 56 | 113.6249652 | 118.251632281902 | -4.62666708190224 |
| 57 | 124.2221603 | 136.608422417608 | -12.3862621176083 |
| 58 | 102.0618557 | 125.498523279523 | -23.4366675795232 |
| 59 | 96.36853348 | 133.047106864689 | -36.6785733846885 |
| 60 | 111.6838488 | 135.375308140226 | -23.6914593402261 |
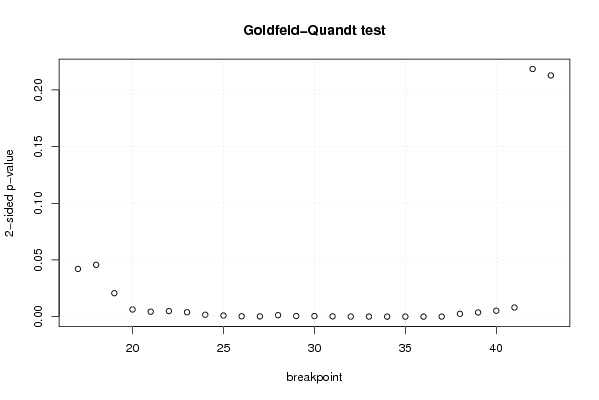
| Goldfeld-Quandt test for Heteroskedasticity | |||
| p-values | Alternative Hypothesis | ||
| breakpoint index | greater | 2-sided | less |
| 17 | 0.0210476302330990 | 0.0420952604661981 | 0.978952369766901 |
| 18 | 0.0228611839239628 | 0.0457223678479255 | 0.977138816076037 |
| 19 | 0.0103557561510918 | 0.0207115123021836 | 0.989644243848908 |
| 20 | 0.0031783499544957 | 0.0063566999089914 | 0.996821650045504 |
| 21 | 0.00219219527024911 | 0.00438439054049821 | 0.99780780472975 |
| 22 | 0.00245921309234862 | 0.00491842618469725 | 0.997540786907651 |
| 23 | 0.00193897764818260 | 0.00387795529636520 | 0.998061022351817 |
| 24 | 0.000854946923354262 | 0.00170989384670852 | 0.999145053076646 |
| 25 | 0.000489220374722175 | 0.00097844074944435 | 0.999510779625278 |
| 26 | 0.000168036321892331 | 0.000336072643784661 | 0.999831963678108 |
| 27 | 0.000128592126157 | 0.000257184252314 | 0.999871407873843 |
| 28 | 0.000658942463577554 | 0.00131788492715511 | 0.999341057536422 |
| 29 | 0.000265480168157079 | 0.000530960336314157 | 0.999734519831843 |
| 30 | 0.000257099552178888 | 0.000514199104357777 | 0.999742900447821 |
| 31 | 0.000148410576408577 | 0.000296821152817154 | 0.999851589423591 |
| 32 | 6.57310452964148e-05 | 0.000131462090592830 | 0.999934268954704 |
| 33 | 3.1334055849358e-05 | 6.2668111698716e-05 | 0.99996866594415 |
| 34 | 1.68022111593111e-05 | 3.36044223186222e-05 | 0.99998319778884 |
| 35 | 2.41866322675995e-05 | 4.8373264535199e-05 | 0.999975813367732 |
| 36 | 8.37845168406375e-06 | 1.67569033681275e-05 | 0.999991621548316 |
| 37 | 4.75287384330502e-05 | 9.50574768661004e-05 | 0.999952471261567 |
| 38 | 0.00124820020034400 | 0.00249640040068799 | 0.998751799799656 |
| 39 | 0.00186708288373385 | 0.0037341657674677 | 0.998132917116266 |
| 40 | 0.00261170328189449 | 0.00522340656378898 | 0.997388296718106 |
| 41 | 0.00403366390922693 | 0.00806732781845385 | 0.995966336090773 |
| 42 | 0.109207857153101 | 0.218415714306202 | 0.890792142846899 |
| 43 | 0.106338076925775 | 0.212676153851551 | 0.893661923074225 |
| Meta Analysis of Goldfeld-Quandt test for Heteroskedasticity | |||
| Description | # significant tests | % significant tests | OK/NOK |
| 1% type I error level | 22 | 0.814814814814815 | NOK |
| 5% type I error level | 25 | 0.925925925925926 | NOK |
| 10% type I error level | 25 | 0.925925925925926 | NOK |