| Multiple Linear Regression - Estimated Regression Equation |
| tprod[t] = + 12.9908192957064 + 0.00822602769769642rente[t] + 1.71770940750858y1[t] -0.849061836576314y2[t] + 0.00908552672304065t + e[t] |
| Multiple Linear Regression - Ordinary Least Squares | |||||
| Variable | Parameter | S.D. | T-STAT H0: parameter = 0 | 2-tail p-value | 1-tail p-value |
| (Intercept) | 12.9908192957064 | 3.641248 | 3.5677 | 0.000774 | 0.000387 |
| rente | 0.00822602769769642 | 0.059448 | 0.1384 | 0.890471 | 0.445235 |
| y1 | 1.71770940750858 | 0.080118 | 21.4397 | 0 | 0 |
| y2 | -0.849061836576314 | 0.085439 | -9.9377 | 0 | 0 |
| t | 0.00908552672304065 | 0.003184 | 2.8535 | 0.006156 | 0.003078 |
| Multiple Linear Regression - Regression Statistics | |
| Multiple R | 0.992463563783446 |
| R-squared | 0.984983925437739 |
| Adjusted R-squared | 0.98385063679153 |
| F-TEST (value) | 869.137733562538 |
| F-TEST (DF numerator) | 4 |
| F-TEST (DF denominator) | 53 |
| p-value | 0 |
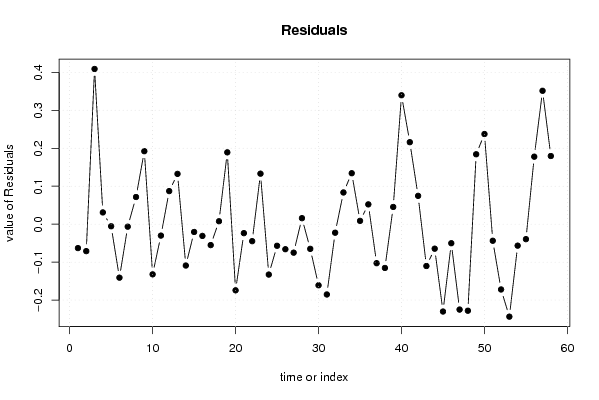
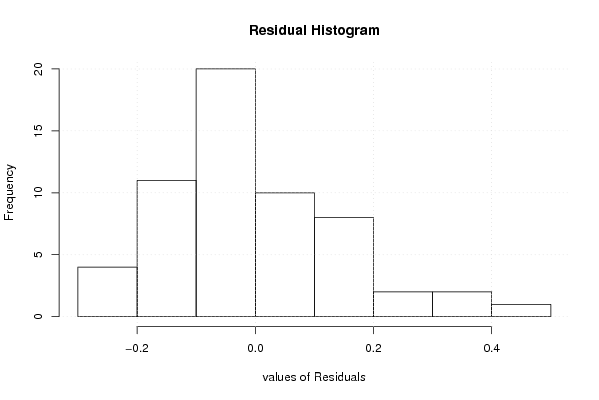
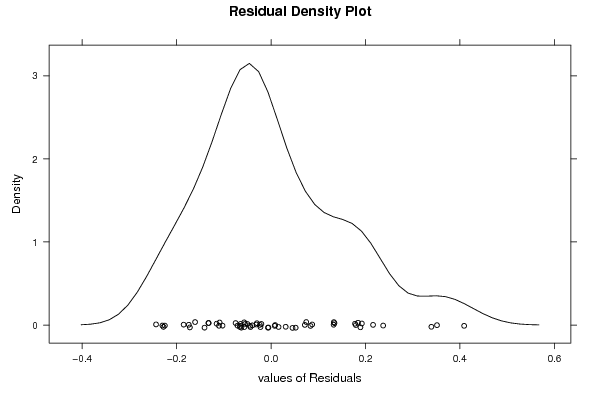
| Multiple Linear Regression - Residual Statistics | |
| Residual Standard Deviation | 0.153589057440373 |
| Sum Squared Residuals | 1.25024872396738 |
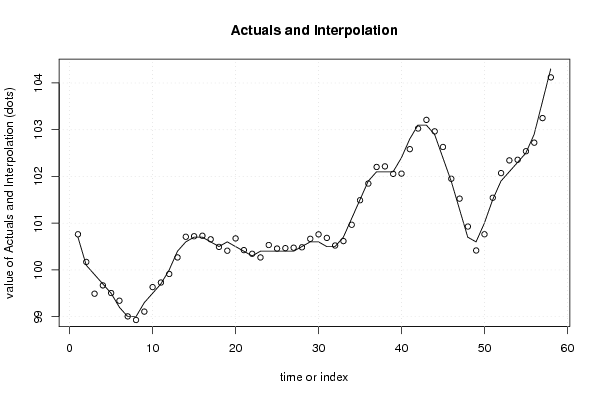
| Multiple Linear Regression - Actuals, Interpolation, and Residuals | |||
| Time or Index | Actuals | Interpolation Forecast | Residuals Prediction Error |
| 1 | 100.7 | 100.762989773365 | -0.062989773365053 |
| 2 | 100.1 | 100.17104936462 | -0.071049364619917 |
| 3 | 99.9 | 99.4911082281157 | 0.408891771884256 |
| 4 | 99.7 | 99.669050345254 | 0.0309496547459434 |
| 5 | 99.5 | 99.5055580016683 | -0.00555800166831006 |
| 6 | 99.2 | 99.3409140142049 | -0.140914014204893 |
| 7 | 99 | 99.006555592915 | -0.00655559291505667 |
| 8 | 99 | 98.9284629946488 | 0.0715370053511918 |
| 9 | 99.3 | 99.107772190072 | 0.192227809927998 |
| 10 | 99.5 | 99.6321705390476 | -0.132170539047608 |
| 11 | 99.7 | 99.7300793962995 | -0.0300793962994748 |
| 12 | 100 | 99.912894437209 | 0.0871055627910264 |
| 13 | 100.4 | 100.267480418869 | 0.132519581130688 |
| 14 | 100.6 | 100.708931157623 | -0.108931157622913 |
| 15 | 100.7 | 100.720535406509 | -0.0205354065085027 |
| 16 | 100.7 | 100.730921424451 | -0.0309214244513468 |
| 17 | 100.6 | 100.655100767517 | -0.0551007675167573 |
| 18 | 100.5 | 100.492333093212 | 0.00766690678805705 |
| 19 | 100.6 | 100.410769890101 | 0.189230109899161 |
| 20 | 100.5 | 100.674229253477 | -0.174229253476994 |
| 21 | 100.4 | 100.423676285820 | -0.0236762858203833 |
| 22 | 100.3 | 100.344745411573 | -0.0447454115725334 |
| 23 | 100.4 | 100.266966181202 | 0.133033818797680 |
| 24 | 100.4 | 100.532728832334 | -0.132728832333871 |
| 25 | 100.4 | 100.456908175399 | -0.0569081753992734 |
| 26 | 100.4 | 100.465993702122 | -0.065993702122314 |
| 27 | 100.4 | 100.475079228845 | -0.0750792288453547 |
| 28 | 100.5 | 100.484164755568 | 0.0158352444315989 |
| 29 | 100.6 | 100.665021223042 | -0.0650212230422954 |
| 30 | 100.6 | 100.760971506859 | -0.160971506858558 |
| 31 | 100.5 | 100.685150849924 | -0.185150849923966 |
| 32 | 100.5 | 100.522465435896 | -0.0224654358961586 |
| 33 | 100.7 | 100.616457146277 | 0.083542853723177 |
| 34 | 101.1 | 100.965794143423 | 0.134205856577486 |
| 35 | 101.5 | 101.491328463064 | 0.00867153693606944 |
| 36 | 101.9 | 101.847873018160 | 0.0521269818401117 |
| 37 | 102.1 | 102.202772367716 | -0.102772367716312 |
| 38 | 102.1 | 102.215363739926 | -0.115363739925633 |
| 39 | 102.1 | 102.054636899333 | 0.0453631006665791 |
| 40 | 102.4 | 102.060432014977 | 0.339567985022629 |
| 41 | 102.8 | 102.584007761183 | 0.215992238816756 |
| 42 | 103.1 | 103.025458499937 | 0.0745415000631995 |
| 43 | 103.1 | 103.210232114282 | -0.110232114281891 |
| 44 | 102.9 | 102.964599090032 | -0.064599090032029 |
| 45 | 102.4 | 102.630142735253 | -0.230142735253373 |
| 46 | 101.9 | 101.950185925537 | -0.0501859255373783 |
| 47 | 101.3 | 101.524947666794 | -0.224947666794295 |
| 48 | 100.7 | 100.927938467300 | -0.227938467300325 |
| 49 | 100.6 | 100.415835451464 | 0.184164548535967 |
| 50 | 101 | 100.762587139382 | 0.237412860618021 |
| 51 | 101.5 | 101.543662612766 | -0.043662612766099 |
| 52 | 101.9 | 102.071978108613 | -0.171978108612893 |
| 53 | 102.1 | 102.343616480051 | -0.243616480051229 |
| 54 | 102.3 | 102.356619153645 | -0.0566191536454327 |
| 55 | 102.5 | 102.539434194555 | -0.039434194554938 |
| 56 | 102.9 | 102.722249235464 | 0.177750764535572 |
| 57 | 103.6 | 103.248606157876 | 0.351393842124344 |
| 58 | 104.3 | 104.120463535224 | 0.179536464775851 |
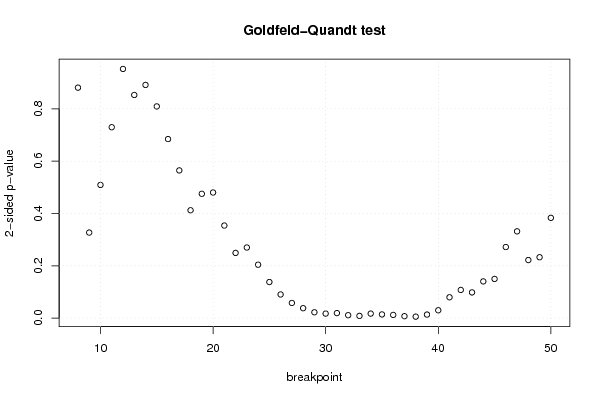
| Goldfeld-Quandt test for Heteroskedasticity | |||
| p-values | Alternative Hypothesis | ||
| breakpoint index | greater | 2-sided | less |
| 8 | 0.559511774984523 | 0.880976450030955 | 0.440488225015477 |
| 9 | 0.836521855502964 | 0.326956288994072 | 0.163478144497036 |
| 10 | 0.745483415163598 | 0.509033169672804 | 0.254516584836402 |
| 11 | 0.635149374753572 | 0.729701250492857 | 0.364850625246428 |
| 12 | 0.523746082529187 | 0.952507834941626 | 0.476253917470813 |
| 13 | 0.426493273265642 | 0.852986546531284 | 0.573506726734358 |
| 14 | 0.445741022594597 | 0.891482045189195 | 0.554258977405403 |
| 15 | 0.404646620098383 | 0.809293240196765 | 0.595353379901617 |
| 16 | 0.342242782490781 | 0.684485564981562 | 0.657757217509219 |
| 17 | 0.282301246858076 | 0.564602493716151 | 0.717698753141924 |
| 18 | 0.206113240920712 | 0.412226481841423 | 0.793886759079288 |
| 19 | 0.237583420066054 | 0.475166840132108 | 0.762416579933946 |
| 20 | 0.240033386596318 | 0.480066773192636 | 0.759966613403682 |
| 21 | 0.176882594588919 | 0.353765189177839 | 0.823117405411081 |
| 22 | 0.124544526983814 | 0.249089053967628 | 0.875455473016186 |
| 23 | 0.134918283884376 | 0.269836567768752 | 0.865081716115624 |
| 24 | 0.102022074909373 | 0.204044149818746 | 0.897977925090627 |
| 25 | 0.0688416707011073 | 0.137683341402215 | 0.931158329298893 |
| 26 | 0.0451449215336397 | 0.0902898430672794 | 0.95485507846636 |
| 27 | 0.0289087478070724 | 0.0578174956141449 | 0.971091252192928 |
| 28 | 0.0188992705785260 | 0.0377985411570519 | 0.981100729421474 |
| 29 | 0.0110820878850113 | 0.0221641757700226 | 0.988917912114989 |
| 30 | 0.0085756642230614 | 0.0171513284461228 | 0.991424335776939 |
| 31 | 0.0095382150288086 | 0.0190764300576172 | 0.990461784971191 |
| 32 | 0.00546666794050588 | 0.0109333358810118 | 0.994533332059494 |
| 33 | 0.00416697604882772 | 0.00833395209765544 | 0.995833023951172 |
| 34 | 0.00855758550309936 | 0.0171151710061987 | 0.9914424144969 |
| 35 | 0.00697827941798127 | 0.0139565588359625 | 0.993021720582019 |
| 36 | 0.00602549283527164 | 0.0120509856705433 | 0.993974507164728 |
| 37 | 0.00361472228435484 | 0.00722944456870968 | 0.996385277715645 |
| 38 | 0.00271531047543415 | 0.00543062095086831 | 0.997284689524566 |
| 39 | 0.00666681626034248 | 0.0133336325206850 | 0.993333183739658 |
| 40 | 0.0149187595399062 | 0.0298375190798124 | 0.985081240460094 |
| 41 | 0.0397830753337333 | 0.0795661506674665 | 0.960216924666267 |
| 42 | 0.0537816919434082 | 0.107563383886816 | 0.946218308056592 |
| 43 | 0.0490762789923609 | 0.0981525579847217 | 0.95092372100764 |
| 44 | 0.070105598972849 | 0.140211197945698 | 0.929894401027151 |
| 45 | 0.0748503970522165 | 0.149700794104433 | 0.925149602947783 |
| 46 | 0.135811889852485 | 0.271623779704971 | 0.864188110147515 |
| 47 | 0.165804602285627 | 0.331609204571253 | 0.834195397714373 |
| 48 | 0.110897507652459 | 0.221795015304918 | 0.88910249234754 |
| 49 | 0.116296644335282 | 0.232593288670563 | 0.883703355664718 |
| 50 | 0.808370413123654 | 0.383259173752691 | 0.191629586876346 |
| Meta Analysis of Goldfeld-Quandt test for Heteroskedasticity | |||
| Description | # significant tests | % significant tests | OK/NOK |
| 1% type I error level | 3 | 0.0697674418604651 | NOK |
| 5% type I error level | 13 | 0.302325581395349 | NOK |
| 10% type I error level | 17 | 0.395348837209302 | NOK |