| Multiple Linear Regression - Estimated Regression Equation |
| CPItot[t] = + 43.8313314423289 + 0.657891554789366CPIlandbouw[t] + e[t] |
| Multiple Linear Regression - Ordinary Least Squares | |||||
| Variable | Parameter | S.D. | T-STAT H0: parameter = 0 | 2-tail p-value | 1-tail p-value |
| (Intercept) | 43.8313314423289 | 2.970446 | 14.7558 | 0 | 0 |
| CPIlandbouw | 0.657891554789366 | 0.025756 | 25.543 | 0 | 0 |
| Multiple Linear Regression - Regression Statistics | |
| Multiple R | 0.958311670964566 |
| R-squared | 0.9183612587069 |
| Adjusted R-squared | 0.916953694201846 |
| F-TEST (value) | 652.447014264558 |
| F-TEST (DF numerator) | 1 |
| F-TEST (DF denominator) | 58 |
| p-value | 0 |
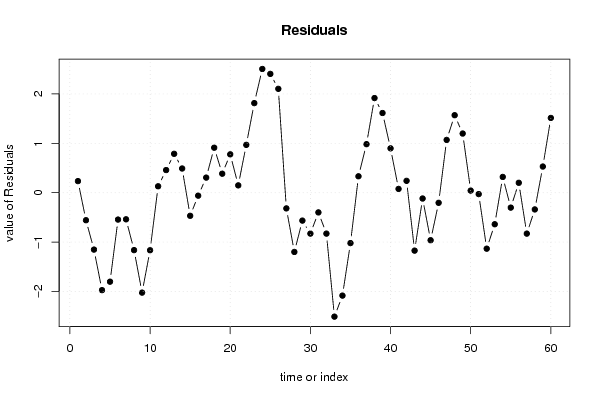
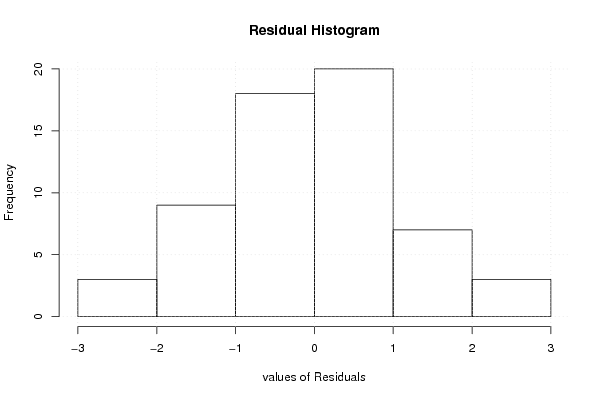
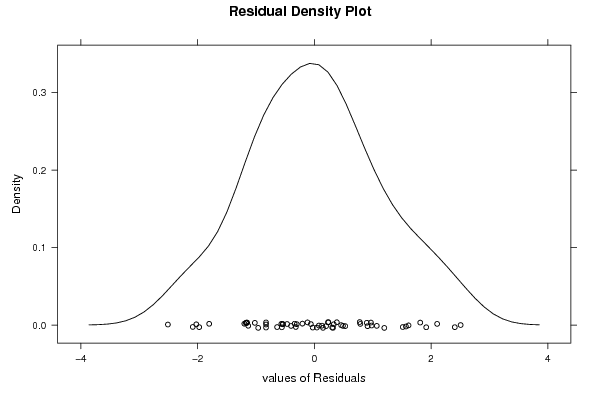
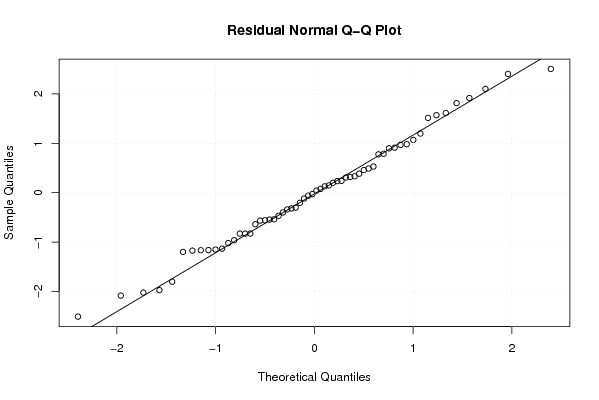
| Multiple Linear Regression - Residual Statistics | |
| Residual Standard Deviation | 1.14427941767553 |
| Sum Squared Residuals | 75.9437723715197 |
| Multiple Linear Regression - Actuals, Interpolation, and Residuals | |||
| Time or Index | Actuals | Interpolation Forecast | Residuals Prediction Error |
| 1 | 114 | 113.765203716438 | 0.234796283561588 |
| 2 | 113.8 | 114.357306115749 | -0.557306115748934 |
| 3 | 113.6 | 114.752041048623 | -1.15204104862256 |
| 4 | 113.7 | 115.673089225328 | -1.97308922532767 |
| 5 | 114.2 | 116.002035002722 | -1.80203500272235 |
| 6 | 114.8 | 115.344143447933 | -0.544143447932988 |
| 7 | 115.2 | 115.738878380807 | -0.538878380806598 |
| 8 | 115.3 | 116.462559091075 | -1.16255909107491 |
| 9 | 114.9 | 116.923083179427 | -2.02308317942745 |
| 10 | 115.1 | 116.265191624638 | -1.16519162463810 |
| 11 | 116 | 115.870456691764 | 0.129543308235524 |
| 12 | 116 | 115.541510914370 | 0.458489085630207 |
| 13 | 116 | 115.212565136975 | 0.78743486302489 |
| 14 | 115.9 | 115.409932603412 | 0.490067396588088 |
| 15 | 115.6 | 116.067824158201 | -0.467824158201289 |
| 16 | 116.6 | 116.659926557512 | -0.0599265575117226 |
| 17 | 116.9 | 116.594137402033 | 0.305862597967231 |
| 18 | 117.9 | 116.988872334906 | 0.911127665093606 |
| 19 | 117.9 | 117.515185578738 | 0.384814421262115 |
| 20 | 117.7 | 116.923083179427 | 0.776916820572545 |
| 21 | 117.4 | 117.252028956822 | 0.147971043177865 |
| 22 | 117.3 | 116.330980780117 | 0.969019219882963 |
| 23 | 119 | 117.186239801343 | 1.81376019865679 |
| 24 | 119.1 | 116.594137402033 | 2.50586259796722 |
| 25 | 119 | 116.594137402033 | 2.40586259796723 |
| 26 | 118.5 | 116.396769935596 | 2.10323006440403 |
| 27 | 117 | 117.317818112301 | -0.317818112301083 |
| 28 | 117.5 | 118.699390377359 | -1.19939037735875 |
| 29 | 118.2 | 118.765179532838 | -0.565179532837687 |
| 30 | 118.2 | 119.028336154753 | -0.828336154753427 |
| 31 | 118.3 | 118.699390377359 | -0.39939037735875 |
| 32 | 118.2 | 119.028336154753 | -0.828336154753427 |
| 33 | 117.9 | 120.409908419811 | -2.5099084198111 |
| 34 | 117.8 | 119.883595175980 | -2.08359517597961 |
| 35 | 118.6 | 119.620438554064 | -1.02043855406387 |
| 36 | 118.9 | 118.567812066401 | 0.332187933599133 |
| 37 | 120.8 | 119.817806020501 | 0.982193979499326 |
| 38 | 121.8 | 119.883595175980 | 1.91640482402039 |
| 39 | 121.3 | 119.686227709543 | 1.6137722904572 |
| 40 | 121.9 | 121.002010819122 | 0.897989180878478 |
| 41 | 122 | 121.923058995827 | 0.0769410041733562 |
| 42 | 121.9 | 121.659902373911 | 0.240097626089112 |
| 43 | 122 | 123.173052949926 | -1.17305294992643 |
| 44 | 122.2 | 122.317793928700 | -0.117793928700257 |
| 45 | 123 | 123.962522815674 | -0.962522815673674 |
| 46 | 123.1 | 123.304631260884 | -0.204631260884314 |
| 47 | 124.9 | 123.830944504716 | 1.06905549528421 |
| 48 | 125.4 | 123.830944504716 | 1.56905549528421 |
| 49 | 124.7 | 123.501998727321 | 1.19800127267889 |
| 50 | 124.4 | 124.357257748547 | 0.0427422514527056 |
| 51 | 124 | 124.028311971153 | -0.0283119711526162 |
| 52 | 125 | 126.133564946479 | -1.13356494647858 |
| 53 | 125.1 | 125.738830013605 | -0.63883001360497 |
| 54 | 125.4 | 125.080938458816 | 0.319061541184407 |
| 55 | 125.7 | 126.001986635521 | -0.301986635520711 |
| 56 | 126.4 | 126.199354101958 | 0.200645898042484 |
| 57 | 125.7 | 126.528299879352 | -0.828299879352202 |
| 58 | 125.4 | 125.738830013605 | -0.338830013604959 |
| 59 | 126.4 | 125.870408324563 | 0.529591675437166 |
| 60 | 126.2 | 124.686203525942 | 1.51379647405802 |
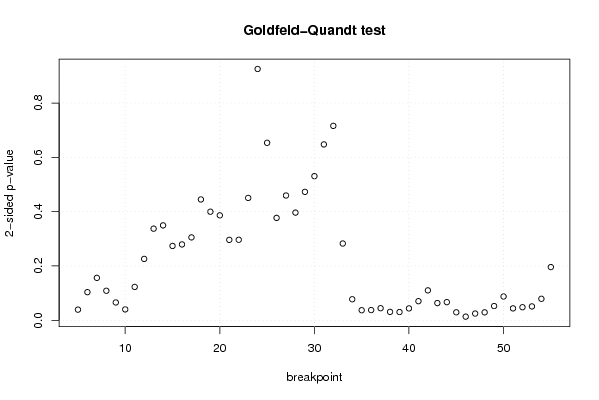
| Goldfeld-Quandt test for Heteroskedasticity | |||
| p-values | Alternative Hypothesis | ||
| breakpoint index | greater | 2-sided | less |
| 5 | 0.0195362644833442 | 0.0390725289666883 | 0.980463735516656 |
| 6 | 0.05173656159903 | 0.10347312319806 | 0.94826343840097 |
| 7 | 0.0780953902916442 | 0.156190780583288 | 0.921904609708356 |
| 8 | 0.054324934150738 | 0.108649868301476 | 0.945675065849262 |
| 9 | 0.0327926149790801 | 0.0655852299581603 | 0.96720738502092 |
| 10 | 0.0200115439912606 | 0.0400230879825211 | 0.97998845600874 |
| 11 | 0.0613836176387709 | 0.122767235277542 | 0.93861638236123 |
| 12 | 0.112983961965066 | 0.225967923930131 | 0.887016038034934 |
| 13 | 0.168687431726963 | 0.337374863453926 | 0.831312568273037 |
| 14 | 0.174746682484302 | 0.349493364968603 | 0.825253317515698 |
| 15 | 0.136875352395110 | 0.273750704790221 | 0.86312464760489 |
| 16 | 0.139693489968808 | 0.279386979937615 | 0.860306510031192 |
| 17 | 0.152642189481908 | 0.305284378963816 | 0.847357810518092 |
| 18 | 0.222506338546302 | 0.445012677092604 | 0.777493661453698 |
| 19 | 0.199930170013143 | 0.399860340026285 | 0.800069829986857 |
| 20 | 0.193266342640506 | 0.386532685281011 | 0.806733657359494 |
| 21 | 0.148097906712475 | 0.296195813424950 | 0.851902093287525 |
| 22 | 0.148247853671253 | 0.296495707342505 | 0.851752146328747 |
| 23 | 0.225318968528242 | 0.450637937056484 | 0.774681031471758 |
| 24 | 0.462878467130596 | 0.925756934261193 | 0.537121532869403 |
| 25 | 0.673169083882918 | 0.653661832234163 | 0.326830916117082 |
| 26 | 0.811458807549348 | 0.377082384901305 | 0.188541192450652 |
| 27 | 0.770216398962216 | 0.459567202075568 | 0.229783601037784 |
| 28 | 0.801745150708722 | 0.396509698582557 | 0.198254849291278 |
| 29 | 0.763521311112327 | 0.472957377775347 | 0.236478688887673 |
| 30 | 0.734611203992040 | 0.530777592015919 | 0.265388796007960 |
| 31 | 0.676132412889455 | 0.64773517422109 | 0.323867587110545 |
| 32 | 0.641963648166018 | 0.716072703667964 | 0.358036351833982 |
| 33 | 0.858644473531241 | 0.282711052937517 | 0.141355526468759 |
| 34 | 0.961322784664548 | 0.077354430670905 | 0.0386772153354525 |
| 35 | 0.981519819718279 | 0.0369603605634424 | 0.0184801802817212 |
| 36 | 0.981212658421122 | 0.0375746831577553 | 0.0187873415788776 |
| 37 | 0.977813596298548 | 0.0443728074029046 | 0.0221864037014523 |
| 38 | 0.98456818501459 | 0.0308636299708178 | 0.0154318149854089 |
| 39 | 0.98486446438786 | 0.0302710712242785 | 0.0151355356121393 |
| 40 | 0.9781150105321 | 0.043769978935799 | 0.0218849894678995 |
| 41 | 0.96488780459413 | 0.0702243908117421 | 0.0351121954058710 |
| 42 | 0.944949107704325 | 0.110101784591351 | 0.0550508922956753 |
| 43 | 0.968383956677465 | 0.0632320866450709 | 0.0316160433225355 |
| 44 | 0.96666462470963 | 0.0666707505807414 | 0.0333353752903707 |
| 45 | 0.985334014098924 | 0.0293319718021527 | 0.0146659859010764 |
| 46 | 0.993358398773344 | 0.0132832024533128 | 0.00664160122665641 |
| 47 | 0.987640449581557 | 0.0247191008368867 | 0.0123595504184434 |
| 48 | 0.98544762472759 | 0.0291047505448200 | 0.0145523752724100 |
| 49 | 0.973831279987641 | 0.0523374400247172 | 0.0261687200123586 |
| 50 | 0.956247444088852 | 0.087505111822296 | 0.043752555911148 |
| 51 | 0.978109890576902 | 0.0437802188461959 | 0.0218901094230979 |
| 52 | 0.975992846601483 | 0.0480143067970333 | 0.0240071533985167 |
| 53 | 0.974473846932908 | 0.0510523061341836 | 0.0255261530670918 |
| 54 | 0.9604692676788 | 0.0790614646424012 | 0.0395307323212006 |
| 55 | 0.902038481895843 | 0.195923036208313 | 0.0979615181041567 |
| Meta Analysis of Goldfeld-Quandt test for Heteroskedasticity | |||
| Description | # significant tests | % significant tests | OK/NOK |
| 1% type I error level | 0 | 0 | OK |
| 5% type I error level | 14 | 0.274509803921569 | NOK |
| 10% type I error level | 23 | 0.450980392156863 | NOK |