| Multiple Linear Regression - Estimated Regression Equation |
| WLMan[t] = + 2.46122394441475 + 0.525724444031325WLVrouw[t] + e[t] |
| Multiple Linear Regression - Ordinary Least Squares | |||||
| Variable | Parameter | S.D. | T-STAT H0: parameter = 0 | 2-tail p-value | 1-tail p-value |
| (Intercept) | 2.46122394441475 | 0.504968 | 4.874 | 9e-06 | 4e-06 |
| WLVrouw | 0.525724444031325 | 0.05644 | 9.3147 | 0 | 0 |
| Multiple Linear Regression - Regression Statistics | |
| Multiple R | 0.77417457022882 |
| R-squared | 0.599346265188978 |
| Adjusted R-squared | 0.592438442174995 |
| F-TEST (value) | 86.7634078023937 |
| F-TEST (DF numerator) | 1 |
| F-TEST (DF denominator) | 58 |
| p-value | 4.02788913334007e-13 |
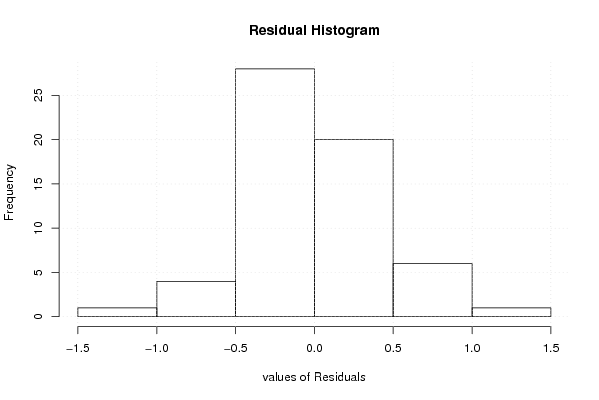
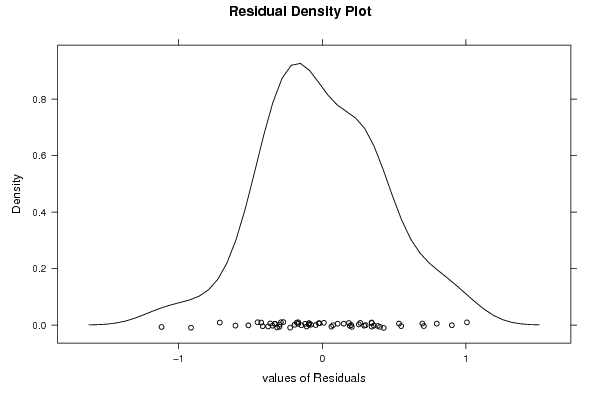
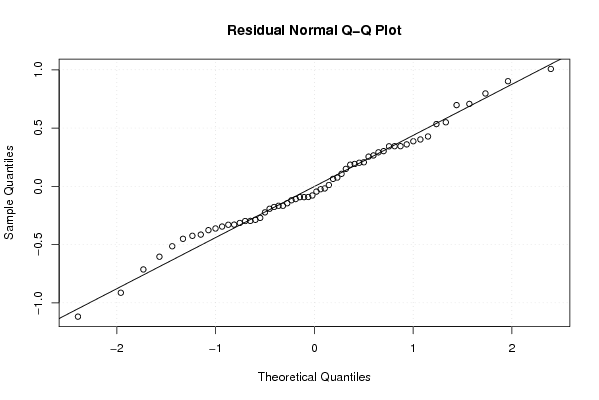
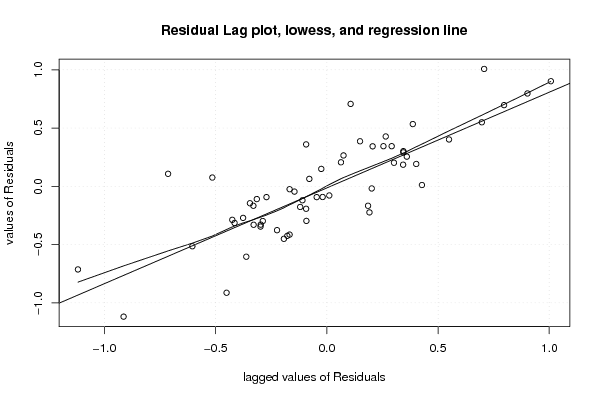
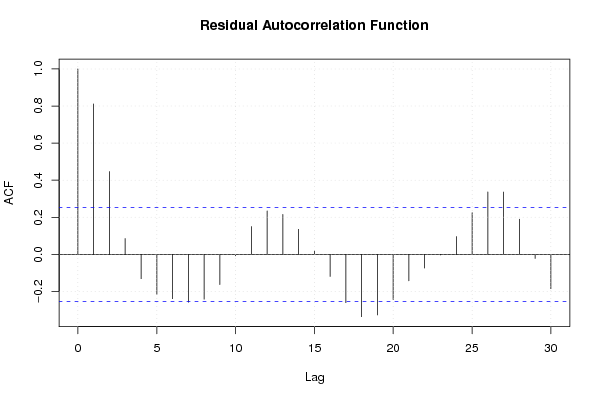
| Multiple Linear Regression - Residual Statistics | |
| Residual Standard Deviation | 0.427523556935347 |
| Sum Squared Residuals | 10.6010307206098 |
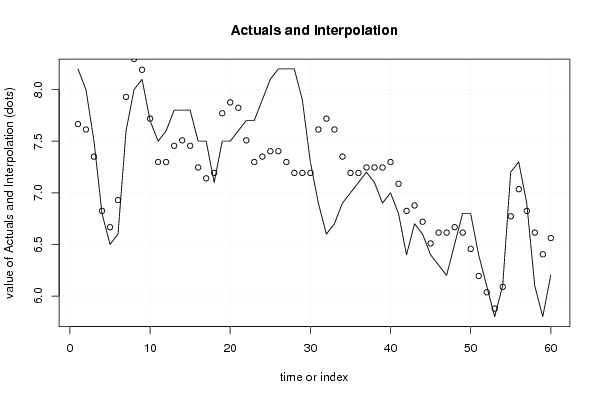
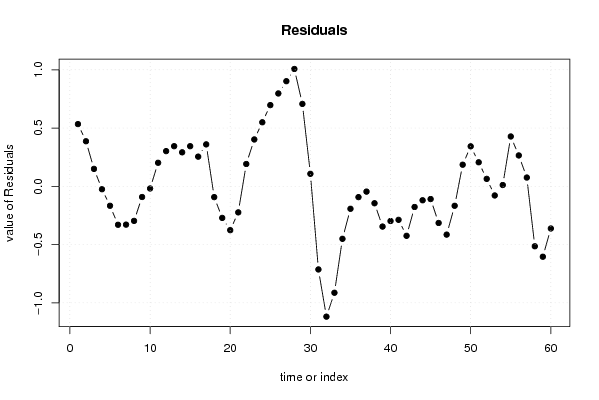
| Multiple Linear Regression - Actuals, Interpolation, and Residuals | |||
| Time or Index | Actuals | Interpolation Forecast | Residuals Prediction Error |
| 1 | 8.2 | 7.66589594032488 | 0.534104059675124 |
| 2 | 8 | 7.61332349592173 | 0.386676504078266 |
| 3 | 7.5 | 7.35046127390607 | 0.149538726093928 |
| 4 | 6.8 | 6.82473682987475 | -0.0247368298747477 |
| 5 | 6.5 | 6.66701949666535 | -0.167019496665350 |
| 6 | 6.6 | 6.92988171868101 | -0.329881718681012 |
| 7 | 7.6 | 7.92875816234053 | -0.32875816234053 |
| 8 | 8 | 8.29676527316246 | -0.296765273162456 |
| 9 | 8.1 | 8.19162038435619 | -0.091620384356192 |
| 10 | 7.7 | 7.718468384728 | -0.0184683847279990 |
| 11 | 7.5 | 7.29788882950294 | 0.202111170497061 |
| 12 | 7.6 | 7.29788882950294 | 0.302111170497061 |
| 13 | 7.8 | 7.45560616271234 | 0.344393837287663 |
| 14 | 7.8 | 7.50817860711547 | 0.291821392884531 |
| 15 | 7.8 | 7.45560616271234 | 0.344393837287663 |
| 16 | 7.5 | 7.2453163850998 | 0.254683614900193 |
| 17 | 7.5 | 7.14017149629354 | 0.359828503706458 |
| 18 | 7.1 | 7.19274394069667 | -0.0927439406966748 |
| 19 | 7.5 | 7.77104082913113 | -0.271040829131131 |
| 20 | 7.5 | 7.8761857179374 | -0.376185717937397 |
| 21 | 7.6 | 7.82361327353426 | -0.223613273534264 |
| 22 | 7.7 | 7.50817860711547 | 0.191821392884531 |
| 23 | 7.7 | 7.29788882950294 | 0.402111170497061 |
| 24 | 7.9 | 7.35046127390607 | 0.549538726093928 |
| 25 | 8.1 | 7.4030337183092 | 0.696966281690795 |
| 26 | 8.2 | 7.4030337183092 | 0.796966281690795 |
| 27 | 8.2 | 7.29788882950294 | 0.90211117049706 |
| 28 | 8.2 | 7.19274394069667 | 1.00725605930332 |
| 29 | 7.9 | 7.19274394069667 | 0.707256059303326 |
| 30 | 7.3 | 7.19274394069667 | 0.107256059303325 |
| 31 | 6.9 | 7.61332349592173 | -0.713323495921734 |
| 32 | 6.6 | 7.718468384728 | -1.118468384728 |
| 33 | 6.7 | 7.61332349592173 | -0.913323495921734 |
| 34 | 6.9 | 7.35046127390607 | -0.450461273906072 |
| 35 | 7 | 7.19274394069667 | -0.192743940696674 |
| 36 | 7.1 | 7.19274394069667 | -0.0927439406966748 |
| 37 | 7.2 | 7.2453163850998 | -0.0453163850998065 |
| 38 | 7.1 | 7.2453163850998 | -0.145316385099807 |
| 39 | 6.9 | 7.2453163850998 | -0.345316385099806 |
| 40 | 7 | 7.29788882950294 | -0.297888829502939 |
| 41 | 6.8 | 7.08759905189041 | -0.28759905189041 |
| 42 | 6.4 | 6.82473682987475 | -0.424736829874747 |
| 43 | 6.7 | 6.87730927427788 | -0.177309274277880 |
| 44 | 6.6 | 6.71959194106848 | -0.119591941068482 |
| 45 | 6.4 | 6.50930216345595 | -0.109302163455952 |
| 46 | 6.3 | 6.61444705226222 | -0.314447052262217 |
| 47 | 6.2 | 6.61444705226222 | -0.414447052262217 |
| 48 | 6.5 | 6.66701949666535 | -0.167019496665350 |
| 49 | 6.8 | 6.61444705226222 | 0.185552947737783 |
| 50 | 6.8 | 6.45672971905282 | 0.34327028094718 |
| 51 | 6.4 | 6.19386749703716 | 0.206132502962843 |
| 52 | 6.1 | 6.03615016382776 | 0.0638498361722397 |
| 53 | 5.8 | 5.87843283061836 | -0.0784328306183626 |
| 54 | 6.1 | 6.08872260823089 | 0.0112773917691069 |
| 55 | 7.2 | 6.77216438547161 | 0.427835614528386 |
| 56 | 7.3 | 7.03502660748728 | 0.264973392512723 |
| 57 | 6.9 | 6.82473682987475 | 0.0752631701252529 |
| 58 | 6.1 | 6.61444705226222 | -0.514447052262218 |
| 59 | 5.8 | 6.40415727464969 | -0.604157274649687 |
| 60 | 6.2 | 6.56187460785908 | -0.361874607859084 |
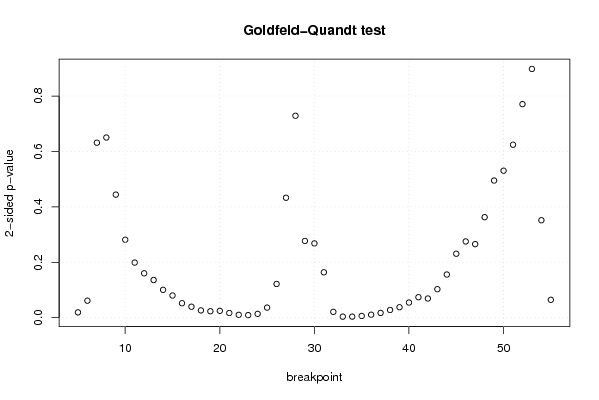
| Goldfeld-Quandt test for Heteroskedasticity | |||
| p-values | Alternative Hypothesis | ||
| breakpoint index | greater | 2-sided | less |
| 5 | 0.00964990237537807 | 0.0192998047507561 | 0.990350097624622 |
| 6 | 0.0307433421885742 | 0.0614866843771484 | 0.969256657811426 |
| 7 | 0.315793841156103 | 0.631587682312207 | 0.684206158843897 |
| 8 | 0.32515740255603 | 0.65031480511206 | 0.67484259744397 |
| 9 | 0.222110580480868 | 0.444221160961736 | 0.777889419519132 |
| 10 | 0.140750101682731 | 0.281500203365463 | 0.859249898317269 |
| 11 | 0.0995065923793272 | 0.199013184758654 | 0.900493407620673 |
| 12 | 0.0801584731108366 | 0.160316946221673 | 0.919841526889163 |
| 13 | 0.0680754022537612 | 0.136150804507522 | 0.931924597746239 |
| 14 | 0.0503453461156866 | 0.100690692231373 | 0.949654653884313 |
| 15 | 0.040080104810349 | 0.080160209620698 | 0.959919895189651 |
| 16 | 0.0261842774966516 | 0.0523685549933031 | 0.973815722503348 |
| 17 | 0.0198884608862351 | 0.0397769217724701 | 0.980111539113765 |
| 18 | 0.0132493090699937 | 0.0264986181399874 | 0.986750690930006 |
| 19 | 0.0117055716685091 | 0.0234111433370181 | 0.98829442833149 |
| 20 | 0.0124650499343162 | 0.0249300998686323 | 0.987534950065684 |
| 21 | 0.00853084403578716 | 0.0170616880715743 | 0.991469155964213 |
| 22 | 0.00520551454220788 | 0.0104110290844158 | 0.994794485457792 |
| 23 | 0.00467322355544211 | 0.00934644711088421 | 0.995326776444558 |
| 24 | 0.00697750646758477 | 0.0139550129351695 | 0.993022493532415 |
| 25 | 0.0182677269659801 | 0.0365354539319602 | 0.98173227303402 |
| 26 | 0.0609417043499772 | 0.121883408699954 | 0.939058295650023 |
| 27 | 0.216471047774197 | 0.432942095548395 | 0.783528952225803 |
| 28 | 0.635637128067663 | 0.728725743864674 | 0.364362871932337 |
| 29 | 0.861483903328567 | 0.277032193342866 | 0.138516096671433 |
| 30 | 0.865893135311293 | 0.268213729377414 | 0.134106864688707 |
| 31 | 0.918047101108863 | 0.163905797782274 | 0.0819528988911368 |
| 32 | 0.989385897761957 | 0.0212282044760851 | 0.0106141022380426 |
| 33 | 0.998046607612098 | 0.00390678477580403 | 0.00195339238790202 |
| 34 | 0.9980060801854 | 0.00398783962919993 | 0.00199391981459996 |
| 35 | 0.996759606717903 | 0.00648078656419377 | 0.00324039328209688 |
| 36 | 0.994569600939701 | 0.0108607981205974 | 0.00543039906029869 |
| 37 | 0.99131337241727 | 0.0173732551654605 | 0.00868662758273023 |
| 38 | 0.985996396063856 | 0.0280072078722878 | 0.0140036039361439 |
| 39 | 0.981013141098412 | 0.037973717803176 | 0.018986858901588 |
| 40 | 0.97258370556829 | 0.0548325888634185 | 0.0274162944317093 |
| 41 | 0.962961390135332 | 0.074077219729336 | 0.037038609864668 |
| 42 | 0.96528778725341 | 0.0694244254931814 | 0.0347122127465907 |
| 43 | 0.94851880897509 | 0.102962382049822 | 0.051481191024911 |
| 44 | 0.922052090418058 | 0.155895819163884 | 0.077947909581942 |
| 45 | 0.884530721851471 | 0.230938556297059 | 0.115469278148529 |
| 46 | 0.862395795438017 | 0.275208409123966 | 0.137604204561983 |
| 47 | 0.867195976743752 | 0.265608046512496 | 0.132804023256248 |
| 48 | 0.818589221679042 | 0.362821556641916 | 0.181410778320958 |
| 49 | 0.752482649704617 | 0.495034700590766 | 0.247517350295383 |
| 50 | 0.734719015935051 | 0.530561968129898 | 0.265280984064949 |
| 51 | 0.687863340897028 | 0.624273318205944 | 0.312136659102972 |
| 52 | 0.614655926564877 | 0.770688146870245 | 0.385344073435123 |
| 53 | 0.551146585732088 | 0.897706828535824 | 0.448853414267912 |
| 54 | 0.824095727355511 | 0.351808545288977 | 0.175904272644489 |
| 55 | 0.967679829668918 | 0.0646403406621636 | 0.0323201703310818 |
| Meta Analysis of Goldfeld-Quandt test for Heteroskedasticity | |||
| Description | # significant tests | % significant tests | OK/NOK |
| 1% type I error level | 4 | 0.0784313725490196 | NOK |
| 5% type I error level | 18 | 0.352941176470588 | NOK |
| 10% type I error level | 25 | 0.490196078431373 | NOK |