| Multiple Linear Regression - Estimated Regression Equation |
| Y[t] = -28.8691767006593 + 0.722631087194356X[t] + 0.68166492131029Y1[t] + 0.0357487587076676Y2[t] -0.136738073603211Y3[t] -0.0259058241864742Y4[t] -4.2607956589844M1[t] -2.90302129402693M2[t] -6.12901499458149M3[t] -3.79239104204496M4[t] -4.25182903906736M5[t] -13.9408302154570M6[t] -11.8293883425912M7[t] -0.0234283729133178M8[t] -2.79353232120853M9[t] -2.46252649385462M10[t] + 5.15904113856754M11[t] -0.3517093324785t + e[t] |
| Multiple Linear Regression - Ordinary Least Squares | |||||
| Variable | Parameter | S.D. | T-STAT H0: parameter = 0 | 2-tail p-value | 1-tail p-value |
| (Intercept) | -28.8691767006593 | 11.622676 | -2.4839 | 0.017522 | 0.008761 |
| X | 0.722631087194356 | 0.141729 | 5.0987 | 1e-05 | 5e-06 |
| Y1 | 0.68166492131029 | 0.161933 | 4.2095 | 0.000151 | 7.5e-05 |
| Y2 | 0.0357487587076676 | 0.198751 | 0.1799 | 0.858212 | 0.429106 |
| Y3 | -0.136738073603211 | 0.201583 | -0.6783 | 0.501679 | 0.250839 |
| Y4 | -0.0259058241864742 | 0.132452 | -0.1956 | 0.845976 | 0.422988 |
| M1 | -4.2607956589844 | 6.930106 | -0.6148 | 0.542335 | 0.271168 |
| M2 | -2.90302129402693 | 7.122116 | -0.4076 | 0.68585 | 0.342925 |
| M3 | -6.12901499458149 | 7.187253 | -0.8528 | 0.399135 | 0.199567 |
| M4 | -3.79239104204496 | 7.243078 | -0.5236 | 0.603605 | 0.301803 |
| M5 | -4.25182903906736 | 7.064731 | -0.6018 | 0.550856 | 0.275428 |
| M6 | -13.9408302154570 | 6.960589 | -2.0028 | 0.052368 | 0.026184 |
| M7 | -11.8293883425912 | 7.515352 | -1.574 | 0.123771 | 0.061885 |
| M8 | -0.0234283729133178 | 7.466075 | -0.0031 | 0.997513 | 0.498756 |
| M9 | -2.79353232120853 | 7.628985 | -0.3662 | 0.716266 | 0.358133 |
| M10 | -2.46252649385462 | 7.717026 | -0.3191 | 0.751396 | 0.375698 |
| M11 | 5.15904113856754 | 7.651288 | 0.6743 | 0.504221 | 0.25211 |
| t | -0.3517093324785 | 0.176384 | -1.994 | 0.053365 | 0.026682 |
| Multiple Linear Regression - Regression Statistics | |
| Multiple R | 0.990946497626736 |
| R-squared | 0.981974961158695 |
| Adjusted R-squared | 0.973911127992848 |
| F-TEST (value) | 121.775208013687 |
| F-TEST (DF numerator) | 17 |
| F-TEST (DF denominator) | 38 |
| p-value | 0 |
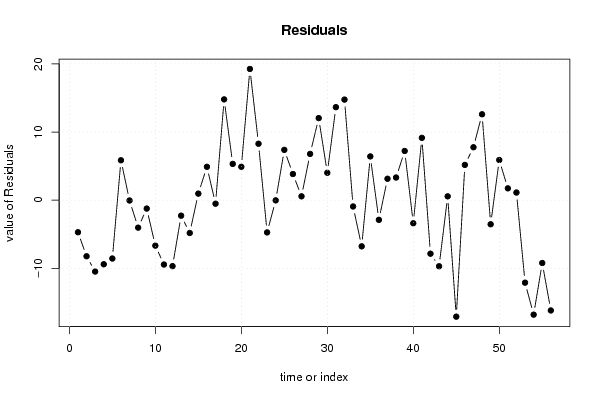
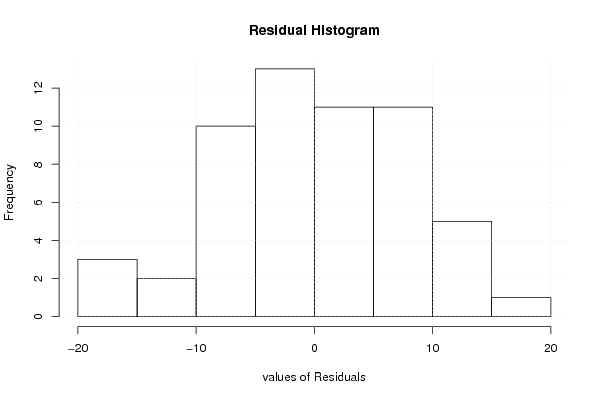
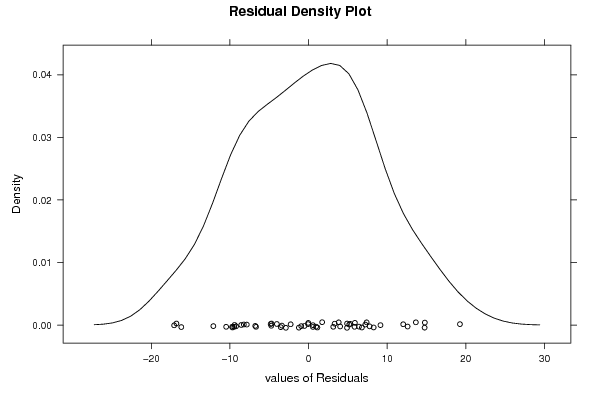
| Multiple Linear Regression - Residual Statistics | |
| Residual Standard Deviation | 10.1208126903771 |
| Sum Squared Residuals | 3892.3722815205 |
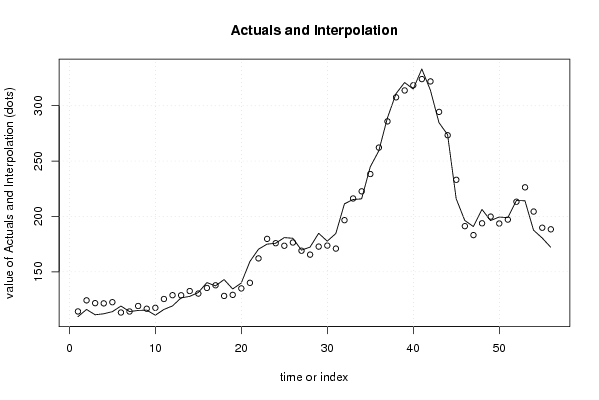
| Multiple Linear Regression - Actuals, Interpolation, and Residuals | |||
| Time or Index | Actuals | Interpolation Forecast | Residuals Prediction Error |
| 1 | 109.5 | 114.208021387977 | -4.70802138797678 |
| 2 | 116 | 124.231763407891 | -8.23176340789096 |
| 3 | 111.2 | 121.675701642503 | -10.4757016425032 |
| 4 | 112.1 | 121.506282953435 | -9.40628295343544 |
| 5 | 114 | 122.560662011918 | -8.56066201191806 |
| 6 | 119.1 | 113.251297001668 | 5.84870299833185 |
| 7 | 114.1 | 114.148677340249 | -0.0486773402491406 |
| 8 | 115.1 | 119.131017001195 | -4.03101700119537 |
| 9 | 115.4 | 116.632696911496 | -1.23269691149615 |
| 10 | 110.8 | 117.476075414857 | -6.67607541485681 |
| 11 | 116 | 125.443735513845 | -9.44373551384466 |
| 12 | 119.2 | 128.882793577405 | -9.68279357740541 |
| 13 | 126.5 | 128.776258553842 | -2.27625855384229 |
| 14 | 127.8 | 132.618950847725 | -4.81895084772499 |
| 15 | 131.3 | 130.338737116856 | 0.961262883144313 |
| 16 | 140.3 | 135.409180382386 | 4.89081961761399 |
| 17 | 137.3 | 137.81753096529 | -0.517530965289984 |
| 18 | 143 | 128.215038714425 | 14.7849612855745 |
| 19 | 134.5 | 129.179862090702 | 5.32013790929774 |
| 20 | 139.9 | 135.004001298371 | 4.89599870162908 |
| 21 | 159.3 | 140.049620859356 | 19.2503791406442 |
| 22 | 170.4 | 162.120760076697 | 8.27923992330312 |
| 23 | 175 | 179.733910744141 | -4.73391074414088 |
| 24 | 175.8 | 175.830177358901 | -0.0301773589012391 |
| 25 | 180.9 | 173.520238424300 | 7.37976157569961 |
| 26 | 180.3 | 176.464475796908 | 3.83552420309158 |
| 27 | 169.6 | 169.035169120544 | 0.564830879455514 |
| 28 | 172.3 | 165.515939797812 | 6.78406020218753 |
| 29 | 184.8 | 172.760905180676 | 12.0390948193237 |
| 30 | 177.7 | 173.683326023397 | 4.01667397660301 |
| 31 | 184.6 | 170.958096626394 | 13.6419033736063 |
| 32 | 211.4 | 196.644944783576 | 14.7550552164243 |
| 33 | 215.3 | 216.226327676505 | -0.926327676504908 |
| 34 | 215.9 | 222.675778177690 | -6.77577817768954 |
| 35 | 244.7 | 238.285085533756 | 6.4149144662443 |
| 36 | 259.3 | 262.184172001775 | -2.88417200177477 |
| 37 | 289 | 285.858135863837 | 3.14186413616275 |
| 38 | 310.9 | 307.580188792929 | 3.31981120707104 |
| 39 | 321 | 313.781592840499 | 7.21840715950129 |
| 40 | 315.1 | 318.489033401315 | -3.38903340131464 |
| 41 | 333.2 | 324.055412474194 | 9.14458752580584 |
| 42 | 314.1 | 321.953370901288 | -7.85337090128819 |
| 43 | 284.7 | 294.39778947713 | -9.69778947712996 |
| 44 | 273.9 | 273.339708124726 | 0.560291875273653 |
| 45 | 216 | 233.091354552643 | -17.0913545526431 |
| 46 | 196.4 | 191.227386330757 | 5.17261366924323 |
| 47 | 190.9 | 183.137268208259 | 7.76273179174125 |
| 48 | 206.4 | 193.802857061919 | 12.5971429380814 |
| 49 | 196.3 | 199.837345770043 | -3.53734577004328 |
| 50 | 199.5 | 193.604621154547 | 5.89537884545333 |
| 51 | 198.9 | 197.168799279598 | 1.73120072040208 |
| 52 | 214.4 | 213.279563465051 | 1.12043653494857 |
| 53 | 214.2 | 226.305489367921 | -12.1054893679215 |
| 54 | 187.6 | 204.396967359221 | -16.7969673592212 |
| 55 | 180.6 | 189.815574465525 | -9.21557446552495 |
| 56 | 172.2 | 188.380328792132 | -16.1803287921317 |
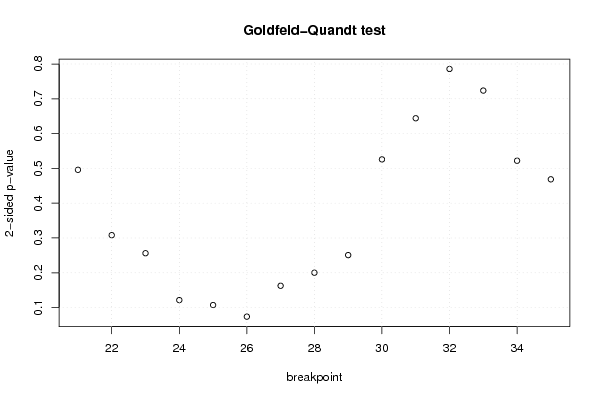
| Goldfeld-Quandt test for Heteroskedasticity | |||
| p-values | Alternative Hypothesis | ||
| breakpoint index | greater | 2-sided | less |
| 21 | 0.247942564743233 | 0.495885129486466 | 0.752057435256767 |
| 22 | 0.154035439609145 | 0.308070879218290 | 0.845964560390855 |
| 23 | 0.128076090521194 | 0.256152181042387 | 0.871923909478806 |
| 24 | 0.0607124989087606 | 0.121424997817521 | 0.93928750109124 |
| 25 | 0.0536044603532564 | 0.107208920706513 | 0.946395539646744 |
| 26 | 0.0369283376177803 | 0.0738566752355605 | 0.96307166238222 |
| 27 | 0.0813211139393945 | 0.162642227878789 | 0.918678886060605 |
| 28 | 0.100083360059658 | 0.200166720119316 | 0.899916639940342 |
| 29 | 0.125349907437759 | 0.250699814875518 | 0.874650092562241 |
| 30 | 0.737100226378976 | 0.525799547242048 | 0.262899773621024 |
| 31 | 0.677962727552354 | 0.644074544895292 | 0.322037272447646 |
| 32 | 0.607099831481262 | 0.785800337037475 | 0.392900168518738 |
| 33 | 0.638170225038837 | 0.723659549922326 | 0.361829774961163 |
| 34 | 0.738999189889592 | 0.522001620220816 | 0.261000810110408 |
| 35 | 0.765695037312388 | 0.468609925375225 | 0.234304962687612 |
| Meta Analysis of Goldfeld-Quandt test for Heteroskedasticity | |||
| Description | # significant tests | % significant tests | OK/NOK |
| 1% type I error level | 0 | 0 | OK |
| 5% type I error level | 0 | 0 | OK |
| 10% type I error level | 1 | 0.0666666666666667 | OK |