| Multiple Linear Regression - Estimated Regression Equation |
| IndGez[t] = + 3.888 + 0.445333333333333InvlMex[t] + e[t] |
| Multiple Linear Regression - Ordinary Least Squares | |||||
| Variable | Parameter | S.D. | T-STAT H0: parameter = 0 | 2-tail p-value | 1-tail p-value |
| (Intercept) | 3.888 | 0.152006 | 25.5779 | 0 | 0 |
| InvlMex | 0.445333333333333 | 0.464388 | 0.959 | 0.341848 | 0.170924 |
| Multiple Linear Regression - Regression Statistics | |
| Multiple R | 0.129401971531008 |
| R-squared | 0.0167448702361117 |
| Adjusted R-squared | -0.00146355809284926 |
| F-TEST (value) | 0.919621942849324 |
| F-TEST (DF numerator) | 1 |
| F-TEST (DF denominator) | 54 |
| p-value | 0.341848401095354 |
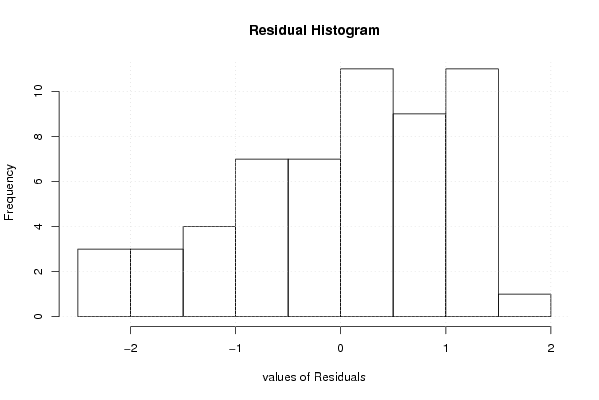
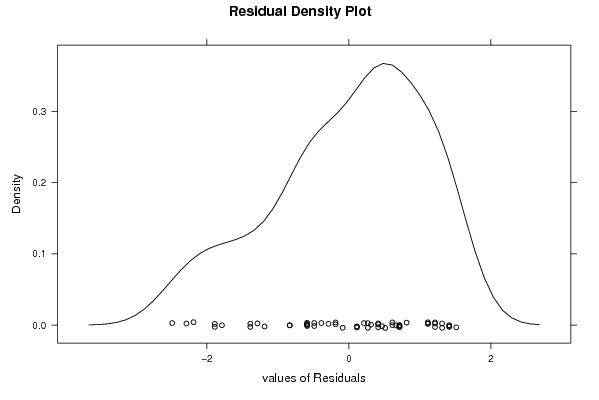
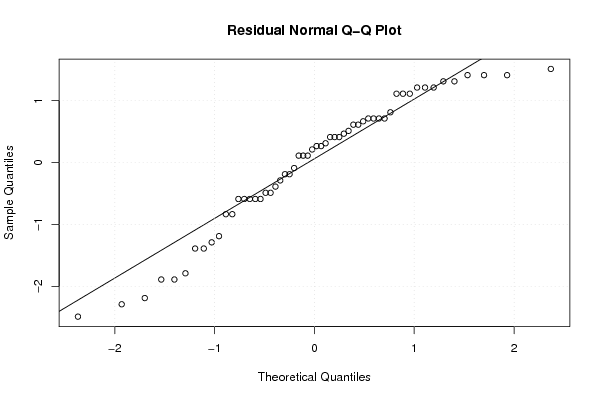
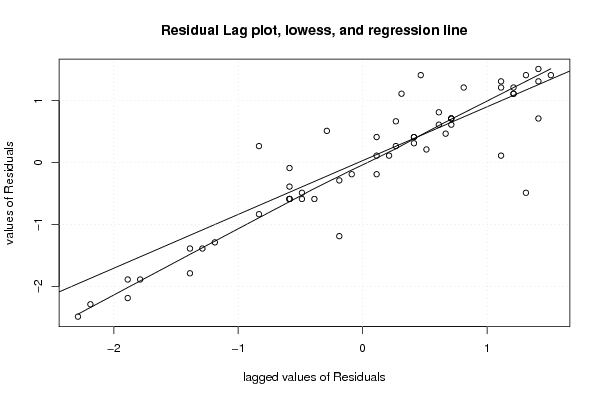
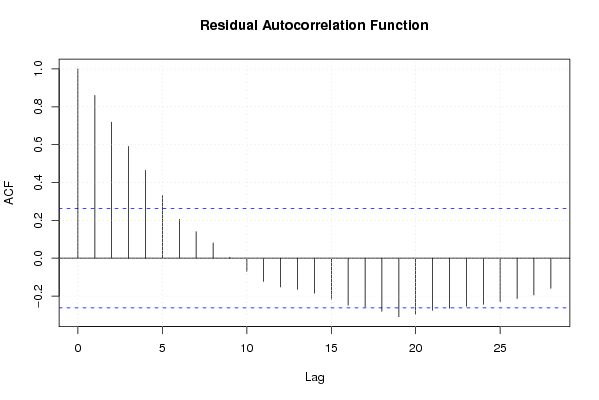
| Multiple Linear Regression - Residual Statistics | |
| Residual Standard Deviation | 1.07484825228127 |
| Sum Squared Residuals | 62.3861333333334 |
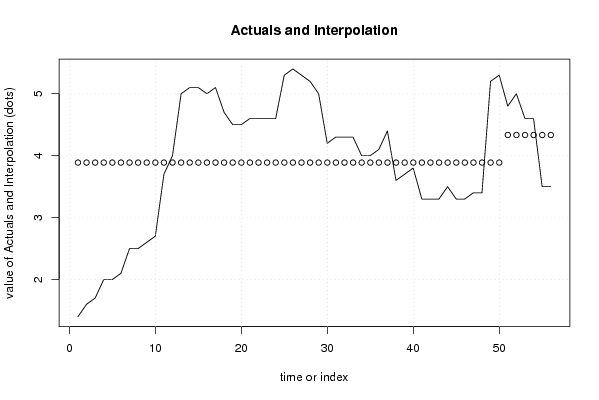
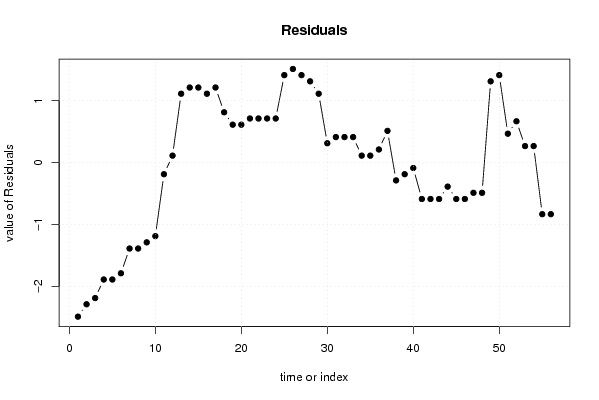
| Multiple Linear Regression - Actuals, Interpolation, and Residuals | |||
| Time or Index | Actuals | Interpolation Forecast | Residuals Prediction Error |
| 1 | 1.4 | 3.88800000000001 | -2.48800000000001 |
| 2 | 1.6 | 3.888 | -2.288 |
| 3 | 1.7 | 3.888 | -2.188 |
| 4 | 2 | 3.888 | -1.888 |
| 5 | 2 | 3.888 | -1.888 |
| 6 | 2.1 | 3.888 | -1.788 |
| 7 | 2.5 | 3.888 | -1.388 |
| 8 | 2.5 | 3.888 | -1.388 |
| 9 | 2.6 | 3.888 | -1.288 |
| 10 | 2.7 | 3.888 | -1.188 |
| 11 | 3.7 | 3.888 | -0.188000000000000 |
| 12 | 4 | 3.888 | 0.112000000000000 |
| 13 | 5 | 3.888 | 1.112 |
| 14 | 5.1 | 3.888 | 1.212 |
| 15 | 5.1 | 3.888 | 1.212 |
| 16 | 5 | 3.888 | 1.112 |
| 17 | 5.1 | 3.888 | 1.212 |
| 18 | 4.7 | 3.888 | 0.812 |
| 19 | 4.5 | 3.888 | 0.612 |
| 20 | 4.5 | 3.888 | 0.612 |
| 21 | 4.6 | 3.888 | 0.712 |
| 22 | 4.6 | 3.888 | 0.712 |
| 23 | 4.6 | 3.888 | 0.712 |
| 24 | 4.6 | 3.888 | 0.712 |
| 25 | 5.3 | 3.888 | 1.412 |
| 26 | 5.4 | 3.888 | 1.512 |
| 27 | 5.3 | 3.888 | 1.412 |
| 28 | 5.2 | 3.888 | 1.312 |
| 29 | 5 | 3.888 | 1.112 |
| 30 | 4.2 | 3.888 | 0.312000000000000 |
| 31 | 4.3 | 3.888 | 0.412 |
| 32 | 4.3 | 3.888 | 0.412 |
| 33 | 4.3 | 3.888 | 0.412 |
| 34 | 4 | 3.888 | 0.112000000000000 |
| 35 | 4 | 3.888 | 0.112000000000000 |
| 36 | 4.1 | 3.888 | 0.212000000000000 |
| 37 | 4.4 | 3.888 | 0.512 |
| 38 | 3.6 | 3.888 | -0.288 |
| 39 | 3.7 | 3.888 | -0.188000000000000 |
| 40 | 3.8 | 3.888 | -0.088 |
| 41 | 3.3 | 3.888 | -0.588 |
| 42 | 3.3 | 3.888 | -0.588 |
| 43 | 3.3 | 3.888 | -0.588 |
| 44 | 3.5 | 3.888 | -0.388 |
| 45 | 3.3 | 3.888 | -0.588 |
| 46 | 3.3 | 3.888 | -0.588 |
| 47 | 3.4 | 3.888 | -0.488 |
| 48 | 3.4 | 3.888 | -0.488 |
| 49 | 5.2 | 3.888 | 1.312 |
| 50 | 5.3 | 3.888 | 1.412 |
| 51 | 4.8 | 4.33333333333333 | 0.466666666666667 |
| 52 | 5 | 4.33333333333333 | 0.666666666666667 |
| 53 | 4.6 | 4.33333333333333 | 0.266666666666666 |
| 54 | 4.6 | 4.33333333333333 | 0.266666666666666 |
| 55 | 3.5 | 4.33333333333333 | -0.833333333333333 |
| 56 | 3.5 | 4.33333333333333 | -0.833333333333333 |
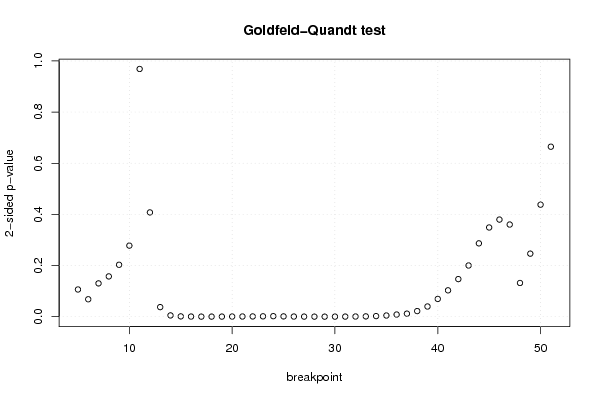
| Goldfeld-Quandt test for Heteroskedasticity | |||
| p-values | Alternative Hypothesis | ||
| breakpoint index | greater | 2-sided | less |
| 5 | 0.0531614825683917 | 0.106322965136783 | 0.946838517431608 |
| 6 | 0.0340179229386192 | 0.0680358458772383 | 0.96598207706138 |
| 7 | 0.065145749164675 | 0.13029149832935 | 0.934854250835325 |
| 8 | 0.0787321990381323 | 0.157464398076265 | 0.921267800961868 |
| 9 | 0.101464159399684 | 0.202928318799369 | 0.898535840600316 |
| 10 | 0.138929554728951 | 0.277859109457902 | 0.861070445271049 |
| 11 | 0.515614509030399 | 0.968770981939202 | 0.484385490969601 |
| 12 | 0.796116551304522 | 0.407766897390956 | 0.203883448695478 |
| 13 | 0.981304427295635 | 0.0373911454087293 | 0.0186955727043646 |
| 14 | 0.997523649318341 | 0.00495270136331689 | 0.00247635068165845 |
| 15 | 0.999433913792708 | 0.00113217241458469 | 0.000566086207292343 |
| 16 | 0.999763728716736 | 0.000472542566527683 | 0.000236271283263841 |
| 17 | 0.999896028322868 | 0.000207943354264450 | 0.000103971677132225 |
| 18 | 0.99989051997234 | 0.000218960055320541 | 0.000109480027660271 |
| 19 | 0.999843420066473 | 0.000313159867053388 | 0.000156579933526694 |
| 20 | 0.999767504842402 | 0.000464990315196521 | 0.000232495157598261 |
| 21 | 0.999675799540066 | 0.000648400919868067 | 0.000324200459934034 |
| 22 | 0.999536224041603 | 0.000927551916793296 | 0.000463775958396648 |
| 23 | 0.999325710314888 | 0.00134857937022339 | 0.000674289685111693 |
| 24 | 0.999010943473412 | 0.00197811305317674 | 0.000989056526588368 |
| 25 | 0.999425966194234 | 0.00114806761153131 | 0.000574033805765657 |
| 26 | 0.999748231633685 | 0.000503536732629599 | 0.000251768366314800 |
| 27 | 0.999880992088473 | 0.000238015823054826 | 0.000119007911527413 |
| 28 | 0.999940593219228 | 0.00011881356154399 | 5.9406780771995e-05 |
| 29 | 0.999959991543742 | 8.00169125161963e-05 | 4.00084562580981e-05 |
| 30 | 0.99991401917257 | 0.000171961654860196 | 8.59808274300981e-05 |
| 31 | 0.999834862923994 | 0.000330274152012833 | 0.000165137076006416 |
| 32 | 0.999693869276004 | 0.00061226144799282 | 0.00030613072399641 |
| 33 | 0.999453044865891 | 0.00109391026821726 | 0.000546955134108631 |
| 34 | 0.99886639640023 | 0.00226720719953896 | 0.00113360359976948 |
| 35 | 0.997736950485337 | 0.00452609902932693 | 0.00226304951466347 |
| 36 | 0.995823587544636 | 0.00835282491072746 | 0.00417641245536373 |
| 37 | 0.99408914287491 | 0.0118217142501795 | 0.00591085712508976 |
| 38 | 0.989036179787007 | 0.0219276404259859 | 0.0109638202129930 |
| 39 | 0.98010838019563 | 0.0397832396087414 | 0.0198916198043707 |
| 40 | 0.96527542880099 | 0.0694491423980222 | 0.0347245711990111 |
| 41 | 0.948471931685561 | 0.103056136628877 | 0.0515280683144387 |
| 42 | 0.926524849347066 | 0.146950301305868 | 0.0734751506529342 |
| 43 | 0.899902494308544 | 0.200195011382913 | 0.100097505691456 |
| 44 | 0.856651700314054 | 0.286696599371891 | 0.143348299685946 |
| 45 | 0.825607787721135 | 0.348784424557730 | 0.174392212278865 |
| 46 | 0.81012690481337 | 0.37974619037326 | 0.18987309518663 |
| 47 | 0.819851019309718 | 0.360297961380564 | 0.180148980690282 |
| 48 | 0.93410214279811 | 0.131795714403781 | 0.0658978572018906 |
| 49 | 0.876772837529341 | 0.246454324941318 | 0.123227162470659 |
| 50 | 0.78102313247377 | 0.437953735052459 | 0.218976867526230 |
| 51 | 0.667658528021919 | 0.664682943956163 | 0.332341471978081 |
| Meta Analysis of Goldfeld-Quandt test for Heteroskedasticity | |||
| Description | # significant tests | % significant tests | OK/NOK |
| 1% type I error level | 23 | 0.489361702127660 | NOK |
| 5% type I error level | 27 | 0.574468085106383 | NOK |
| 10% type I error level | 29 | 0.617021276595745 | NOK |