| Multiple Linear Regression - Estimated Regression Equation |
| Y[t] = + 18131.4750853242 -1137.48634812287X[t] + 1926.67861205915M1[t] + 4104.92480091012M2[t] + 10.6825938566490M3[t] -6454.95961319682M4[t] + 11882.1981797497M5[t] + 9078.55597269624M6[t] + 12314.1137656428M7[t] + 9650.76882821388M8[t] + 6234.12662116041M9[t] + 7332.68441410694M10[t] + 1260.64220705347M11[t] + 6.2422070534699t + e[t] |
| Multiple Linear Regression - Ordinary Least Squares | |||||
| Variable | Parameter | S.D. | T-STAT H0: parameter = 0 | 2-tail p-value | 1-tail p-value |
| (Intercept) | 18131.4750853242 | 1075.08701 | 16.8651 | 0 | 0 |
| X | -1137.48634812287 | 924.549304 | -1.2303 | 0.224702 | 0.112351 |
| M1 | 1926.67861205915 | 1202.869203 | 1.6017 | 0.115915 | 0.057957 |
| M2 | 4104.92480091012 | 1262.093215 | 3.2525 | 0.002121 | 0.00106 |
| M3 | 10.6825938566490 | 1260.584786 | 0.0085 | 0.993274 | 0.496637 |
| M4 | -6454.95961319682 | 1259.523129 | -5.1249 | 6e-06 | 3e-06 |
| M5 | 11882.1981797497 | 1258.909374 | 9.4385 | 0 | 0 |
| M6 | 9078.55597269624 | 1258.744176 | 7.2124 | 0 | 0 |
| M7 | 12314.1137656428 | 1259.027711 | 9.7807 | 0 | 0 |
| M8 | 9650.76882821388 | 1257.184821 | 7.6765 | 0 | 0 |
| M9 | 6234.12662116041 | 1255.61117 | 4.965 | 9e-06 | 5e-06 |
| M10 | 7332.68441410694 | 1254.485925 | 5.8452 | 0 | 0 |
| M11 | 1260.64220705347 | 1253.810293 | 1.0054 | 0.319829 | 0.159915 |
| t | 6.2422070534699 | 23.767516 | 0.2626 | 0.793979 | 0.396989 |
| Multiple Linear Regression - Regression Statistics | |
| Multiple R | 0.951798518642867 |
| R-squared | 0.905920420090756 |
| Adjusted R-squared | 0.879898408626498 |
| F-TEST (value) | 34.8136200514336 |
| F-TEST (DF numerator) | 13 |
| F-TEST (DF denominator) | 47 |
| p-value | 0 |
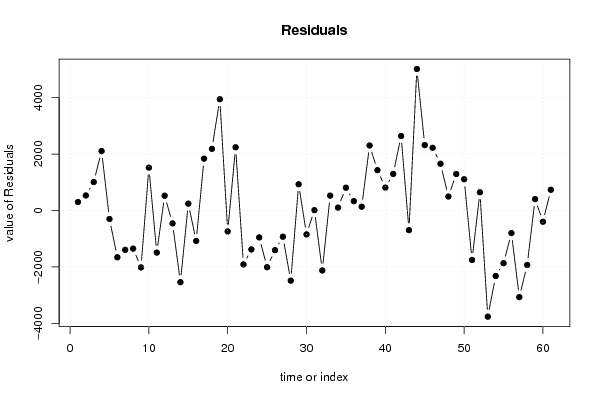
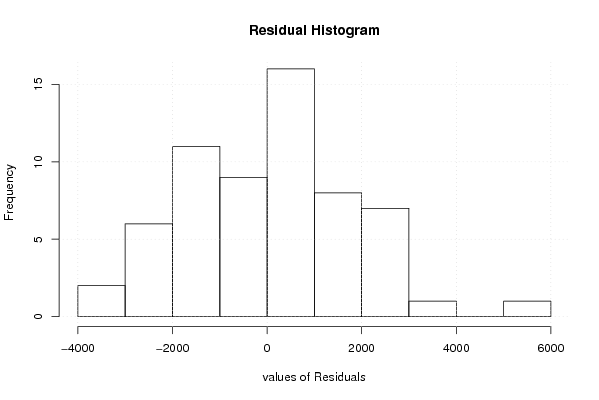
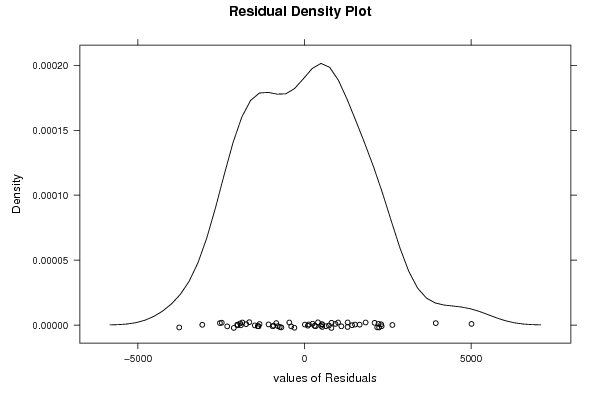
| Multiple Linear Regression - Residual Statistics | |
| Residual Standard Deviation | 1982.09192304184 |
| Sum Squared Residuals | 184648354.395222 |
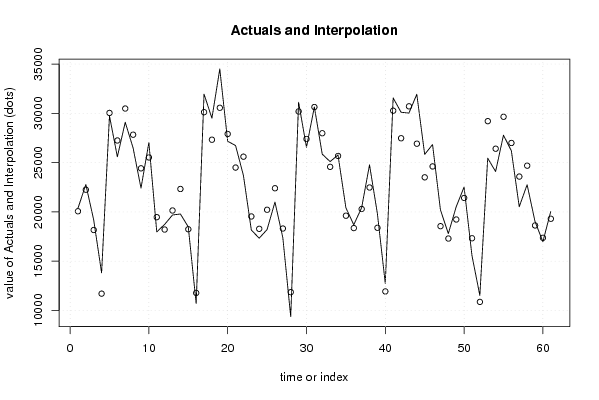
| Multiple Linear Regression - Actuals, Interpolation, and Residuals | |||
| Time or Index | Actuals | Interpolation Forecast | Residuals Prediction Error |
| 1 | 20366 | 20064.3959044369 | 301.604095563121 |
| 2 | 22782 | 22248.8843003413 | 533.115699658699 |
| 3 | 19169 | 18160.8843003413 | 1008.1156996587 |
| 4 | 13807 | 11701.4843003413 | 2105.51569965871 |
| 5 | 29743 | 30044.8843003413 | -301.884300341295 |
| 6 | 25591 | 27247.4843003413 | -1656.48430034130 |
| 7 | 29096 | 30489.2843003413 | -1393.28430034130 |
| 8 | 26482 | 27832.1815699659 | -1350.18156996586 |
| 9 | 22405 | 24421.7815699659 | -2016.78156996586 |
| 10 | 27044 | 25526.5815699659 | 1517.41843003412 |
| 11 | 17970 | 19460.7815699659 | -1490.78156996587 |
| 12 | 18730 | 18206.3815699659 | 523.61843003413 |
| 13 | 19684 | 20139.3023890785 | -455.302389078494 |
| 14 | 19785 | 22323.7907849829 | -2538.79078498293 |
| 15 | 18479 | 18235.7907849829 | 243.209215017066 |
| 16 | 10698 | 11776.3907849829 | -1078.39078498294 |
| 17 | 31956 | 30119.7907849829 | 1836.20921501707 |
| 18 | 29506 | 27322.3907849829 | 2183.60921501707 |
| 19 | 34506 | 30564.1907849829 | 3941.80921501707 |
| 20 | 27165 | 27907.0880546075 | -742.088054607511 |
| 21 | 26736 | 24496.6880546075 | 2239.31194539249 |
| 22 | 23691 | 25601.4880546075 | -1910.48805460751 |
| 23 | 18157 | 19535.6880546075 | -1378.68805460751 |
| 24 | 17328 | 18281.2880546075 | -953.288054607507 |
| 25 | 18205 | 20214.2088737201 | -2009.20887372013 |
| 26 | 20995 | 22398.6972696246 | -1403.69726962457 |
| 27 | 17382 | 18310.6972696246 | -928.697269624572 |
| 28 | 9367 | 11851.2972696246 | -2484.29726962457 |
| 29 | 31124 | 30194.6972696246 | 929.302730375427 |
| 30 | 26551 | 27397.2972696246 | -846.297269624574 |
| 31 | 30651 | 30639.0972696246 | 11.9027303754272 |
| 32 | 25859 | 27981.9945392491 | -2122.99453924915 |
| 33 | 25100 | 24571.5945392491 | 528.405460750851 |
| 34 | 25778 | 25676.3945392491 | 101.605460750853 |
| 35 | 20418 | 19610.5945392491 | 807.405460750851 |
| 36 | 18688 | 18356.1945392491 | 331.805460750854 |
| 37 | 20424 | 20289.1153583618 | 134.884641638228 |
| 38 | 24776 | 22473.6037542662 | 2302.39624573379 |
| 39 | 19814 | 18385.6037542662 | 1428.39624573379 |
| 40 | 12738 | 11926.2037542662 | 811.796245733788 |
| 41 | 31566 | 30269.6037542662 | 1296.39624573379 |
| 42 | 30111 | 27472.2037542662 | 2638.79624573379 |
| 43 | 30019 | 30714.0037542662 | -695.003754266211 |
| 44 | 31934 | 26919.4146757679 | 5014.58532423208 |
| 45 | 25826 | 23509.0146757679 | 2316.98532423208 |
| 46 | 26835 | 24613.8146757679 | 2221.18532423208 |
| 47 | 20205 | 18548.0146757679 | 1656.98532423208 |
| 48 | 17789 | 17293.6146757679 | 495.385324232083 |
| 49 | 20520 | 19226.5354948805 | 1293.46450511946 |
| 50 | 22518 | 21411.023890785 | 1106.97610921502 |
| 51 | 15572 | 17323.0238907850 | -1751.02389078498 |
| 52 | 11509 | 10863.6238907850 | 645.376109215016 |
| 53 | 25447 | 29207.023890785 | -3760.02389078498 |
| 54 | 24090 | 26409.623890785 | -2319.62389078498 |
| 55 | 27786 | 29651.423890785 | -1865.42389078498 |
| 56 | 26195 | 26994.3211604096 | -799.32116040956 |
| 57 | 20516 | 23583.9211604096 | -3067.92116040956 |
| 58 | 22759 | 24688.7211604096 | -1929.72116040955 |
| 59 | 19028 | 18622.9211604096 | 405.078839590442 |
| 60 | 16971 | 17368.5211604096 | -397.521160409556 |
| 61 | 20036 | 19301.4419795222 | 734.558020477818 |
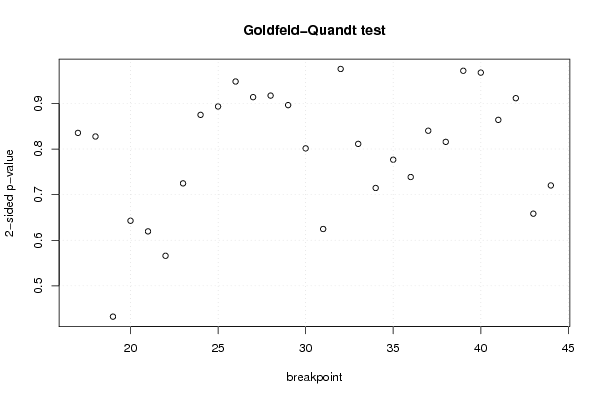
| Goldfeld-Quandt test for Heteroskedasticity | |||
| p-values | Alternative Hypothesis | ||
| breakpoint index | greater | 2-sided | less |
| 17 | 0.417682273976703 | 0.835364547953405 | 0.582317726023297 |
| 18 | 0.586268186713937 | 0.827463626572125 | 0.413731813286063 |
| 19 | 0.783750275523135 | 0.432499448953731 | 0.216249724476865 |
| 20 | 0.678623481798762 | 0.642753036402477 | 0.321376518201239 |
| 21 | 0.690251459150382 | 0.619497081699237 | 0.309748540849618 |
| 22 | 0.717030870115589 | 0.565938259768822 | 0.282969129884411 |
| 23 | 0.637621198668274 | 0.724757602663452 | 0.362378801331726 |
| 24 | 0.562536729308479 | 0.874926541383041 | 0.437463270691521 |
| 25 | 0.553351434898301 | 0.893297130203399 | 0.446648565101699 |
| 26 | 0.525990661324787 | 0.948018677350427 | 0.474009338675213 |
| 27 | 0.456883079199242 | 0.913766158398483 | 0.543116920800758 |
| 28 | 0.541436530869456 | 0.917126938261088 | 0.458563469130544 |
| 29 | 0.448126990423736 | 0.896253980847472 | 0.551873009576264 |
| 30 | 0.40072564011397 | 0.80145128022794 | 0.59927435988603 |
| 31 | 0.312336515897004 | 0.624673031794008 | 0.687663484102996 |
| 32 | 0.487782188972392 | 0.975564377944783 | 0.512217811027608 |
| 33 | 0.405641874652116 | 0.811283749304231 | 0.594358125347884 |
| 34 | 0.357292831435238 | 0.714585662870477 | 0.642707168564762 |
| 35 | 0.388289904624343 | 0.776579809248685 | 0.611710095375657 |
| 36 | 0.369289072582691 | 0.738578145165382 | 0.63071092741731 |
| 37 | 0.579942384771227 | 0.840115230457545 | 0.420057615228773 |
| 38 | 0.59213836044914 | 0.815723279101721 | 0.407861639550860 |
| 39 | 0.485775669037473 | 0.971551338074946 | 0.514224330962527 |
| 40 | 0.516240367972191 | 0.967519264055618 | 0.483759632027809 |
| 41 | 0.431970604070929 | 0.863941208141858 | 0.568029395929071 |
| 42 | 0.455729698709730 | 0.911459397419461 | 0.54427030129027 |
| 43 | 0.329125011010474 | 0.658250022020948 | 0.670874988989526 |
| 44 | 0.360080372421016 | 0.720160744842033 | 0.639919627578984 |
| Meta Analysis of Goldfeld-Quandt test for Heteroskedasticity | |||
| Description | # significant tests | % significant tests | OK/NOK |
| 1% type I error level | 0 | 0 | OK |
| 5% type I error level | 0 | 0 | OK |
| 10% type I error level | 0 | 0 | OK |