| Multiple Linear Regression - Estimated Regression Equation |
| Y[t] = + 107.686862159163 + 0.20703592981642X[t] -11.3174485983840M1[t] -12.0618113824309M2[t] -0.307164690430088M3[t] -9.75940120697196M4[t] -10.6488473122473M5[t] -0.642562896732687M6[t] -12.7244730330837M7[t] -10.4690179481477M8[t] + 2.01657183169863M9[t] + 0.782200575551756M10[t] -2.64362276486180M11[t] + e[t] |
| Multiple Linear Regression - Ordinary Least Squares | |||||
| Variable | Parameter | S.D. | T-STAT H0: parameter = 0 | 2-tail p-value | 1-tail p-value |
| (Intercept) | 107.686862159163 | 8.570238 | 12.5652 | 0 | 0 |
| X | 0.20703592981642 | 0.118072 | 1.7535 | 0.085905 | 0.042952 |
| M1 | -11.3174485983840 | 3.350942 | -3.3774 | 0.001459 | 0.000729 |
| M2 | -12.0618113824309 | 3.503977 | -3.4423 | 0.001205 | 0.000602 |
| M3 | -0.307164690430088 | 3.753879 | -0.0818 | 0.935125 | 0.467563 |
| M4 | -9.75940120697196 | 3.546981 | -2.7515 | 0.008346 | 0.004173 |
| M5 | -10.6488473122473 | 3.518271 | -3.0267 | 0.003967 | 0.001984 |
| M6 | -0.642562896732687 | 3.829111 | -0.1678 | 0.867438 | 0.433719 |
| M7 | -12.7244730330837 | 3.781705 | -3.3647 | 0.001514 | 0.000757 |
| M8 | -10.4690179481477 | 3.661606 | -2.8591 | 0.006268 | 0.003134 |
| M9 | 2.01657183169863 | 3.89312 | 0.518 | 0.606849 | 0.303425 |
| M10 | 0.782200575551756 | 3.851937 | 0.2031 | 0.839941 | 0.419971 |
| M11 | -2.64362276486180 | 3.560867 | -0.7424 | 0.461457 | 0.230728 |
| Multiple Linear Regression - Regression Statistics | |
| Multiple R | 0.826905728562082 |
| R-squared | 0.683773083928788 |
| Adjusted R-squared | 0.604716354910984 |
| F-TEST (value) | 8.64914463858992 |
| F-TEST (DF numerator) | 12 |
| F-TEST (DF denominator) | 48 |
| p-value | 1.95141472980609e-08 |
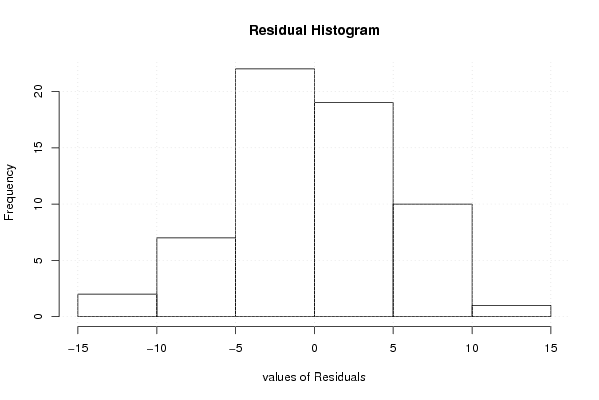
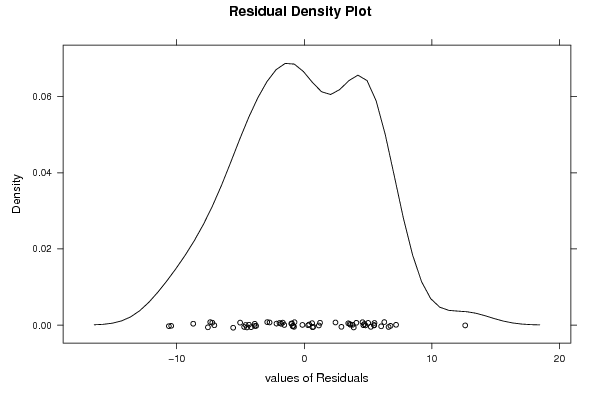
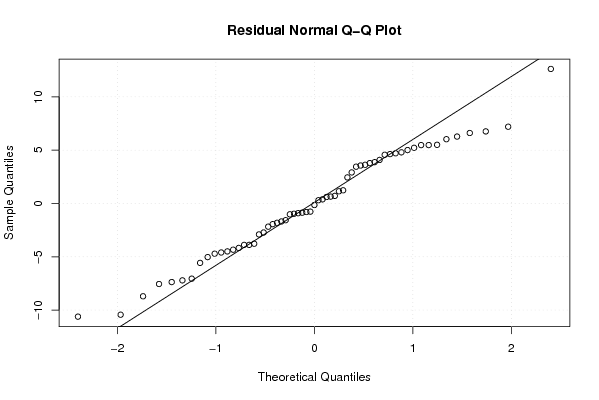
| Multiple Linear Regression - Residual Statistics | |
| Residual Standard Deviation | 5.50996467144787 |
| Sum Squared Residuals | 1457.26611266898 |
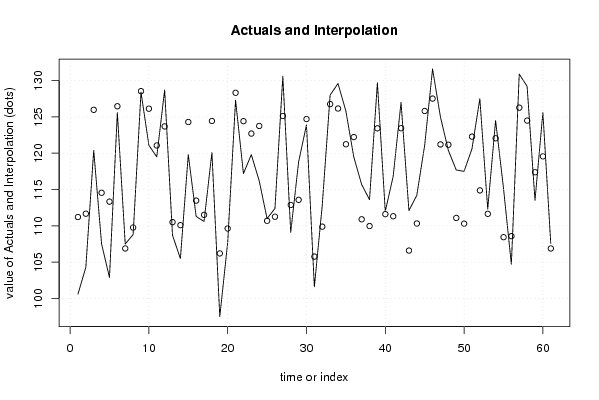
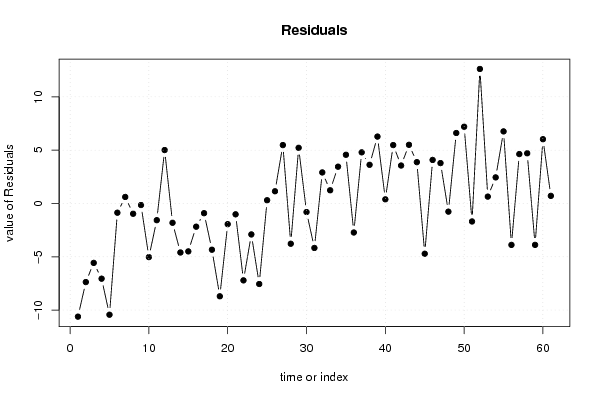
| Multiple Linear Regression - Actuals, Interpolation, and Residuals | |||
| Time or Index | Actuals | Interpolation Forecast | Residuals Prediction Error |
| 1 | 100.6 | 111.213889728616 | -10.6138897286156 |
| 2 | 104.3 | 111.670335337504 | -7.37033533750414 |
| 3 | 120.4 | 125.971523966247 | -5.5715239662469 |
| 4 | 107.5 | 114.552446116449 | -7.05244611644906 |
| 5 | 102.9 | 113.331742523467 | -10.4317425234674 |
| 6 | 125.6 | 126.46426947921 | -0.86426947920999 |
| 7 | 107.5 | 106.887658683505 | 0.612341316495469 |
| 8 | 108.8 | 109.764221557890 | -0.964221557889849 |
| 9 | 128.4 | 128.543703604155 | -0.143703604155318 |
| 10 | 121.1 | 126.129227548055 | -5.02922754805487 |
| 11 | 119.5 | 121.067820362092 | -1.56782036209158 |
| 12 | 128.7 | 123.690739533972 | 5.00926046602824 |
| 13 | 108.7 | 110.50996756724 | -1.80996756723996 |
| 14 | 105.5 | 110.096862270899 | -4.59686227089934 |
| 15 | 119.8 | 124.294532934734 | -4.49453293473391 |
| 16 | 111.3 | 113.475859281404 | -2.17585928140367 |
| 17 | 110.6 | 111.509826341083 | -0.909826341082922 |
| 18 | 120.1 | 124.435317367009 | -4.33531736700908 |
| 19 | 97.5 | 106.204440115110 | -8.70444011511035 |
| 20 | 107.7 | 109.64 | -1.94 |
| 21 | 127.3 | 128.315964081357 | -1.01596408135727 |
| 22 | 117.2 | 124.410829330579 | -7.21082933057857 |
| 23 | 119.8 | 122.703404207641 | -2.90340420764131 |
| 24 | 116.2 | 123.752850312917 | -7.55285031291667 |
| 25 | 111 | 110.696299904075 | 0.303700095925263 |
| 26 | 112.4 | 111.256263477871 | 1.14373652212872 |
| 27 | 130.6 | 125.122676654000 | 5.47732334600041 |
| 28 | 109.1 | 112.875455084936 | -3.77545508493606 |
| 29 | 118.8 | 113.580185639247 | 5.21981436075288 |
| 30 | 123.9 | 124.704464075770 | -0.804464075770418 |
| 31 | 101.6 | 105.769664662496 | -4.16966466249588 |
| 32 | 112.8 | 109.888443115780 | 2.91155688422029 |
| 33 | 128 | 126.763194607734 | 1.23680539226588 |
| 34 | 129.6 | 126.149931141037 | 3.45006885896349 |
| 35 | 125.8 | 121.233449105945 | 4.56655089405528 |
| 36 | 119.5 | 122.220784432275 | -2.72078443227517 |
| 37 | 115.7 | 110.903335833891 | 4.79666416610885 |
| 38 | 113.6 | 109.972640713009 | 3.62735928699051 |
| 39 | 129.7 | 123.424982029505 | 6.27501797049504 |
| 40 | 112 | 111.612535913056 | 0.387464086944115 |
| 41 | 116.8 | 111.323494004248 | 5.47650599575186 |
| 42 | 127 | 123.441544903890 | 3.55845509610974 |
| 43 | 112.1 | 106.597808381762 | 5.50219161823844 |
| 44 | 114.2 | 110.323218568394 | 3.87678143160582 |
| 45 | 121.1 | 125.810829330579 | -4.71082933057859 |
| 46 | 131.6 | 127.516368277825 | 4.08363172217512 |
| 47 | 125 | 121.212745512963 | 3.78725448703692 |
| 48 | 120.4 | 121.164901190211 | -0.764901190211415 |
| 49 | 117.7 | 111.089668170726 | 6.61033182927407 |
| 50 | 117.5 | 110.303898200716 | 7.19610179928424 |
| 51 | 120.6 | 122.286284415515 | -1.68628441551464 |
| 52 | 127.5 | 114.883703604155 | 12.6162963958447 |
| 53 | 112.3 | 111.654751491954 | 0.64524850804559 |
| 54 | 124.5 | 122.054404174120 | 2.44559582587975 |
| 55 | 115.2 | 108.440428157128 | 6.75957184287232 |
| 56 | 104.7 | 108.584116757936 | -3.88411675793626 |
| 57 | 130.9 | 126.266308376175 | 4.6336916238253 |
| 58 | 129.2 | 124.493643702505 | 4.70635629749484 |
| 59 | 113.5 | 117.382580811359 | -3.88258081135931 |
| 60 | 125.6 | 119.570724530625 | 6.029275469375 |
| 61 | 107.6 | 106.886838795453 | 0.713161204547389 |
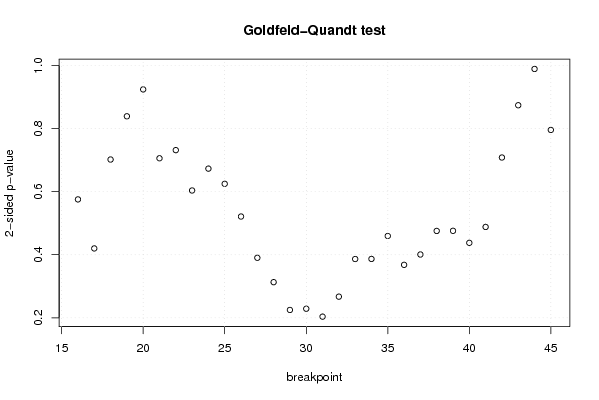
| Goldfeld-Quandt test for Heteroskedasticity | |||
| p-values | Alternative Hypothesis | ||
| breakpoint index | greater | 2-sided | less |
| 16 | 0.287691668237385 | 0.575383336474771 | 0.712308331762615 |
| 17 | 0.209995640551788 | 0.419991281103576 | 0.790004359448212 |
| 18 | 0.350857095188127 | 0.701714190376254 | 0.649142904811873 |
| 19 | 0.580611879737384 | 0.838776240525232 | 0.419388120262616 |
| 20 | 0.461982732109232 | 0.923965464218465 | 0.538017267890768 |
| 21 | 0.352852501444406 | 0.705705002888811 | 0.647147498555594 |
| 22 | 0.365737721164701 | 0.731475442329403 | 0.634262278835299 |
| 23 | 0.301824867848165 | 0.60364973569633 | 0.698175132151835 |
| 24 | 0.663555187159515 | 0.67288962568097 | 0.336444812840485 |
| 25 | 0.687620092489318 | 0.624759815021363 | 0.312379907510682 |
| 26 | 0.739453258723844 | 0.521093482552312 | 0.260546741276156 |
| 27 | 0.804843076331047 | 0.390313847337906 | 0.195156923668953 |
| 28 | 0.843479153671764 | 0.313041692656472 | 0.156520846328236 |
| 29 | 0.887502335271304 | 0.224995329457393 | 0.112497664728696 |
| 30 | 0.885578847586675 | 0.22884230482665 | 0.114421152413325 |
| 31 | 0.89811242521102 | 0.203775149577960 | 0.101887574788980 |
| 32 | 0.866416863774165 | 0.267166272451669 | 0.133583136225835 |
| 33 | 0.806787559833565 | 0.38642488033287 | 0.193212440166435 |
| 34 | 0.806625924707018 | 0.386748150585965 | 0.193374075292982 |
| 35 | 0.770264740842183 | 0.459470518315635 | 0.229735259157817 |
| 36 | 0.816011201381117 | 0.367977597237767 | 0.183988798618883 |
| 37 | 0.799602933278847 | 0.400794133442305 | 0.200397066721153 |
| 38 | 0.762286598107188 | 0.475426803785624 | 0.237713401892812 |
| 39 | 0.762110362626047 | 0.475779274747906 | 0.237889637373953 |
| 40 | 0.781130701185441 | 0.437738597629117 | 0.218869298814559 |
| 41 | 0.755942922507329 | 0.488114154985343 | 0.244057077492671 |
| 42 | 0.645926845701957 | 0.708146308596087 | 0.354073154298043 |
| 43 | 0.563121210415944 | 0.873757579168112 | 0.436878789584056 |
| 44 | 0.505598341911823 | 0.988803316176354 | 0.494401658088177 |
| 45 | 0.602278505061903 | 0.795442989876194 | 0.397721494938097 |
| Meta Analysis of Goldfeld-Quandt test for Heteroskedasticity | |||
| Description | # significant tests | % significant tests | OK/NOK |
| 1% type I error level | 0 | 0 | OK |
| 5% type I error level | 0 | 0 | OK |
| 10% type I error level | 0 | 0 | OK |