| Multiple Linear Regression - Estimated Regression Equation |
| Y[t] = + 562.196907216495 -43.9845360824743X[t] + 0.80051546391773M1[t] + 3.8005154639175M2[t] + 0.133848797250830M3[t] -8.1994845360825M4[t] -6.86872852233679M5[t] -17.3687285223368M6[t] -14.5353951890034M7[t] + 36.6312714776632M8[t] + 46.1312714776632M9[t] + 36.1312714776632M10[t] + 15.4000000000000M11[t] + e[t] |
| Multiple Linear Regression - Ordinary Least Squares | |||||
| Variable | Parameter | S.D. | T-STAT H0: parameter = 0 | 2-tail p-value | 1-tail p-value |
| (Intercept) | 562.196907216495 | 14.454172 | 38.8951 | 0 | 0 |
| X | -43.9845360824743 | 8.918478 | -4.9318 | 7e-06 | 4e-06 |
| M1 | 0.80051546391773 | 19.423726 | 0.0412 | 0.96727 | 0.483635 |
| M2 | 3.8005154639175 | 19.423726 | 0.1957 | 0.845569 | 0.422785 |
| M3 | 0.133848797250830 | 19.423726 | 0.0069 | 0.994526 | 0.497263 |
| M4 | -8.1994845360825 | 19.423726 | -0.4221 | 0.674513 | 0.337256 |
| M5 | -6.86872852233679 | 19.457821 | -0.353 | 0.725386 | 0.362693 |
| M6 | -17.3687285223368 | 19.457821 | -0.8926 | 0.375806 | 0.187903 |
| M7 | -14.5353951890034 | 19.457821 | -0.747 | 0.458122 | 0.229061 |
| M8 | 36.6312714776632 | 19.457821 | 1.8826 | 0.064862 | 0.032431 |
| M9 | 46.1312714776632 | 19.457821 | 2.3708 | 0.021152 | 0.010576 |
| M10 | 36.1312714776632 | 19.457821 | 1.8569 | 0.068495 | 0.034247 |
| M11 | 15.4000000000000 | 20.285044 | 0.7592 | 0.450873 | 0.225437 |
| Multiple Linear Regression - Regression Statistics | |
| Multiple R | 0.687111170448407 |
| R-squared | 0.47212176055498 |
| Adjusted R-squared | 0.360989499619186 |
| F-TEST (value) | 4.24828719023134 |
| F-TEST (DF numerator) | 12 |
| F-TEST (DF denominator) | 57 |
| p-value | 9.1030585401386e-05 |
| Multiple Linear Regression - Residual Statistics | |
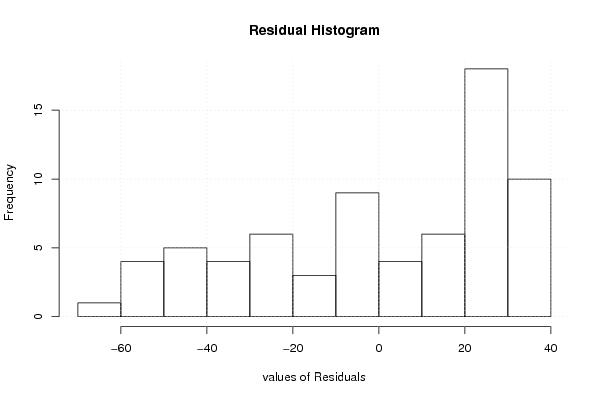
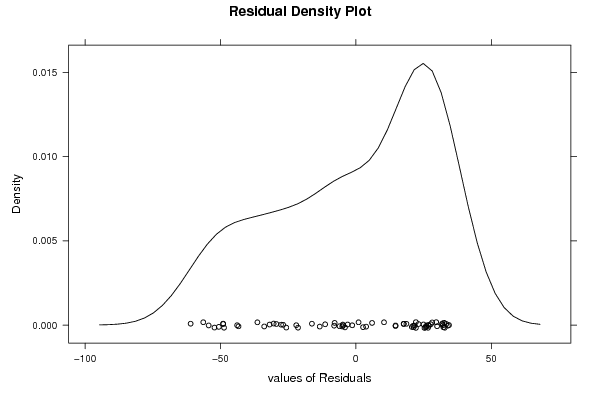
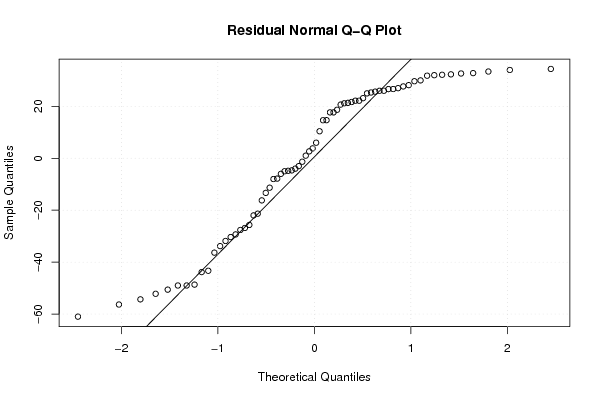
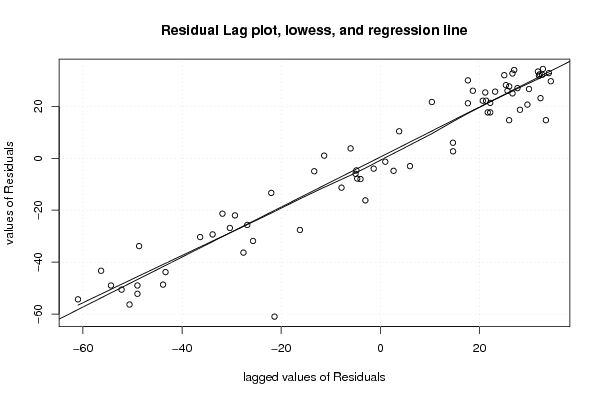
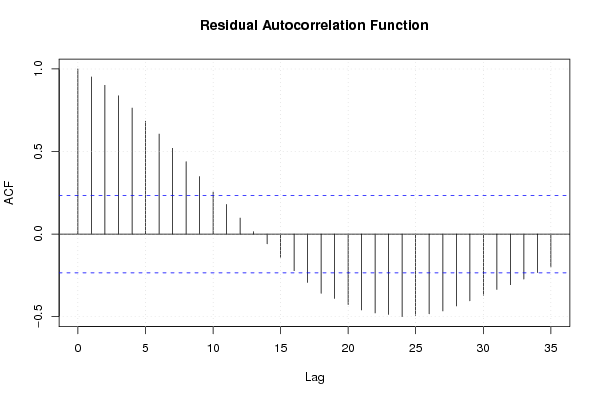
| Residual Standard Deviation | 32.0734710949691 |
| Sum Squared Residuals | 58636.3302405498 |
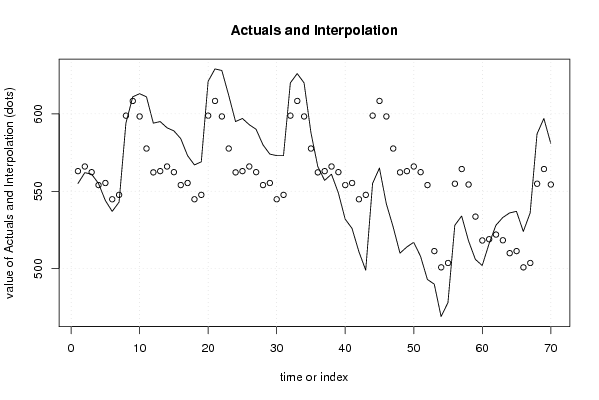
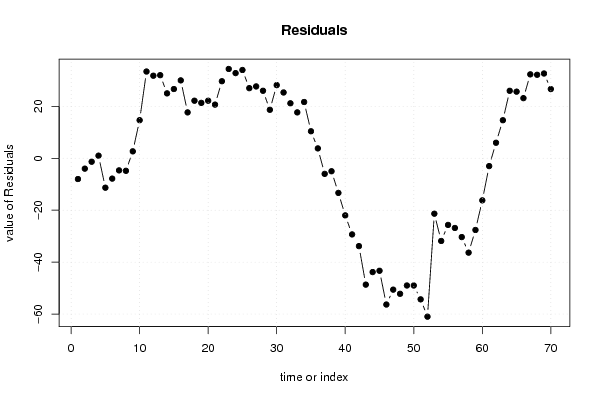
| Multiple Linear Regression - Actuals, Interpolation, and Residuals | |||
| Time or Index | Actuals | Interpolation Forecast | Residuals Prediction Error |
| 1 | 555 | 562.997422680411 | -7.99742268041122 |
| 2 | 562 | 565.997422680412 | -3.99742268041233 |
| 3 | 561 | 562.330756013746 | -1.33075601374569 |
| 4 | 555 | 553.997422680412 | 1.00257731958763 |
| 5 | 544 | 555.328178694158 | -11.3281786941581 |
| 6 | 537 | 544.828178694158 | -7.82817869415804 |
| 7 | 543 | 547.661512027491 | -4.66151202749142 |
| 8 | 594 | 598.828178694158 | -4.82817869415803 |
| 9 | 611 | 608.328178694158 | 2.67182130584191 |
| 10 | 613 | 598.328178694158 | 14.6718213058419 |
| 11 | 611 | 577.596907216495 | 33.4030927835052 |
| 12 | 594 | 562.196907216495 | 31.8030927835052 |
| 13 | 595 | 562.997422680413 | 32.0025773195874 |
| 14 | 591 | 565.997422680412 | 25.0025773195876 |
| 15 | 589 | 562.330756013746 | 26.6692439862543 |
| 16 | 584 | 553.997422680412 | 30.0025773195876 |
| 17 | 573 | 555.328178694158 | 17.6718213058419 |
| 18 | 567 | 544.828178694158 | 22.1718213058419 |
| 19 | 569 | 547.661512027491 | 21.3384879725086 |
| 20 | 621 | 598.828178694158 | 22.1718213058419 |
| 21 | 629 | 608.328178694158 | 20.6718213058419 |
| 22 | 628 | 598.328178694158 | 29.6718213058419 |
| 23 | 612 | 577.596907216495 | 34.4030927835052 |
| 24 | 595 | 562.196907216495 | 32.8030927835051 |
| 25 | 597 | 562.997422680413 | 34.0025773195874 |
| 26 | 593 | 565.997422680412 | 27.0025773195876 |
| 27 | 590 | 562.330756013746 | 27.6692439862543 |
| 28 | 580 | 553.997422680412 | 26.0025773195876 |
| 29 | 574 | 555.328178694158 | 18.6718213058419 |
| 30 | 573 | 544.828178694158 | 28.1718213058419 |
| 31 | 573 | 547.661512027491 | 25.3384879725086 |
| 32 | 620 | 598.828178694158 | 21.1718213058419 |
| 33 | 626 | 608.328178694158 | 17.6718213058419 |
| 34 | 620 | 598.328178694158 | 21.6718213058419 |
| 35 | 588 | 577.596907216495 | 10.4030927835052 |
| 36 | 566 | 562.196907216495 | 3.80309278350514 |
| 37 | 557 | 562.997422680413 | -5.9974226804126 |
| 38 | 561 | 565.997422680412 | -4.99742268041238 |
| 39 | 549 | 562.330756013746 | -13.3307560137457 |
| 40 | 532 | 553.997422680412 | -21.9974226804124 |
| 41 | 526 | 555.328178694158 | -29.3281786941581 |
| 42 | 511 | 544.828178694158 | -33.8281786941581 |
| 43 | 499 | 547.661512027491 | -48.6615120274914 |
| 44 | 555 | 598.828178694158 | -43.8281786941581 |
| 45 | 565 | 608.328178694158 | -43.3281786941581 |
| 46 | 542 | 598.328178694158 | -56.3281786941581 |
| 47 | 527 | 577.596907216495 | -50.5969072164948 |
| 48 | 510 | 562.196907216495 | -52.1969072164949 |
| 49 | 514 | 562.997422680413 | -48.9974226804126 |
| 50 | 517 | 565.997422680412 | -48.9974226804124 |
| 51 | 508 | 562.330756013746 | -54.3307560137457 |
| 52 | 493 | 553.997422680412 | -60.9974226804124 |
| 53 | 490 | 511.343642611684 | -21.3436426116838 |
| 54 | 469 | 500.843642611684 | -31.8436426116838 |
| 55 | 478 | 503.676975945017 | -25.6769759450172 |
| 56 | 528 | 554.843642611684 | -26.8436426116838 |
| 57 | 534 | 564.343642611684 | -30.3436426116838 |
| 58 | 518 | 554.343642611684 | -36.3436426116838 |
| 59 | 506 | 533.612371134021 | -27.6123711340206 |
| 60 | 502 | 518.212371134021 | -16.2123711340206 |
| 61 | 516 | 519.012886597938 | -3.01288659793836 |
| 62 | 528 | 522.012886597938 | 5.98711340206187 |
| 63 | 533 | 518.346219931271 | 14.6537800687285 |
| 64 | 536 | 510.012886597938 | 25.9871134020619 |
| 65 | 537 | 511.343642611684 | 25.6563573883162 |
| 66 | 524 | 500.843642611684 | 23.1563573883162 |
| 67 | 536 | 503.676975945017 | 32.3230240549828 |
| 68 | 587 | 554.843642611684 | 32.1563573883162 |
| 69 | 597 | 564.343642611684 | 32.6563573883162 |
| 70 | 581 | 554.343642611684 | 26.6563573883162 |
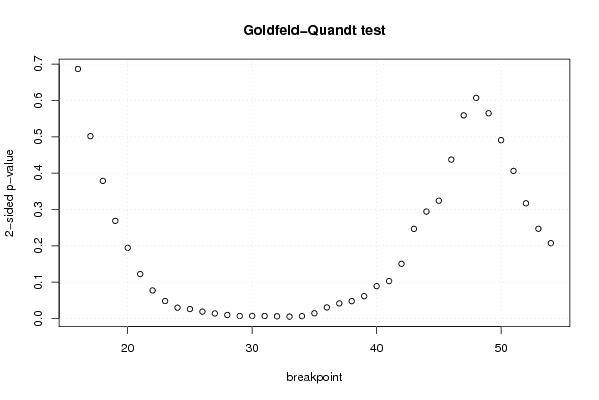
| Goldfeld-Quandt test for Heteroskedasticity | |||
| p-values | Alternative Hypothesis | ||
| breakpoint index | greater | 2-sided | less |
| 16 | 0.343381164972707 | 0.686762329945414 | 0.656618835027293 |
| 17 | 0.250854647846801 | 0.501709295693601 | 0.7491453521532 |
| 18 | 0.18929786806102 | 0.37859573612204 | 0.81070213193898 |
| 19 | 0.134300019923798 | 0.268600039847597 | 0.865699980076202 |
| 20 | 0.0972148317809989 | 0.194429663561998 | 0.902785168219001 |
| 21 | 0.0610754299903543 | 0.122150859980709 | 0.938924570009646 |
| 22 | 0.0385265179664507 | 0.0770530359329014 | 0.96147348203355 |
| 23 | 0.0239446010954762 | 0.0478892021909525 | 0.976055398904524 |
| 24 | 0.0147867934000526 | 0.0295735868001052 | 0.985213206599947 |
| 25 | 0.0129714066646477 | 0.0259428133292954 | 0.987028593335352 |
| 26 | 0.00936549658997399 | 0.0187309931799480 | 0.990634503410026 |
| 27 | 0.00687917277230095 | 0.0137583455446019 | 0.9931208272277 |
| 28 | 0.00478933415581597 | 0.00957866831163195 | 0.995210665844184 |
| 29 | 0.00332962110164543 | 0.00665924220329085 | 0.996670378898355 |
| 30 | 0.00345397426740992 | 0.00690794853481983 | 0.99654602573259 |
| 31 | 0.0033419542697251 | 0.0066839085394502 | 0.996658045730275 |
| 32 | 0.00293583492161676 | 0.00587166984323352 | 0.997064165078383 |
| 33 | 0.00246289223925413 | 0.00492578447850825 | 0.997537107760746 |
| 34 | 0.00320369483854950 | 0.00640738967709899 | 0.99679630516145 |
| 35 | 0.00709568395100848 | 0.0141913679020170 | 0.992904316048992 |
| 36 | 0.0152114266260229 | 0.0304228532520458 | 0.984788573373977 |
| 37 | 0.0206553660564964 | 0.0413107321129928 | 0.979344633943504 |
| 38 | 0.0238468545706986 | 0.0476937091413973 | 0.976153145429301 |
| 39 | 0.0306296260292763 | 0.0612592520585526 | 0.969370373970724 |
| 40 | 0.0444649732756112 | 0.0889299465512225 | 0.955535026724389 |
| 41 | 0.0514101992673715 | 0.102820398534743 | 0.948589800732629 |
| 42 | 0.0752063546611028 | 0.150412709322206 | 0.924793645338897 |
| 43 | 0.123243326740749 | 0.246486653481499 | 0.87675667325925 |
| 44 | 0.147088661538242 | 0.294177323076484 | 0.852911338461758 |
| 45 | 0.162043334078506 | 0.324086668157011 | 0.837956665921494 |
| 46 | 0.218632950779787 | 0.437265901559574 | 0.781367049220213 |
| 47 | 0.279512106073364 | 0.559024212146728 | 0.720487893926636 |
| 48 | 0.303536393572119 | 0.607072787144237 | 0.696463606427881 |
| 49 | 0.282365454722467 | 0.564730909444935 | 0.717634545277533 |
| 50 | 0.245440969977629 | 0.490881939955258 | 0.754559030022371 |
| 51 | 0.203033725534259 | 0.406067451068518 | 0.796966274465741 |
| 52 | 0.158459842099167 | 0.316919684198335 | 0.841540157900833 |
| 53 | 0.123427830221458 | 0.246855660442916 | 0.876572169778542 |
| 54 | 0.103639047175279 | 0.207278094350558 | 0.896360952824721 |
| Meta Analysis of Goldfeld-Quandt test for Heteroskedasticity | |||
| Description | # significant tests | % significant tests | OK/NOK |
| 1% type I error level | 7 | 0.179487179487179 | NOK |
| 5% type I error level | 16 | 0.41025641025641 | NOK |
| 10% type I error level | 19 | 0.487179487179487 | NOK |