| Multiple Linear Regression - Estimated Regression Equation |
| Yt[t] = + 17424.9461206477 -0.0769106839892755`Yt-1`[t] + 0.289791286320848`Yt-2`[t] -0.229658583665953`Yt-3`[t] -0.248195965086348`Yt-4`[t] -482.673839824678M1[t] + 682.241579160312M2[t] -52.7929730074228M3[t] + 704.745486669194M4[t] + 478.005060254843M5[t] -46.9907665014013M6[t] + 655.375475998909M7[t] + 604.825547340014M8[t] -1081.26087721467M9[t] + 581.745707803682M10[t] + 738.588003595692M11[t] -155.411865696257t + e[t] |
| Multiple Linear Regression - Ordinary Least Squares | |||||
| Variable | Parameter | S.D. | T-STAT H0: parameter = 0 | 2-tail p-value | 1-tail p-value |
| (Intercept) | 17424.9461206477 | 4246.586402 | 4.1033 | 0.000201 | 1e-04 |
| `Yt-1` | -0.0769106839892755 | 0.15908 | -0.4835 | 0.631464 | 0.315732 |
| `Yt-2` | 0.289791286320848 | 0.15753 | 1.8396 | 0.073448 | 0.036724 |
| `Yt-3` | -0.229658583665953 | 0.153446 | -1.4967 | 0.142529 | 0.071264 |
| `Yt-4` | -0.248195965086348 | 0.154441 | -1.6071 | 0.11611 | 0.058055 |
| M1 | -482.673839824678 | 1029.309839 | -0.4689 | 0.641731 | 0.320865 |
| M2 | 682.241579160312 | 1012.524968 | 0.6738 | 0.504411 | 0.252206 |
| M3 | -52.7929730074228 | 1017.625576 | -0.0519 | 0.95889 | 0.479445 |
| M4 | 704.745486669194 | 1009.209135 | 0.6983 | 0.489124 | 0.244562 |
| M5 | 478.005060254843 | 1029.194885 | 0.4644 | 0.644911 | 0.322455 |
| M6 | -46.9907665014013 | 1006.65 | -0.0467 | 0.963006 | 0.481503 |
| M7 | 655.375475998909 | 1037.091521 | 0.6319 | 0.531116 | 0.265558 |
| M8 | 604.825547340014 | 1024.984216 | 0.5901 | 0.558539 | 0.279269 |
| M9 | -1081.26087721467 | 1068.706898 | -1.0117 | 0.317895 | 0.158948 |
| M10 | 581.745707803682 | 1106.005417 | 0.526 | 0.601875 | 0.300937 |
| M11 | 738.588003595692 | 1086.066772 | 0.6801 | 0.500485 | 0.250243 |
| t | -155.411865696257 | 39.28188 | -3.9563 | 0.000312 | 0.000156 |
| Multiple Linear Regression - Regression Statistics | |
| Multiple R | 0.866131590033882 |
| R-squared | 0.75018393125462 |
| Adjusted R-squared | 0.647695287666772 |
| F-TEST (value) | 7.31967860040609 |
| F-TEST (DF numerator) | 16 |
| F-TEST (DF denominator) | 39 |
| p-value | 2.06504179978140e-07 |
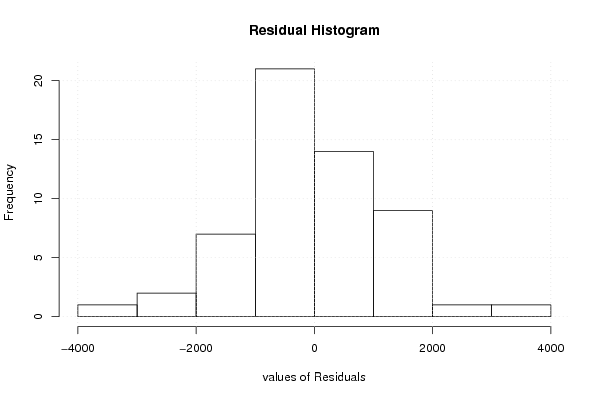
| Multiple Linear Regression - Residual Statistics | |
| Residual Standard Deviation | 1472.27954328209 |
| Sum Squared Residuals | 84536675.0891104 |
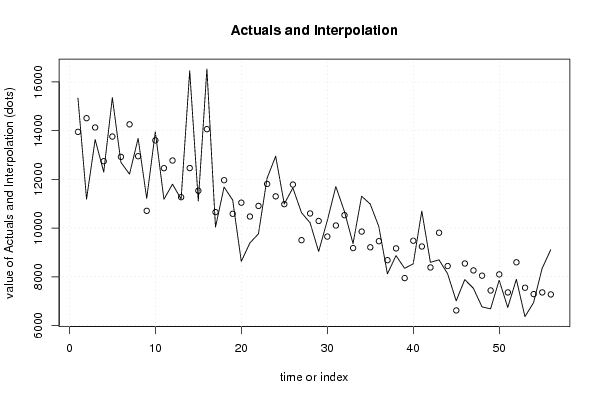
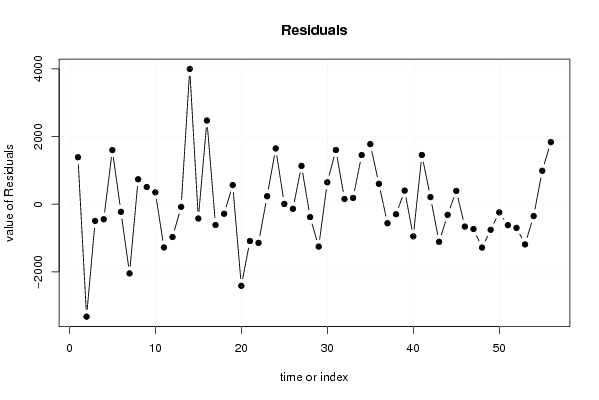
| Multiple Linear Regression - Actuals, Interpolation, and Residuals | |||
| Time or Index | Actuals | Interpolation Forecast | Residuals Prediction Error |
| 1 | 15335.63636 | 13947.7887123181 | 1387.84764768191 |
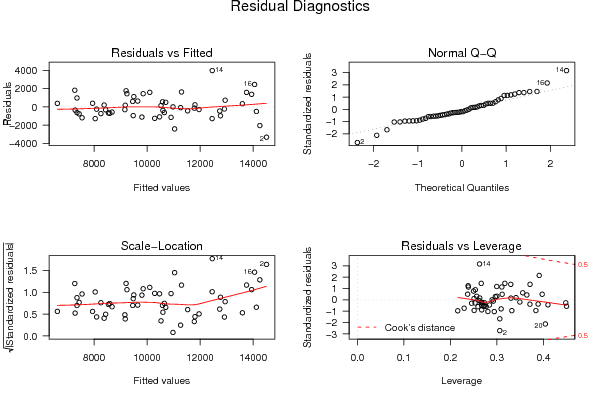
| 2 | 11188.5 | 14509.2671097938 | -3320.7671097938 |
| 3 | 13633.25 | 14126.9903575724 | -493.740357572352 |
| 4 | 12298.46667 | 12743.4322415577 | -444.965571557676 |
| 5 | 15353.63636 | 13755.0272931160 | 1598.60906688404 |
| 6 | 12696.15385 | 12920.6805207395 | -224.526670739477 |
| 7 | 12213.93333 | 14257.1526128946 | -2043.21928289462 |
| 8 | 13683.72727 | 12947.8053465242 | 735.921923475761 |
| 9 | 11214.14286 | 10705.5537738950 | 508.589086104975 |
| 10 | 13950.23077 | 13599.3419137661 | 350.888856233935 |
| 11 | 11179.13333 | 12456.8083012018 | -1277.67497120176 |
| 12 | 11801.875 | 12771.1941987747 | -969.319198774715 |
| 13 | 11188.82353 | 11266.7479256135 | -77.9243956134569 |
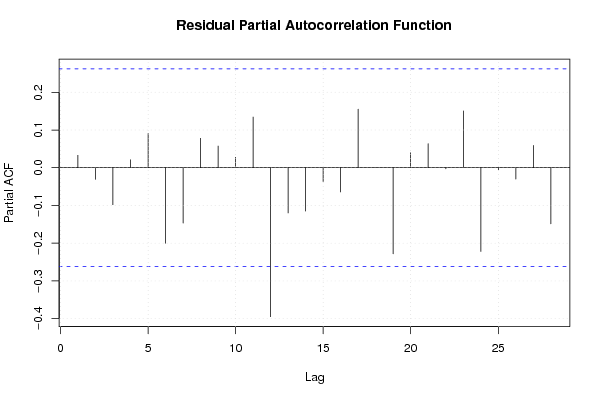
| 14 | 16456.27273 | 12461.1871302626 | 3995.08559973738 |
| 15 | 11110.0625 | 11532.7178510228 | -422.655351022818 |
| 16 | 16530.69231 | 14058.7165723701 | 2471.97573762993 |
| 17 | 10038.41176 | 10652.8167728662 | -614.405012866218 |
| 18 | 11681.25 | 11963.0295351384 | -281.77953513844 |
| 19 | 11148.88235 | 10584.2394103273 | 564.642939672658 |
| 20 | 8631 | 11040.9320916604 | -2409.93209166037 |
| 21 | 9386.444444 | 10472.8762823912 | -1086.43183839125 |
| 22 | 9764.736842 | 10907.2258658294 | -1142.48902382937 |
| 23 | 12043.75 | 11808.8675830287 | 234.882416971303 |
| 24 | 12948.06667 | 11300.647032341 | 1647.41963765900 |
| 25 | 10987.125 | 10979.0715086024 | 8.0534913975518 |
| 26 | 11648.3125 | 11784.1699372059 | -135.857437205851 |
| 27 | 10633.35294 | 9501.28137171024 | 1132.07156828976 |
| 28 | 10219.3 | 10598.9749137253 | -379.67491372535 |
| 29 | 9037.6 | 10289.3917054579 | -1251.79170545792 |
| 30 | 10296.31579 | 9648.8705395503 | 647.445250449693 |
| 31 | 11705.41176 | 10103.5695402330 | 1601.84221976705 |
| 32 | 10681.94444 | 10528.1518962732 | 153.792543726773 |
| 33 | 9362.947368 | 9177.93119771314 | 185.016170286857 |
| 34 | 11306.35294 | 9854.35980786439 | 1451.99313213561 |
| 35 | 10984.45 | 9209.4038489669 | 1775.04615103311 |
| 36 | 10062.61905 | 9460.28321415828 | 602.335835841715 |
| 37 | 8118.583333 | 8680.86147054834 | -562.278137548336 |
| 38 | 8867.48 | 9164.32591554183 | -296.84591554183 |
| 39 | 8346.72 | 7944.51813291235 | 402.201867087648 |
| 40 | 8529.307692 | 9478.97967478225 | -949.671982782253 |
| 41 | 10697.18182 | 9242.38400121523 | 1454.79781878477 |
| 42 | 8591.84 | 8381.8798219205 | 209.960178079504 |
| 43 | 8695.607143 | 9806.3062103056 | -1110.69906730559 |
| 44 | 8125.571429 | 8439.06546961245 | -313.494040612452 |
| 45 | 7009.758621 | 6616.93203900059 | 392.826581999415 |
| 46 | 7883.466667 | 8543.85963154018 | -660.392964540184 |
| 47 | 7527.645161 | 8259.89875780266 | -732.253596802657 |
| 48 | 6763.758621 | 8044.194895726 | -1280.43627472600 |
| 49 | 6682.333333 | 7438.03193891767 | -755.698605917668 |
| 50 | 7855.681818 | 8097.29695519589 | -241.615137195890 |
| 51 | 6738.88 | 7356.75772678224 | -617.877726782237 |
| 52 | 7895.434783 | 8593.09805256466 | -697.663269564656 |
| 53 | 6361.884615 | 7549.09478234467 | -1187.21016734467 |
| 54 | 6935.956522 | 7287.05574465128 | -351.099222651279 |
| 55 | 8344.454545 | 7357.0213542395 | 987.433190760505 |
| 56 | 9107.944444 | 7274.23277892971 | 1833.71166507029 |
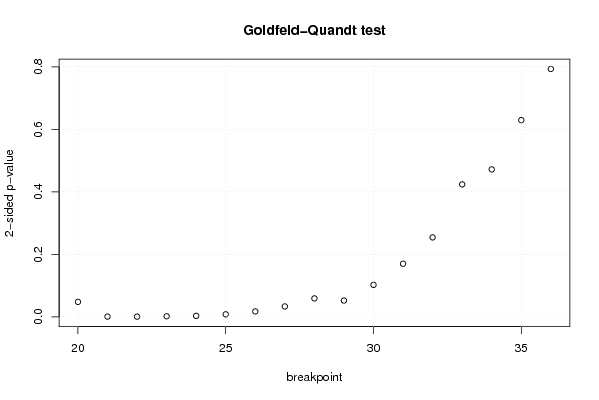
| Goldfeld-Quandt test for Heteroskedasticity | |||
| p-values | Alternative Hypothesis | ||
| breakpoint index | greater | 2-sided | less |
| 20 | 0.97612878428926 | 0.0477424314214779 | 0.0238712157107390 |
| 21 | 0.999620903367533 | 0.000758193264934088 | 0.000379096632467044 |
| 22 | 0.999737789650786 | 0.000524420698427547 | 0.000262210349213774 |
| 23 | 0.99915982928248 | 0.00168034143503955 | 0.000840170717519775 |
| 24 | 0.998472940966378 | 0.00305411806724405 | 0.00152705903362203 |
| 25 | 0.99604498485283 | 0.0079100302943398 | 0.0039550151471699 |
| 26 | 0.991336782343626 | 0.0173264353127479 | 0.00866321765637397 |
| 27 | 0.983390571312652 | 0.0332188573746952 | 0.0166094286873476 |
| 28 | 0.97057254211588 | 0.0588549157682404 | 0.0294274578841202 |
| 29 | 0.973959512124225 | 0.0520809757515499 | 0.0260404878757749 |
| 30 | 0.948895757802278 | 0.102208484395445 | 0.0511042421977225 |
| 31 | 0.915054702655165 | 0.169890594689670 | 0.0849452973448348 |
| 32 | 0.87294780381496 | 0.254104392370081 | 0.127052196185040 |
| 33 | 0.788129886328093 | 0.423740227343813 | 0.211870113671907 |
| 34 | 0.764206198261504 | 0.471587603476992 | 0.235793801738496 |
| 35 | 0.685356244109053 | 0.629287511781894 | 0.314643755890947 |
| 36 | 0.603496369793614 | 0.793007260412773 | 0.396503630206386 |
| Meta Analysis of Goldfeld-Quandt test for Heteroskedasticity | |||
| Description | # significant tests | % significant tests | OK/NOK |
| 1% type I error level | 5 | 0.294117647058824 | NOK |
| 5% type I error level | 8 | 0.470588235294118 | NOK |
| 10% type I error level | 10 | 0.588235294117647 | NOK |