Free Statistics

of Irreproducible Research!

Author's title

Author*The author of this computation has been verified*
R Software Modulerwasp_multipleregression.wasp
Title produced by softwareMultiple Regression
Date of computationFri, 20 Nov 2009 07:51:00 -0700
Cite this page as followsStatistical Computations at FreeStatistics.org, Office for Research Development and Education, URL https://freestatistics.org/blog/index.php?v=date/2009/Nov/20/t1258729323mq8mbz48cv8xay3.htm/, Retrieved Sat, 20 Apr 2024 07:20:05 +0000
Statistical Computations at FreeStatistics.org, Office for Research Development and Education, URL https://freestatistics.org/blog/index.php?pk=58243, Retrieved Sat, 20 Apr 2024 07:20:05 +0000
QR Codes:

Original text written by user:
IsPrivate?No (this computation is public)
User-defined keywords
Estimated Impact101
Family? (F = Feedback message, R = changed R code, M = changed R Module, P = changed Parameters, D = changed Data)
-     [Multiple Regression] [Q1 The Seatbeltlaw] [2007-11-14 19:27:43] [8cd6641b921d30ebe00b648d1481bba0]
- RMPD  [Multiple Regression] [Seatbelt] [2009-11-12 14:03:14] [b98453cac15ba1066b407e146608df68]
-   PD      [Multiple Regression] [ws7] [2009-11-20 14:51:00] [557d56ec4b06cd0135c259898de8ce95] [Current]
Feedback Forum

Post a new message
Dataseries X:
15335,63636	13845,66667	12823,61538	12792	10284,5
11188,5	15335,63636	13845,66667	12823,61538	12792
13633,25	11188,5	15335,63636	13845,66667	12823,61538
12298,46667	13633,25	11188,5	15335,63636	13845,66667
15353,63636	12298,46667	13633,25	11188,5	15335,63636
12696,15385	15353,63636	12298,46667	13633,25	11188,5
12213,93333	12696,15385	15353,63636	12298,46667	13633,25
13683,72727	12213,93333	12696,15385	15353,63636	12298,46667
11214,14286	13683,72727	12213,93333	12696,15385	15353,63636
13950,23077	11214,14286	13683,72727	12213,93333	12696,15385
11179,13333	13950,23077	11214,14286	13683,72727	12213,93333
11801,875	11179,13333	13950,23077	11214,14286	13683,72727
11188,82353	11801,875	11179,13333	13950,23077	11214,14286
16456,27273	11188,82353	11801,875	11179,13333	13950,23077
11110,0625	16456,27273	11188,82353	11801,875	11179,13333
16530,69231	11110,0625	16456,27273	11188,82353	11801,875
10038,41176	16530,69231	11110,0625	16456,27273	11188,82353
11681,25	10038,41176	16530,69231	11110,0625	16456,27273
11148,88235	11681,25	10038,41176	16530,69231	11110,0625
8631	11148,88235	11681,25	10038,41176	16530,69231
9386,444444	8631	11148,88235	11681,25	10038,41176
9764,736842	9386,444444	8631	11148,88235	11681,25
12043,75	9764,736842	9386,444444	8631	11148,88235
12948,06667	12043,75	9764,736842	9386,444444	8631
10987,125	12948,06667	12043,75	9764,736842	9386,444444
11648,3125	10987,125	12948,06667	12043,75	9764,736842
10633,35294	11648,3125	10987,125	12948,06667	12043,75
10219,3	10633,35294	11648,3125	10987,125	12948,06667
9037,6	10219,3	10633,35294	11648,3125	10987,125
10296,31579	9037,6	10219,3	10633,35294	11648,3125
11705,41176	10296,31579	9037,6	10219,3	10633,35294
10681,94444	11705,41176	10296,31579	9037,6	10219,3
9362,947368	10681,94444	11705,41176	10296,31579	9037,6
11306,35294	9362,947368	10681,94444	11705,41176	10296,31579
10984,45	11306,35294	9362,947368	10681,94444	11705,41176
10062,61905	10984,45	11306,35294	9362,947368	10681,94444
8118,583333	10062,61905	10984,45	11306,35294	9362,947368
8867,48	8118,583333	10062,61905	10984,45	11306,35294
8346,72	8867,48	8118,583333	10062,61905	10984,45
8529,307692	8346,72	8867,48	8118,583333	10062,61905
10697,18182	8529,307692	8346,72	8867,48	8118,583333
8591,84	10697,18182	8529,307692	8346,72	8867,48
8695,607143	8591,84	10697,18182	8529,307692	8346,72
8125,571429	8695,607143	8591,84	10697,18182	8529,307692
7009,758621	8125,571429	8695,607143	8591,84	10697,18182
7883,466667	7009,758621	8125,571429	8695,607143	8591,84
7527,645161	7883,466667	7009,758621	8125,571429	8695,607143
6763,758621	7527,645161	7883,466667	7009,758621	8125,571429
6682,333333	6763,758621	7527,645161	7883,466667	7009,758621
7855,681818	6682,333333	6763,758621	7527,645161	7883,466667
6738,88	7855,681818	6682,333333	6763,758621	7527,645161
7895,434783	6738,88	7855,681818	6682,333333	6763,758621
6361,884615	7895,434783	6738,88	7855,681818	6682,333333
6935,956522	6361,884615	7895,434783	6738,88	7855,681818
8344,454545	6935,956522	6361,884615	7895,434783	6738,88
9107,944444	8344,454545	6935,956522	6361,884615	7895,434783


Summary of computational transaction
Raw Inputview raw input (R code)
Raw Outputview raw output of R engine
Computing time3 seconds
R Server'Gwilym Jenkins' @ 72.249.127.135

\begin{tabular}{lllllllll}
\hline
Summary of computational transaction \tabularnewline
Raw Input & view raw input (R code)  \tabularnewline
Raw Output & view raw output of R engine  \tabularnewline
Computing time & 3 seconds \tabularnewline
R Server & 'Gwilym Jenkins' @ 72.249.127.135 \tabularnewline
\hline
\end{tabular}
%Source: https://freestatistics.org/blog/index.php?pk=58243&T=0

[TABLE]
[ROW][C]Summary of computational transaction[/C][/ROW]
[ROW][C]Raw Input[/C][C]view raw input (R code) [/C][/ROW]
[ROW][C]Raw Output[/C][C]view raw output of R engine [/C][/ROW]
[ROW][C]Computing time[/C][C]3 seconds[/C][/ROW]
[ROW][C]R Server[/C][C]'Gwilym Jenkins' @ 72.249.127.135[/C][/ROW]
[/TABLE]
Source: https://freestatistics.org/blog/index.php?pk=58243&T=0

Globally Unique Identifier (entire table): ba.freestatistics.org/blog/index.php?pk=58243&T=0

As an alternative you can also use a QR Code:  

The GUIDs for individual cells are displayed in the table below:

Summary of computational transaction
Raw Inputview raw input (R code)
Raw Outputview raw output of R engine
Computing time3 seconds
R Server'Gwilym Jenkins' @ 72.249.127.135


Multiple Linear Regression - Estimated Regression Equation
Yt[t] = + 17424.9461206477 -0.0769106839892755`Yt-1`[t] + 0.289791286320848`Yt-2`[t] -0.229658583665953`Yt-3`[t] -0.248195965086348`Yt-4`[t] -482.673839824678M1[t] + 682.241579160312M2[t] -52.7929730074228M3[t] + 704.745486669194M4[t] + 478.005060254843M5[t] -46.9907665014013M6[t] + 655.375475998909M7[t] + 604.825547340014M8[t] -1081.26087721467M9[t] + 581.745707803682M10[t] + 738.588003595692M11[t] -155.411865696257t + e[t]

\begin{tabular}{lllllllll}
\hline
Multiple Linear Regression - Estimated Regression Equation \tabularnewline
Yt[t] =  +  17424.9461206477 -0.0769106839892755`Yt-1`[t] +  0.289791286320848`Yt-2`[t] -0.229658583665953`Yt-3`[t] -0.248195965086348`Yt-4`[t] -482.673839824678M1[t] +  682.241579160312M2[t] -52.7929730074228M3[t] +  704.745486669194M4[t] +  478.005060254843M5[t] -46.9907665014013M6[t] +  655.375475998909M7[t] +  604.825547340014M8[t] -1081.26087721467M9[t] +  581.745707803682M10[t] +  738.588003595692M11[t] -155.411865696257t  + e[t] \tabularnewline
\hline
\end{tabular}
%Source: https://freestatistics.org/blog/index.php?pk=58243&T=1

[TABLE]
[ROW][C]Multiple Linear Regression - Estimated Regression Equation[/C][/ROW]
[ROW][C]Yt[t] =  +  17424.9461206477 -0.0769106839892755`Yt-1`[t] +  0.289791286320848`Yt-2`[t] -0.229658583665953`Yt-3`[t] -0.248195965086348`Yt-4`[t] -482.673839824678M1[t] +  682.241579160312M2[t] -52.7929730074228M3[t] +  704.745486669194M4[t] +  478.005060254843M5[t] -46.9907665014013M6[t] +  655.375475998909M7[t] +  604.825547340014M8[t] -1081.26087721467M9[t] +  581.745707803682M10[t] +  738.588003595692M11[t] -155.411865696257t  + e[t][/C][/ROW]
[/TABLE]
Source: https://freestatistics.org/blog/index.php?pk=58243&T=1

Globally Unique Identifier (entire table): ba.freestatistics.org/blog/index.php?pk=58243&T=1

As an alternative you can also use a QR Code:  

The GUIDs for individual cells are displayed in the table below:

Multiple Linear Regression - Estimated Regression Equation
Yt[t] = + 17424.9461206477 -0.0769106839892755`Yt-1`[t] + 0.289791286320848`Yt-2`[t] -0.229658583665953`Yt-3`[t] -0.248195965086348`Yt-4`[t] -482.673839824678M1[t] + 682.241579160312M2[t] -52.7929730074228M3[t] + 704.745486669194M4[t] + 478.005060254843M5[t] -46.9907665014013M6[t] + 655.375475998909M7[t] + 604.825547340014M8[t] -1081.26087721467M9[t] + 581.745707803682M10[t] + 738.588003595692M11[t] -155.411865696257t + e[t]


Multiple Linear Regression - Ordinary Least Squares
VariableParameterS.D.T-STATH0: parameter = 02-tail p-value1-tail p-value
(Intercept)17424.94612064774246.5864024.10330.0002011e-04
`Yt-1`-0.07691068398927550.15908-0.48350.6314640.315732
`Yt-2`0.2897912863208480.157531.83960.0734480.036724
`Yt-3`-0.2296585836659530.153446-1.49670.1425290.071264
`Yt-4`-0.2481959650863480.154441-1.60710.116110.058055
M1-482.6738398246781029.309839-0.46890.6417310.320865
M2682.2415791603121012.5249680.67380.5044110.252206
M3-52.79297300742281017.625576-0.05190.958890.479445
M4704.7454866691941009.2091350.69830.4891240.244562
M5478.0050602548431029.1948850.46440.6449110.322455
M6-46.99076650140131006.65-0.04670.9630060.481503
M7655.3754759989091037.0915210.63190.5311160.265558
M8604.8255473400141024.9842160.59010.5585390.279269
M9-1081.260877214671068.706898-1.01170.3178950.158948
M10581.7457078036821106.0054170.5260.6018750.300937
M11738.5880035956921086.0667720.68010.5004850.250243
t-155.41186569625739.28188-3.95630.0003120.000156

\begin{tabular}{lllllllll}
\hline
Multiple Linear Regression - Ordinary Least Squares \tabularnewline
Variable & Parameter & S.D. & T-STATH0: parameter = 0 & 2-tail p-value & 1-tail p-value \tabularnewline
(Intercept) & 17424.9461206477 & 4246.586402 & 4.1033 & 0.000201 & 1e-04 \tabularnewline
`Yt-1` & -0.0769106839892755 & 0.15908 & -0.4835 & 0.631464 & 0.315732 \tabularnewline
`Yt-2` & 0.289791286320848 & 0.15753 & 1.8396 & 0.073448 & 0.036724 \tabularnewline
`Yt-3` & -0.229658583665953 & 0.153446 & -1.4967 & 0.142529 & 0.071264 \tabularnewline
`Yt-4` & -0.248195965086348 & 0.154441 & -1.6071 & 0.11611 & 0.058055 \tabularnewline
M1 & -482.673839824678 & 1029.309839 & -0.4689 & 0.641731 & 0.320865 \tabularnewline
M2 & 682.241579160312 & 1012.524968 & 0.6738 & 0.504411 & 0.252206 \tabularnewline
M3 & -52.7929730074228 & 1017.625576 & -0.0519 & 0.95889 & 0.479445 \tabularnewline
M4 & 704.745486669194 & 1009.209135 & 0.6983 & 0.489124 & 0.244562 \tabularnewline
M5 & 478.005060254843 & 1029.194885 & 0.4644 & 0.644911 & 0.322455 \tabularnewline
M6 & -46.9907665014013 & 1006.65 & -0.0467 & 0.963006 & 0.481503 \tabularnewline
M7 & 655.375475998909 & 1037.091521 & 0.6319 & 0.531116 & 0.265558 \tabularnewline
M8 & 604.825547340014 & 1024.984216 & 0.5901 & 0.558539 & 0.279269 \tabularnewline
M9 & -1081.26087721467 & 1068.706898 & -1.0117 & 0.317895 & 0.158948 \tabularnewline
M10 & 581.745707803682 & 1106.005417 & 0.526 & 0.601875 & 0.300937 \tabularnewline
M11 & 738.588003595692 & 1086.066772 & 0.6801 & 0.500485 & 0.250243 \tabularnewline
t & -155.411865696257 & 39.28188 & -3.9563 & 0.000312 & 0.000156 \tabularnewline
\hline
\end{tabular}
%Source: https://freestatistics.org/blog/index.php?pk=58243&T=2

[TABLE]
[ROW][C]Multiple Linear Regression - Ordinary Least Squares[/C][/ROW]
[ROW][C]Variable[/C][C]Parameter[/C][C]S.D.[/C][C]T-STATH0: parameter = 0[/C][C]2-tail p-value[/C][C]1-tail p-value[/C][/ROW]
[ROW][C](Intercept)[/C][C]17424.9461206477[/C][C]4246.586402[/C][C]4.1033[/C][C]0.000201[/C][C]1e-04[/C][/ROW]
[ROW][C]`Yt-1`[/C][C]-0.0769106839892755[/C][C]0.15908[/C][C]-0.4835[/C][C]0.631464[/C][C]0.315732[/C][/ROW]
[ROW][C]`Yt-2`[/C][C]0.289791286320848[/C][C]0.15753[/C][C]1.8396[/C][C]0.073448[/C][C]0.036724[/C][/ROW]
[ROW][C]`Yt-3`[/C][C]-0.229658583665953[/C][C]0.153446[/C][C]-1.4967[/C][C]0.142529[/C][C]0.071264[/C][/ROW]
[ROW][C]`Yt-4`[/C][C]-0.248195965086348[/C][C]0.154441[/C][C]-1.6071[/C][C]0.11611[/C][C]0.058055[/C][/ROW]
[ROW][C]M1[/C][C]-482.673839824678[/C][C]1029.309839[/C][C]-0.4689[/C][C]0.641731[/C][C]0.320865[/C][/ROW]
[ROW][C]M2[/C][C]682.241579160312[/C][C]1012.524968[/C][C]0.6738[/C][C]0.504411[/C][C]0.252206[/C][/ROW]
[ROW][C]M3[/C][C]-52.7929730074228[/C][C]1017.625576[/C][C]-0.0519[/C][C]0.95889[/C][C]0.479445[/C][/ROW]
[ROW][C]M4[/C][C]704.745486669194[/C][C]1009.209135[/C][C]0.6983[/C][C]0.489124[/C][C]0.244562[/C][/ROW]
[ROW][C]M5[/C][C]478.005060254843[/C][C]1029.194885[/C][C]0.4644[/C][C]0.644911[/C][C]0.322455[/C][/ROW]
[ROW][C]M6[/C][C]-46.9907665014013[/C][C]1006.65[/C][C]-0.0467[/C][C]0.963006[/C][C]0.481503[/C][/ROW]
[ROW][C]M7[/C][C]655.375475998909[/C][C]1037.091521[/C][C]0.6319[/C][C]0.531116[/C][C]0.265558[/C][/ROW]
[ROW][C]M8[/C][C]604.825547340014[/C][C]1024.984216[/C][C]0.5901[/C][C]0.558539[/C][C]0.279269[/C][/ROW]
[ROW][C]M9[/C][C]-1081.26087721467[/C][C]1068.706898[/C][C]-1.0117[/C][C]0.317895[/C][C]0.158948[/C][/ROW]
[ROW][C]M10[/C][C]581.745707803682[/C][C]1106.005417[/C][C]0.526[/C][C]0.601875[/C][C]0.300937[/C][/ROW]
[ROW][C]M11[/C][C]738.588003595692[/C][C]1086.066772[/C][C]0.6801[/C][C]0.500485[/C][C]0.250243[/C][/ROW]
[ROW][C]t[/C][C]-155.411865696257[/C][C]39.28188[/C][C]-3.9563[/C][C]0.000312[/C][C]0.000156[/C][/ROW]
[/TABLE]
Source: https://freestatistics.org/blog/index.php?pk=58243&T=2

Globally Unique Identifier (entire table): ba.freestatistics.org/blog/index.php?pk=58243&T=2

As an alternative you can also use a QR Code:  

The GUIDs for individual cells are displayed in the table below:

Multiple Linear Regression - Ordinary Least Squares
VariableParameterS.D.T-STATH0: parameter = 02-tail p-value1-tail p-value
(Intercept)17424.94612064774246.5864024.10330.0002011e-04
`Yt-1`-0.07691068398927550.15908-0.48350.6314640.315732
`Yt-2`0.2897912863208480.157531.83960.0734480.036724
`Yt-3`-0.2296585836659530.153446-1.49670.1425290.071264
`Yt-4`-0.2481959650863480.154441-1.60710.116110.058055
M1-482.6738398246781029.309839-0.46890.6417310.320865
M2682.2415791603121012.5249680.67380.5044110.252206
M3-52.79297300742281017.625576-0.05190.958890.479445
M4704.7454866691941009.2091350.69830.4891240.244562
M5478.0050602548431029.1948850.46440.6449110.322455
M6-46.99076650140131006.65-0.04670.9630060.481503
M7655.3754759989091037.0915210.63190.5311160.265558
M8604.8255473400141024.9842160.59010.5585390.279269
M9-1081.260877214671068.706898-1.01170.3178950.158948
M10581.7457078036821106.0054170.5260.6018750.300937
M11738.5880035956921086.0667720.68010.5004850.250243
t-155.41186569625739.28188-3.95630.0003120.000156


Multiple Linear Regression - Regression Statistics
Multiple R0.866131590033882
R-squared0.75018393125462
Adjusted R-squared0.647695287666772
F-TEST (value)7.31967860040609
F-TEST (DF numerator)16
F-TEST (DF denominator)39
p-value2.06504179978140e-07
Multiple Linear Regression - Residual Statistics
Residual Standard Deviation1472.27954328209
Sum Squared Residuals84536675.0891104

\begin{tabular}{lllllllll}
\hline
Multiple Linear Regression - Regression Statistics \tabularnewline
Multiple R & 0.866131590033882 \tabularnewline
R-squared & 0.75018393125462 \tabularnewline
Adjusted R-squared & 0.647695287666772 \tabularnewline
F-TEST (value) & 7.31967860040609 \tabularnewline
F-TEST (DF numerator) & 16 \tabularnewline
F-TEST (DF denominator) & 39 \tabularnewline
p-value & 2.06504179978140e-07 \tabularnewline
Multiple Linear Regression - Residual Statistics \tabularnewline
Residual Standard Deviation & 1472.27954328209 \tabularnewline
Sum Squared Residuals & 84536675.0891104 \tabularnewline
\hline
\end{tabular}
%Source: https://freestatistics.org/blog/index.php?pk=58243&T=3

[TABLE]
[ROW][C]Multiple Linear Regression - Regression Statistics[/C][/ROW]
[ROW][C]Multiple R[/C][C]0.866131590033882[/C][/ROW]
[ROW][C]R-squared[/C][C]0.75018393125462[/C][/ROW]
[ROW][C]Adjusted R-squared[/C][C]0.647695287666772[/C][/ROW]
[ROW][C]F-TEST (value)[/C][C]7.31967860040609[/C][/ROW]
[ROW][C]F-TEST (DF numerator)[/C][C]16[/C][/ROW]
[ROW][C]F-TEST (DF denominator)[/C][C]39[/C][/ROW]
[ROW][C]p-value[/C][C]2.06504179978140e-07[/C][/ROW]
[ROW][C]Multiple Linear Regression - Residual Statistics[/C][/ROW]
[ROW][C]Residual Standard Deviation[/C][C]1472.27954328209[/C][/ROW]
[ROW][C]Sum Squared Residuals[/C][C]84536675.0891104[/C][/ROW]
[/TABLE]
Source: https://freestatistics.org/blog/index.php?pk=58243&T=3

Globally Unique Identifier (entire table): ba.freestatistics.org/blog/index.php?pk=58243&T=3

As an alternative you can also use a QR Code:  

The GUIDs for individual cells are displayed in the table below:

Multiple Linear Regression - Regression Statistics
Multiple R0.866131590033882
R-squared0.75018393125462
Adjusted R-squared0.647695287666772
F-TEST (value)7.31967860040609
F-TEST (DF numerator)16
F-TEST (DF denominator)39
p-value2.06504179978140e-07
Multiple Linear Regression - Residual Statistics
Residual Standard Deviation1472.27954328209
Sum Squared Residuals84536675.0891104


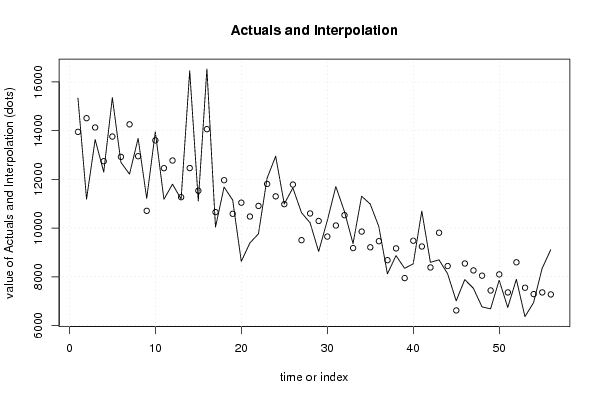
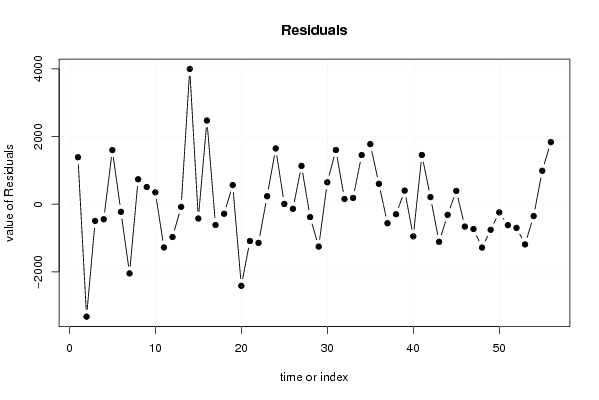
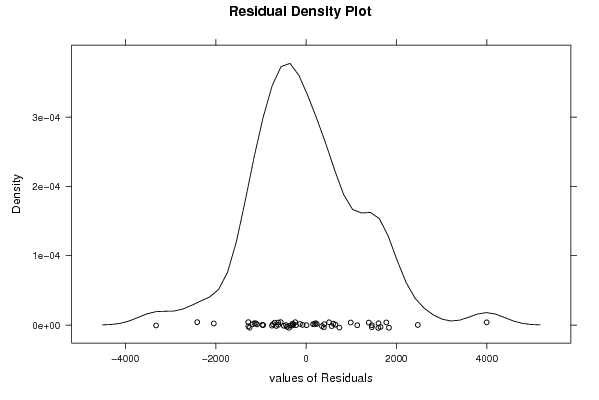
Multiple Linear Regression - Actuals, Interpolation, and Residuals
Time or IndexActualsInterpolationForecastResidualsPrediction Error
115335.6363613947.78871231811387.84764768191
211188.514509.2671097938-3320.7671097938
313633.2514126.9903575724-493.740357572352
412298.4666712743.4322415577-444.965571557676
515353.6363613755.02729311601598.60906688404
612696.1538512920.6805207395-224.526670739477
712213.9333314257.1526128946-2043.21928289462
813683.7272712947.8053465242735.921923475761
911214.1428610705.5537738950508.589086104975
1013950.2307713599.3419137661350.888856233935
1111179.1333312456.8083012018-1277.67497120176
1211801.87512771.1941987747-969.319198774715
1311188.8235311266.7479256135-77.9243956134569
1416456.2727312461.18713026263995.08559973738
1511110.062511532.7178510228-422.655351022818
1616530.6923114058.71657237012471.97573762993
1710038.4117610652.8167728662-614.405012866218
1811681.2511963.0295351384-281.77953513844
1911148.8823510584.2394103273564.642939672658
20863111040.9320916604-2409.93209166037
219386.44444410472.8762823912-1086.43183839125
229764.73684210907.2258658294-1142.48902382937
2312043.7511808.8675830287234.882416971303
2412948.0666711300.6470323411647.41963765900
2510987.12510979.07150860248.0534913975518
2611648.312511784.1699372059-135.857437205851
2710633.352949501.281371710241132.07156828976
2810219.310598.9749137253-379.67491372535
299037.610289.3917054579-1251.79170545792
3010296.315799648.8705395503647.445250449693
3111705.4117610103.56954023301601.84221976705
3210681.9444410528.1518962732153.792543726773
339362.9473689177.93119771314185.016170286857
3411306.352949854.359807864391451.99313213561
3510984.459209.40384896691775.04615103311
3610062.619059460.28321415828602.335835841715
378118.5833338680.86147054834-562.278137548336
388867.489164.32591554183-296.84591554183
398346.727944.51813291235402.201867087648
408529.3076929478.97967478225-949.671982782253
4110697.181829242.384001215231454.79781878477
428591.848381.8798219205209.960178079504
438695.6071439806.3062103056-1110.69906730559
448125.5714298439.06546961245-313.494040612452
457009.7586216616.93203900059392.826581999415
467883.4666678543.85963154018-660.392964540184
477527.6451618259.89875780266-732.253596802657
486763.7586218044.194895726-1280.43627472600
496682.3333337438.03193891767-755.698605917668
507855.6818188097.29695519589-241.615137195890
516738.887356.75772678224-617.877726782237
527895.4347838593.09805256466-697.663269564656
536361.8846157549.09478234467-1187.21016734467
546935.9565227287.05574465128-351.099222651279
558344.4545457357.0213542395987.433190760505
569107.9444447274.232778929711833.71166507029

\begin{tabular}{lllllllll}
\hline
Multiple Linear Regression - Actuals, Interpolation, and Residuals \tabularnewline
Time or Index & Actuals & InterpolationForecast & ResidualsPrediction Error \tabularnewline
1 & 15335.63636 & 13947.7887123181 & 1387.84764768191 \tabularnewline
2 & 11188.5 & 14509.2671097938 & -3320.7671097938 \tabularnewline
3 & 13633.25 & 14126.9903575724 & -493.740357572352 \tabularnewline
4 & 12298.46667 & 12743.4322415577 & -444.965571557676 \tabularnewline
5 & 15353.63636 & 13755.0272931160 & 1598.60906688404 \tabularnewline
6 & 12696.15385 & 12920.6805207395 & -224.526670739477 \tabularnewline
7 & 12213.93333 & 14257.1526128946 & -2043.21928289462 \tabularnewline
8 & 13683.72727 & 12947.8053465242 & 735.921923475761 \tabularnewline
9 & 11214.14286 & 10705.5537738950 & 508.589086104975 \tabularnewline
10 & 13950.23077 & 13599.3419137661 & 350.888856233935 \tabularnewline
11 & 11179.13333 & 12456.8083012018 & -1277.67497120176 \tabularnewline
12 & 11801.875 & 12771.1941987747 & -969.319198774715 \tabularnewline
13 & 11188.82353 & 11266.7479256135 & -77.9243956134569 \tabularnewline
14 & 16456.27273 & 12461.1871302626 & 3995.08559973738 \tabularnewline
15 & 11110.0625 & 11532.7178510228 & -422.655351022818 \tabularnewline
16 & 16530.69231 & 14058.7165723701 & 2471.97573762993 \tabularnewline
17 & 10038.41176 & 10652.8167728662 & -614.405012866218 \tabularnewline
18 & 11681.25 & 11963.0295351384 & -281.77953513844 \tabularnewline
19 & 11148.88235 & 10584.2394103273 & 564.642939672658 \tabularnewline
20 & 8631 & 11040.9320916604 & -2409.93209166037 \tabularnewline
21 & 9386.444444 & 10472.8762823912 & -1086.43183839125 \tabularnewline
22 & 9764.736842 & 10907.2258658294 & -1142.48902382937 \tabularnewline
23 & 12043.75 & 11808.8675830287 & 234.882416971303 \tabularnewline
24 & 12948.06667 & 11300.647032341 & 1647.41963765900 \tabularnewline
25 & 10987.125 & 10979.0715086024 & 8.0534913975518 \tabularnewline
26 & 11648.3125 & 11784.1699372059 & -135.857437205851 \tabularnewline
27 & 10633.35294 & 9501.28137171024 & 1132.07156828976 \tabularnewline
28 & 10219.3 & 10598.9749137253 & -379.67491372535 \tabularnewline
29 & 9037.6 & 10289.3917054579 & -1251.79170545792 \tabularnewline
30 & 10296.31579 & 9648.8705395503 & 647.445250449693 \tabularnewline
31 & 11705.41176 & 10103.5695402330 & 1601.84221976705 \tabularnewline
32 & 10681.94444 & 10528.1518962732 & 153.792543726773 \tabularnewline
33 & 9362.947368 & 9177.93119771314 & 185.016170286857 \tabularnewline
34 & 11306.35294 & 9854.35980786439 & 1451.99313213561 \tabularnewline
35 & 10984.45 & 9209.4038489669 & 1775.04615103311 \tabularnewline
36 & 10062.61905 & 9460.28321415828 & 602.335835841715 \tabularnewline
37 & 8118.583333 & 8680.86147054834 & -562.278137548336 \tabularnewline
38 & 8867.48 & 9164.32591554183 & -296.84591554183 \tabularnewline
39 & 8346.72 & 7944.51813291235 & 402.201867087648 \tabularnewline
40 & 8529.307692 & 9478.97967478225 & -949.671982782253 \tabularnewline
41 & 10697.18182 & 9242.38400121523 & 1454.79781878477 \tabularnewline
42 & 8591.84 & 8381.8798219205 & 209.960178079504 \tabularnewline
43 & 8695.607143 & 9806.3062103056 & -1110.69906730559 \tabularnewline
44 & 8125.571429 & 8439.06546961245 & -313.494040612452 \tabularnewline
45 & 7009.758621 & 6616.93203900059 & 392.826581999415 \tabularnewline
46 & 7883.466667 & 8543.85963154018 & -660.392964540184 \tabularnewline
47 & 7527.645161 & 8259.89875780266 & -732.253596802657 \tabularnewline
48 & 6763.758621 & 8044.194895726 & -1280.43627472600 \tabularnewline
49 & 6682.333333 & 7438.03193891767 & -755.698605917668 \tabularnewline
50 & 7855.681818 & 8097.29695519589 & -241.615137195890 \tabularnewline
51 & 6738.88 & 7356.75772678224 & -617.877726782237 \tabularnewline
52 & 7895.434783 & 8593.09805256466 & -697.663269564656 \tabularnewline
53 & 6361.884615 & 7549.09478234467 & -1187.21016734467 \tabularnewline
54 & 6935.956522 & 7287.05574465128 & -351.099222651279 \tabularnewline
55 & 8344.454545 & 7357.0213542395 & 987.433190760505 \tabularnewline
56 & 9107.944444 & 7274.23277892971 & 1833.71166507029 \tabularnewline
\hline
\end{tabular}
%Source: https://freestatistics.org/blog/index.php?pk=58243&T=4

[TABLE]
[ROW][C]Multiple Linear Regression - Actuals, Interpolation, and Residuals[/C][/ROW]
[ROW][C]Time or Index[/C][C]Actuals[/C][C]InterpolationForecast[/C][C]ResidualsPrediction Error[/C][/ROW]
[ROW][C]1[/C][C]15335.63636[/C][C]13947.7887123181[/C][C]1387.84764768191[/C][/ROW]
[ROW][C]2[/C][C]11188.5[/C][C]14509.2671097938[/C][C]-3320.7671097938[/C][/ROW]
[ROW][C]3[/C][C]13633.25[/C][C]14126.9903575724[/C][C]-493.740357572352[/C][/ROW]
[ROW][C]4[/C][C]12298.46667[/C][C]12743.4322415577[/C][C]-444.965571557676[/C][/ROW]
[ROW][C]5[/C][C]15353.63636[/C][C]13755.0272931160[/C][C]1598.60906688404[/C][/ROW]
[ROW][C]6[/C][C]12696.15385[/C][C]12920.6805207395[/C][C]-224.526670739477[/C][/ROW]
[ROW][C]7[/C][C]12213.93333[/C][C]14257.1526128946[/C][C]-2043.21928289462[/C][/ROW]
[ROW][C]8[/C][C]13683.72727[/C][C]12947.8053465242[/C][C]735.921923475761[/C][/ROW]
[ROW][C]9[/C][C]11214.14286[/C][C]10705.5537738950[/C][C]508.589086104975[/C][/ROW]
[ROW][C]10[/C][C]13950.23077[/C][C]13599.3419137661[/C][C]350.888856233935[/C][/ROW]
[ROW][C]11[/C][C]11179.13333[/C][C]12456.8083012018[/C][C]-1277.67497120176[/C][/ROW]
[ROW][C]12[/C][C]11801.875[/C][C]12771.1941987747[/C][C]-969.319198774715[/C][/ROW]
[ROW][C]13[/C][C]11188.82353[/C][C]11266.7479256135[/C][C]-77.9243956134569[/C][/ROW]
[ROW][C]14[/C][C]16456.27273[/C][C]12461.1871302626[/C][C]3995.08559973738[/C][/ROW]
[ROW][C]15[/C][C]11110.0625[/C][C]11532.7178510228[/C][C]-422.655351022818[/C][/ROW]
[ROW][C]16[/C][C]16530.69231[/C][C]14058.7165723701[/C][C]2471.97573762993[/C][/ROW]
[ROW][C]17[/C][C]10038.41176[/C][C]10652.8167728662[/C][C]-614.405012866218[/C][/ROW]
[ROW][C]18[/C][C]11681.25[/C][C]11963.0295351384[/C][C]-281.77953513844[/C][/ROW]
[ROW][C]19[/C][C]11148.88235[/C][C]10584.2394103273[/C][C]564.642939672658[/C][/ROW]
[ROW][C]20[/C][C]8631[/C][C]11040.9320916604[/C][C]-2409.93209166037[/C][/ROW]
[ROW][C]21[/C][C]9386.444444[/C][C]10472.8762823912[/C][C]-1086.43183839125[/C][/ROW]
[ROW][C]22[/C][C]9764.736842[/C][C]10907.2258658294[/C][C]-1142.48902382937[/C][/ROW]
[ROW][C]23[/C][C]12043.75[/C][C]11808.8675830287[/C][C]234.882416971303[/C][/ROW]
[ROW][C]24[/C][C]12948.06667[/C][C]11300.647032341[/C][C]1647.41963765900[/C][/ROW]
[ROW][C]25[/C][C]10987.125[/C][C]10979.0715086024[/C][C]8.0534913975518[/C][/ROW]
[ROW][C]26[/C][C]11648.3125[/C][C]11784.1699372059[/C][C]-135.857437205851[/C][/ROW]
[ROW][C]27[/C][C]10633.35294[/C][C]9501.28137171024[/C][C]1132.07156828976[/C][/ROW]
[ROW][C]28[/C][C]10219.3[/C][C]10598.9749137253[/C][C]-379.67491372535[/C][/ROW]
[ROW][C]29[/C][C]9037.6[/C][C]10289.3917054579[/C][C]-1251.79170545792[/C][/ROW]
[ROW][C]30[/C][C]10296.31579[/C][C]9648.8705395503[/C][C]647.445250449693[/C][/ROW]
[ROW][C]31[/C][C]11705.41176[/C][C]10103.5695402330[/C][C]1601.84221976705[/C][/ROW]
[ROW][C]32[/C][C]10681.94444[/C][C]10528.1518962732[/C][C]153.792543726773[/C][/ROW]
[ROW][C]33[/C][C]9362.947368[/C][C]9177.93119771314[/C][C]185.016170286857[/C][/ROW]
[ROW][C]34[/C][C]11306.35294[/C][C]9854.35980786439[/C][C]1451.99313213561[/C][/ROW]
[ROW][C]35[/C][C]10984.45[/C][C]9209.4038489669[/C][C]1775.04615103311[/C][/ROW]
[ROW][C]36[/C][C]10062.61905[/C][C]9460.28321415828[/C][C]602.335835841715[/C][/ROW]
[ROW][C]37[/C][C]8118.583333[/C][C]8680.86147054834[/C][C]-562.278137548336[/C][/ROW]
[ROW][C]38[/C][C]8867.48[/C][C]9164.32591554183[/C][C]-296.84591554183[/C][/ROW]
[ROW][C]39[/C][C]8346.72[/C][C]7944.51813291235[/C][C]402.201867087648[/C][/ROW]
[ROW][C]40[/C][C]8529.307692[/C][C]9478.97967478225[/C][C]-949.671982782253[/C][/ROW]
[ROW][C]41[/C][C]10697.18182[/C][C]9242.38400121523[/C][C]1454.79781878477[/C][/ROW]
[ROW][C]42[/C][C]8591.84[/C][C]8381.8798219205[/C][C]209.960178079504[/C][/ROW]
[ROW][C]43[/C][C]8695.607143[/C][C]9806.3062103056[/C][C]-1110.69906730559[/C][/ROW]
[ROW][C]44[/C][C]8125.571429[/C][C]8439.06546961245[/C][C]-313.494040612452[/C][/ROW]
[ROW][C]45[/C][C]7009.758621[/C][C]6616.93203900059[/C][C]392.826581999415[/C][/ROW]
[ROW][C]46[/C][C]7883.466667[/C][C]8543.85963154018[/C][C]-660.392964540184[/C][/ROW]
[ROW][C]47[/C][C]7527.645161[/C][C]8259.89875780266[/C][C]-732.253596802657[/C][/ROW]
[ROW][C]48[/C][C]6763.758621[/C][C]8044.194895726[/C][C]-1280.43627472600[/C][/ROW]
[ROW][C]49[/C][C]6682.333333[/C][C]7438.03193891767[/C][C]-755.698605917668[/C][/ROW]
[ROW][C]50[/C][C]7855.681818[/C][C]8097.29695519589[/C][C]-241.615137195890[/C][/ROW]
[ROW][C]51[/C][C]6738.88[/C][C]7356.75772678224[/C][C]-617.877726782237[/C][/ROW]
[ROW][C]52[/C][C]7895.434783[/C][C]8593.09805256466[/C][C]-697.663269564656[/C][/ROW]
[ROW][C]53[/C][C]6361.884615[/C][C]7549.09478234467[/C][C]-1187.21016734467[/C][/ROW]
[ROW][C]54[/C][C]6935.956522[/C][C]7287.05574465128[/C][C]-351.099222651279[/C][/ROW]
[ROW][C]55[/C][C]8344.454545[/C][C]7357.0213542395[/C][C]987.433190760505[/C][/ROW]
[ROW][C]56[/C][C]9107.944444[/C][C]7274.23277892971[/C][C]1833.71166507029[/C][/ROW]
[/TABLE]
Source: https://freestatistics.org/blog/index.php?pk=58243&T=4

Globally Unique Identifier (entire table): ba.freestatistics.org/blog/index.php?pk=58243&T=4

As an alternative you can also use a QR Code:  

The GUIDs for individual cells are displayed in the table below:

Multiple Linear Regression - Actuals, Interpolation, and Residuals
Time or IndexActualsInterpolationForecastResidualsPrediction Error
115335.6363613947.78871231811387.84764768191
211188.514509.2671097938-3320.7671097938
313633.2514126.9903575724-493.740357572352
412298.4666712743.4322415577-444.965571557676
515353.6363613755.02729311601598.60906688404
612696.1538512920.6805207395-224.526670739477
712213.9333314257.1526128946-2043.21928289462
813683.7272712947.8053465242735.921923475761
911214.1428610705.5537738950508.589086104975
1013950.2307713599.3419137661350.888856233935
1111179.1333312456.8083012018-1277.67497120176
1211801.87512771.1941987747-969.319198774715
1311188.8235311266.7479256135-77.9243956134569
1416456.2727312461.18713026263995.08559973738
1511110.062511532.7178510228-422.655351022818
1616530.6923114058.71657237012471.97573762993
1710038.4117610652.8167728662-614.405012866218
1811681.2511963.0295351384-281.77953513844
1911148.8823510584.2394103273564.642939672658
20863111040.9320916604-2409.93209166037
219386.44444410472.8762823912-1086.43183839125
229764.73684210907.2258658294-1142.48902382937
2312043.7511808.8675830287234.882416971303
2412948.0666711300.6470323411647.41963765900
2510987.12510979.07150860248.0534913975518
2611648.312511784.1699372059-135.857437205851
2710633.352949501.281371710241132.07156828976
2810219.310598.9749137253-379.67491372535
299037.610289.3917054579-1251.79170545792
3010296.315799648.8705395503647.445250449693
3111705.4117610103.56954023301601.84221976705
3210681.9444410528.1518962732153.792543726773
339362.9473689177.93119771314185.016170286857
3411306.352949854.359807864391451.99313213561
3510984.459209.40384896691775.04615103311
3610062.619059460.28321415828602.335835841715
378118.5833338680.86147054834-562.278137548336
388867.489164.32591554183-296.84591554183
398346.727944.51813291235402.201867087648
408529.3076929478.97967478225-949.671982782253
4110697.181829242.384001215231454.79781878477
428591.848381.8798219205209.960178079504
438695.6071439806.3062103056-1110.69906730559
448125.5714298439.06546961245-313.494040612452
457009.7586216616.93203900059392.826581999415
467883.4666678543.85963154018-660.392964540184
477527.6451618259.89875780266-732.253596802657
486763.7586218044.194895726-1280.43627472600
496682.3333337438.03193891767-755.698605917668
507855.6818188097.29695519589-241.615137195890
516738.887356.75772678224-617.877726782237
527895.4347838593.09805256466-697.663269564656
536361.8846157549.09478234467-1187.21016734467
546935.9565227287.05574465128-351.099222651279
558344.4545457357.0213542395987.433190760505
569107.9444447274.232778929711833.71166507029


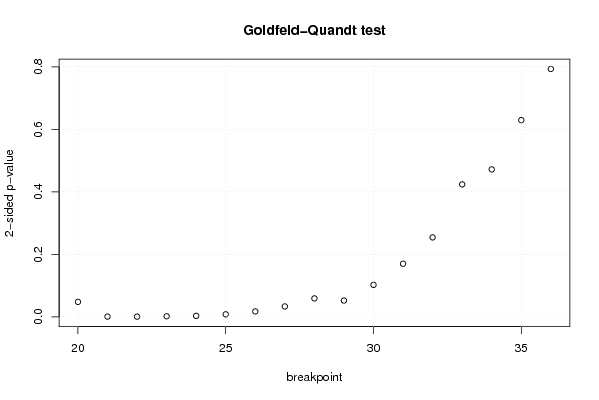
Goldfeld-Quandt test for Heteroskedasticity
p-valuesAlternative Hypothesis
breakpoint indexgreater2-sidedless
200.976128784289260.04774243142147790.0238712157107390
210.9996209033675330.0007581932649340880.000379096632467044
220.9997377896507860.0005244206984275470.000262210349213774
230.999159829282480.001680341435039550.000840170717519775
240.9984729409663780.003054118067244050.00152705903362203
250.996044984852830.00791003029433980.0039550151471699
260.9913367823436260.01732643531274790.00866321765637397
270.9833905713126520.03321885737469520.0166094286873476
280.970572542115880.05885491576824040.0294274578841202
290.9739595121242250.05208097575154990.0260404878757749
300.9488957578022780.1022084843954450.0511042421977225
310.9150547026551650.1698905946896700.0849452973448348
320.872947803814960.2541043923700810.127052196185040
330.7881298863280930.4237402273438130.211870113671907
340.7642061982615040.4715876034769920.235793801738496
350.6853562441090530.6292875117818940.314643755890947
360.6034963697936140.7930072604127730.396503630206386

\begin{tabular}{lllllllll}
\hline
Goldfeld-Quandt test for Heteroskedasticity \tabularnewline
p-values & Alternative Hypothesis \tabularnewline
breakpoint index & greater & 2-sided & less \tabularnewline
20 & 0.97612878428926 & 0.0477424314214779 & 0.0238712157107390 \tabularnewline
21 & 0.999620903367533 & 0.000758193264934088 & 0.000379096632467044 \tabularnewline
22 & 0.999737789650786 & 0.000524420698427547 & 0.000262210349213774 \tabularnewline
23 & 0.99915982928248 & 0.00168034143503955 & 0.000840170717519775 \tabularnewline
24 & 0.998472940966378 & 0.00305411806724405 & 0.00152705903362203 \tabularnewline
25 & 0.99604498485283 & 0.0079100302943398 & 0.0039550151471699 \tabularnewline
26 & 0.991336782343626 & 0.0173264353127479 & 0.00866321765637397 \tabularnewline
27 & 0.983390571312652 & 0.0332188573746952 & 0.0166094286873476 \tabularnewline
28 & 0.97057254211588 & 0.0588549157682404 & 0.0294274578841202 \tabularnewline
29 & 0.973959512124225 & 0.0520809757515499 & 0.0260404878757749 \tabularnewline
30 & 0.948895757802278 & 0.102208484395445 & 0.0511042421977225 \tabularnewline
31 & 0.915054702655165 & 0.169890594689670 & 0.0849452973448348 \tabularnewline
32 & 0.87294780381496 & 0.254104392370081 & 0.127052196185040 \tabularnewline
33 & 0.788129886328093 & 0.423740227343813 & 0.211870113671907 \tabularnewline
34 & 0.764206198261504 & 0.471587603476992 & 0.235793801738496 \tabularnewline
35 & 0.685356244109053 & 0.629287511781894 & 0.314643755890947 \tabularnewline
36 & 0.603496369793614 & 0.793007260412773 & 0.396503630206386 \tabularnewline
\hline
\end{tabular}
%Source: https://freestatistics.org/blog/index.php?pk=58243&T=5

[TABLE]
[ROW][C]Goldfeld-Quandt test for Heteroskedasticity[/C][/ROW]
[ROW][C]p-values[/C][C]Alternative Hypothesis[/C][/ROW]
[ROW][C]breakpoint index[/C][C]greater[/C][C]2-sided[/C][C]less[/C][/ROW]
[ROW][C]20[/C][C]0.97612878428926[/C][C]0.0477424314214779[/C][C]0.0238712157107390[/C][/ROW]
[ROW][C]21[/C][C]0.999620903367533[/C][C]0.000758193264934088[/C][C]0.000379096632467044[/C][/ROW]
[ROW][C]22[/C][C]0.999737789650786[/C][C]0.000524420698427547[/C][C]0.000262210349213774[/C][/ROW]
[ROW][C]23[/C][C]0.99915982928248[/C][C]0.00168034143503955[/C][C]0.000840170717519775[/C][/ROW]
[ROW][C]24[/C][C]0.998472940966378[/C][C]0.00305411806724405[/C][C]0.00152705903362203[/C][/ROW]
[ROW][C]25[/C][C]0.99604498485283[/C][C]0.0079100302943398[/C][C]0.0039550151471699[/C][/ROW]
[ROW][C]26[/C][C]0.991336782343626[/C][C]0.0173264353127479[/C][C]0.00866321765637397[/C][/ROW]
[ROW][C]27[/C][C]0.983390571312652[/C][C]0.0332188573746952[/C][C]0.0166094286873476[/C][/ROW]
[ROW][C]28[/C][C]0.97057254211588[/C][C]0.0588549157682404[/C][C]0.0294274578841202[/C][/ROW]
[ROW][C]29[/C][C]0.973959512124225[/C][C]0.0520809757515499[/C][C]0.0260404878757749[/C][/ROW]
[ROW][C]30[/C][C]0.948895757802278[/C][C]0.102208484395445[/C][C]0.0511042421977225[/C][/ROW]
[ROW][C]31[/C][C]0.915054702655165[/C][C]0.169890594689670[/C][C]0.0849452973448348[/C][/ROW]
[ROW][C]32[/C][C]0.87294780381496[/C][C]0.254104392370081[/C][C]0.127052196185040[/C][/ROW]
[ROW][C]33[/C][C]0.788129886328093[/C][C]0.423740227343813[/C][C]0.211870113671907[/C][/ROW]
[ROW][C]34[/C][C]0.764206198261504[/C][C]0.471587603476992[/C][C]0.235793801738496[/C][/ROW]
[ROW][C]35[/C][C]0.685356244109053[/C][C]0.629287511781894[/C][C]0.314643755890947[/C][/ROW]
[ROW][C]36[/C][C]0.603496369793614[/C][C]0.793007260412773[/C][C]0.396503630206386[/C][/ROW]
[/TABLE]
Source: https://freestatistics.org/blog/index.php?pk=58243&T=5

Globally Unique Identifier (entire table): ba.freestatistics.org/blog/index.php?pk=58243&T=5

As an alternative you can also use a QR Code:  

The GUIDs for individual cells are displayed in the table below:

Goldfeld-Quandt test for Heteroskedasticity
p-valuesAlternative Hypothesis
breakpoint indexgreater2-sidedless
200.976128784289260.04774243142147790.0238712157107390
210.9996209033675330.0007581932649340880.000379096632467044
220.9997377896507860.0005244206984275470.000262210349213774
230.999159829282480.001680341435039550.000840170717519775
240.9984729409663780.003054118067244050.00152705903362203
250.996044984852830.00791003029433980.0039550151471699
260.9913367823436260.01732643531274790.00866321765637397
270.9833905713126520.03321885737469520.0166094286873476
280.970572542115880.05885491576824040.0294274578841202
290.9739595121242250.05208097575154990.0260404878757749
300.9488957578022780.1022084843954450.0511042421977225
310.9150547026551650.1698905946896700.0849452973448348
320.872947803814960.2541043923700810.127052196185040
330.7881298863280930.4237402273438130.211870113671907
340.7642061982615040.4715876034769920.235793801738496
350.6853562441090530.6292875117818940.314643755890947
360.6034963697936140.7930072604127730.396503630206386


Meta Analysis of Goldfeld-Quandt test for Heteroskedasticity
Description# significant tests% significant testsOK/NOK
1% type I error level50.294117647058824NOK
5% type I error level80.470588235294118NOK
10% type I error level100.588235294117647NOK

\begin{tabular}{lllllllll}
\hline
Meta Analysis of Goldfeld-Quandt test for Heteroskedasticity \tabularnewline
Description & # significant tests & % significant tests & OK/NOK \tabularnewline
1% type I error level & 5 & 0.294117647058824 & NOK \tabularnewline
5% type I error level & 8 & 0.470588235294118 & NOK \tabularnewline
10% type I error level & 10 & 0.588235294117647 & NOK \tabularnewline
\hline
\end{tabular}
%Source: https://freestatistics.org/blog/index.php?pk=58243&T=6

[TABLE]
[ROW][C]Meta Analysis of Goldfeld-Quandt test for Heteroskedasticity[/C][/ROW]
[ROW][C]Description[/C][C]# significant tests[/C][C]% significant tests[/C][C]OK/NOK[/C][/ROW]
[ROW][C]1% type I error level[/C][C]5[/C][C]0.294117647058824[/C][C]NOK[/C][/ROW]
[ROW][C]5% type I error level[/C][C]8[/C][C]0.470588235294118[/C][C]NOK[/C][/ROW]
[ROW][C]10% type I error level[/C][C]10[/C][C]0.588235294117647[/C][C]NOK[/C][/ROW]
[/TABLE]
Source: https://freestatistics.org/blog/index.php?pk=58243&T=6

Globally Unique Identifier (entire table): ba.freestatistics.org/blog/index.php?pk=58243&T=6

As an alternative you can also use a QR Code:  

The GUIDs for individual cells are displayed in the table below:

Meta Analysis of Goldfeld-Quandt test for Heteroskedasticity
Description# significant tests% significant testsOK/NOK
1% type I error level50.294117647058824NOK
5% type I error level80.470588235294118NOK
10% type I error level100.588235294117647NOK


Parameters (Session):
par1 = 1 ; par2 = Include Monthly Dummies ; par3 = Linear Trend ;
Parameters (R input):
par1 = 1 ; par2 = Include Monthly Dummies ; par3 = Linear Trend ;
R code (references can be found in the software module):
library(lattice)
library(lmtest)
n25 <- 25 #minimum number of obs. for Goldfeld-Quandt test
par1 <- as.numeric(par1)
x <- t(y)
k <- length(x[1,])
n <- length(x[,1])
x1 <- cbind(x[,par1], x[,1:k!=par1])
mycolnames <- c(colnames(x)[par1], colnames(x)[1:k!=par1])
colnames(x1) <- mycolnames #colnames(x)[par1]
x <- x1
if (par3 == 'First Differences'){
x2 <- array(0, dim=c(n-1,k), dimnames=list(1:(n-1), paste('(1-B)',colnames(x),sep='')))
for (i in 1:n-1) {
for (j in 1:k) {
x2[i,j] <- x[i+1,j] - x[i,j]
}
}
x <- x2
}
if (par2 == 'Include Monthly Dummies'){
x2 <- array(0, dim=c(n,11), dimnames=list(1:n, paste('M', seq(1:11), sep ='')))
for (i in 1:11){
x2[seq(i,n,12),i] <- 1
}
x <- cbind(x, x2)
}
if (par2 == 'Include Quarterly Dummies'){
x2 <- array(0, dim=c(n,3), dimnames=list(1:n, paste('Q', seq(1:3), sep ='')))
for (i in 1:3){
x2[seq(i,n,4),i] <- 1
}
x <- cbind(x, x2)
}
k <- length(x[1,])
if (par3 == 'Linear Trend'){
x <- cbind(x, c(1:n))
colnames(x)[k+1] <- 't'
}
x
k <- length(x[1,])
df <- as.data.frame(x)
(mylm <- lm(df))
(mysum <- summary(mylm))
if (n > n25) {
kp3 <- k + 3
nmkm3 <- n - k - 3
gqarr <- array(NA, dim=c(nmkm3-kp3+1,3))
numgqtests <- 0
numsignificant1 <- 0
numsignificant5 <- 0
numsignificant10 <- 0
for (mypoint in kp3:nmkm3) {
j <- 0
numgqtests <- numgqtests + 1
for (myalt in c('greater', 'two.sided', 'less')) {
j <- j + 1
gqarr[mypoint-kp3+1,j] <- gqtest(mylm, point=mypoint, alternative=myalt)$p.value
}
if (gqarr[mypoint-kp3+1,2] < 0.01) numsignificant1 <- numsignificant1 + 1
if (gqarr[mypoint-kp3+1,2] < 0.05) numsignificant5 <- numsignificant5 + 1
if (gqarr[mypoint-kp3+1,2] < 0.10) numsignificant10 <- numsignificant10 + 1
}
gqarr
}
bitmap(file='test0.png')
plot(x[,1], type='l', main='Actuals and Interpolation', ylab='value of Actuals and Interpolation (dots)', xlab='time or index')
points(x[,1]-mysum$resid)
grid()
dev.off()
bitmap(file='test1.png')
plot(mysum$resid, type='b', pch=19, main='Residuals', ylab='value of Residuals', xlab='time or index')
grid()
dev.off()
bitmap(file='test2.png')
hist(mysum$resid, main='Residual Histogram', xlab='values of Residuals')
grid()
dev.off()
bitmap(file='test3.png')
densityplot(~mysum$resid,col='black',main='Residual Density Plot', xlab='values of Residuals')
dev.off()
bitmap(file='test4.png')
qqnorm(mysum$resid, main='Residual Normal Q-Q Plot')
qqline(mysum$resid)
grid()
dev.off()
(myerror <- as.ts(mysum$resid))
bitmap(file='test5.png')
dum <- cbind(lag(myerror,k=1),myerror)
dum
dum1 <- dum[2:length(myerror),]
dum1
z <- as.data.frame(dum1)
z
plot(z,main=paste('Residual Lag plot, lowess, and regression line'), ylab='values of Residuals', xlab='lagged values of Residuals')
lines(lowess(z))
abline(lm(z))
grid()
dev.off()
bitmap(file='test6.png')
acf(mysum$resid, lag.max=length(mysum$resid)/2, main='Residual Autocorrelation Function')
grid()
dev.off()
bitmap(file='test7.png')
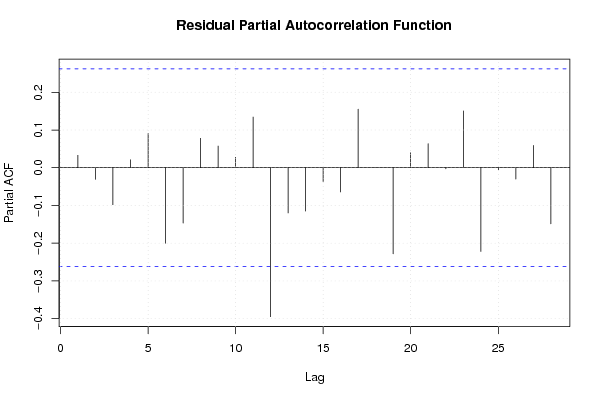
pacf(mysum$resid, lag.max=length(mysum$resid)/2, main='Residual Partial Autocorrelation Function')
grid()
dev.off()
bitmap(file='test8.png')
opar <- par(mfrow = c(2,2), oma = c(0, 0, 1.1, 0))
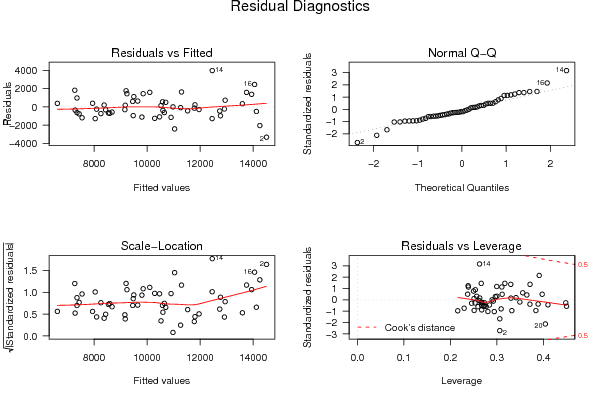
plot(mylm, las = 1, sub='Residual Diagnostics')
par(opar)
dev.off()
if (n > n25) {
bitmap(file='test9.png')
plot(kp3:nmkm3,gqarr[,2], main='Goldfeld-Quandt test',ylab='2-sided p-value',xlab='breakpoint')
grid()
dev.off()
}
load(file='createtable')
a<-table.start()
a<-table.row.start(a)
a<-table.element(a, 'Multiple Linear Regression - Estimated Regression Equation', 1, TRUE)
a<-table.row.end(a)
myeq <- colnames(x)[1]
myeq <- paste(myeq, '[t] = ', sep='')
for (i in 1:k){
if (mysum$coefficients[i,1] > 0) myeq <- paste(myeq, '+', '')
myeq <- paste(myeq, mysum$coefficients[i,1], sep=' ')
if (rownames(mysum$coefficients)[i] != '(Intercept)') {
myeq <- paste(myeq, rownames(mysum$coefficients)[i], sep='')
if (rownames(mysum$coefficients)[i] != 't') myeq <- paste(myeq, '[t]', sep='')
}
}
myeq <- paste(myeq, ' + e[t]')
a<-table.row.start(a)
a<-table.element(a, myeq)
a<-table.row.end(a)
a<-table.end(a)
table.save(a,file='mytable1.tab')
a<-table.start()
a<-table.row.start(a)
a<-table.element(a,hyperlink('ols1.htm','Multiple Linear Regression - Ordinary Least Squares',''), 6, TRUE)
a<-table.row.end(a)
a<-table.row.start(a)
a<-table.element(a,'Variable',header=TRUE)
a<-table.element(a,'Parameter',header=TRUE)
a<-table.element(a,'S.D.',header=TRUE)
a<-table.element(a,'T-STAT
H0: parameter = 0',header=TRUE)
a<-table.element(a,'2-tail p-value',header=TRUE)
a<-table.element(a,'1-tail p-value',header=TRUE)
a<-table.row.end(a)
for (i in 1:k){
a<-table.row.start(a)
a<-table.element(a,rownames(mysum$coefficients)[i],header=TRUE)
a<-table.element(a,mysum$coefficients[i,1])
a<-table.element(a, round(mysum$coefficients[i,2],6))
a<-table.element(a, round(mysum$coefficients[i,3],4))
a<-table.element(a, round(mysum$coefficients[i,4],6))
a<-table.element(a, round(mysum$coefficients[i,4]/2,6))
a<-table.row.end(a)
}
a<-table.end(a)
table.save(a,file='mytable2.tab')
a<-table.start()
a<-table.row.start(a)
a<-table.element(a, 'Multiple Linear Regression - Regression Statistics', 2, TRUE)
a<-table.row.end(a)
a<-table.row.start(a)
a<-table.element(a, 'Multiple R',1,TRUE)
a<-table.element(a, sqrt(mysum$r.squared))
a<-table.row.end(a)
a<-table.row.start(a)
a<-table.element(a, 'R-squared',1,TRUE)
a<-table.element(a, mysum$r.squared)
a<-table.row.end(a)
a<-table.row.start(a)
a<-table.element(a, 'Adjusted R-squared',1,TRUE)
a<-table.element(a, mysum$adj.r.squared)
a<-table.row.end(a)
a<-table.row.start(a)
a<-table.element(a, 'F-TEST (value)',1,TRUE)
a<-table.element(a, mysum$fstatistic[1])
a<-table.row.end(a)
a<-table.row.start(a)
a<-table.element(a, 'F-TEST (DF numerator)',1,TRUE)
a<-table.element(a, mysum$fstatistic[2])
a<-table.row.end(a)
a<-table.row.start(a)
a<-table.element(a, 'F-TEST (DF denominator)',1,TRUE)
a<-table.element(a, mysum$fstatistic[3])
a<-table.row.end(a)
a<-table.row.start(a)
a<-table.element(a, 'p-value',1,TRUE)
a<-table.element(a, 1-pf(mysum$fstatistic[1],mysum$fstatistic[2],mysum$fstatistic[3]))
a<-table.row.end(a)
a<-table.row.start(a)
a<-table.element(a, 'Multiple Linear Regression - Residual Statistics', 2, TRUE)
a<-table.row.end(a)
a<-table.row.start(a)
a<-table.element(a, 'Residual Standard Deviation',1,TRUE)
a<-table.element(a, mysum$sigma)
a<-table.row.end(a)
a<-table.row.start(a)
a<-table.element(a, 'Sum Squared Residuals',1,TRUE)
a<-table.element(a, sum(myerror*myerror))
a<-table.row.end(a)
a<-table.end(a)
table.save(a,file='mytable3.tab')
a<-table.start()
a<-table.row.start(a)
a<-table.element(a, 'Multiple Linear Regression - Actuals, Interpolation, and Residuals', 4, TRUE)
a<-table.row.end(a)
a<-table.row.start(a)
a<-table.element(a, 'Time or Index', 1, TRUE)
a<-table.element(a, 'Actuals', 1, TRUE)
a<-table.element(a, 'Interpolation
Forecast', 1, TRUE)
a<-table.element(a, 'Residuals
Prediction Error', 1, TRUE)
a<-table.row.end(a)
for (i in 1:n) {
a<-table.row.start(a)
a<-table.element(a,i, 1, TRUE)
a<-table.element(a,x[i])
a<-table.element(a,x[i]-mysum$resid[i])
a<-table.element(a,mysum$resid[i])
a<-table.row.end(a)
}
a<-table.end(a)
table.save(a,file='mytable4.tab')
if (n > n25) {
a<-table.start()
a<-table.row.start(a)
a<-table.element(a,'Goldfeld-Quandt test for Heteroskedasticity',4,TRUE)
a<-table.row.end(a)
a<-table.row.start(a)
a<-table.element(a,'p-values',header=TRUE)
a<-table.element(a,'Alternative Hypothesis',3,header=TRUE)
a<-table.row.end(a)
a<-table.row.start(a)
a<-table.element(a,'breakpoint index',header=TRUE)
a<-table.element(a,'greater',header=TRUE)
a<-table.element(a,'2-sided',header=TRUE)
a<-table.element(a,'less',header=TRUE)
a<-table.row.end(a)
for (mypoint in kp3:nmkm3) {
a<-table.row.start(a)
a<-table.element(a,mypoint,header=TRUE)
a<-table.element(a,gqarr[mypoint-kp3+1,1])
a<-table.element(a,gqarr[mypoint-kp3+1,2])
a<-table.element(a,gqarr[mypoint-kp3+1,3])
a<-table.row.end(a)
}
a<-table.end(a)
table.save(a,file='mytable5.tab')
a<-table.start()
a<-table.row.start(a)
a<-table.element(a,'Meta Analysis of Goldfeld-Quandt test for Heteroskedasticity',4,TRUE)
a<-table.row.end(a)
a<-table.row.start(a)
a<-table.element(a,'Description',header=TRUE)
a<-table.element(a,'# significant tests',header=TRUE)
a<-table.element(a,'% significant tests',header=TRUE)
a<-table.element(a,'OK/NOK',header=TRUE)
a<-table.row.end(a)
a<-table.row.start(a)
a<-table.element(a,'1% type I error level',header=TRUE)
a<-table.element(a,numsignificant1)
a<-table.element(a,numsignificant1/numgqtests)
if (numsignificant1/numgqtests < 0.01) dum <- 'OK' else dum <- 'NOK'
a<-table.element(a,dum)
a<-table.row.end(a)
a<-table.row.start(a)
a<-table.element(a,'5% type I error level',header=TRUE)
a<-table.element(a,numsignificant5)
a<-table.element(a,numsignificant5/numgqtests)
if (numsignificant5/numgqtests < 0.05) dum <- 'OK' else dum <- 'NOK'
a<-table.element(a,dum)
a<-table.row.end(a)
a<-table.row.start(a)
a<-table.element(a,'10% type I error level',header=TRUE)
a<-table.element(a,numsignificant10)
a<-table.element(a,numsignificant10/numgqtests)
if (numsignificant10/numgqtests < 0.1) dum <- 'OK' else dum <- 'NOK'
a<-table.element(a,dum)
a<-table.row.end(a)
a<-table.end(a)
table.save(a,file='mytable6.tab')
}