Free Statistics

of Irreproducible Research!

Author's title

Author*The author of this computation has been verified*
R Software Modulerwasp_multipleregression.wasp
Title produced by softwareMultiple Regression
Date of computationFri, 20 Nov 2009 07:57:35 -0700
Cite this page as followsStatistical Computations at FreeStatistics.org, Office for Research Development and Education, URL https://freestatistics.org/blog/index.php?v=date/2009/Nov/20/t12587291590yogt3yo5c3onfe.htm/, Retrieved Sat, 20 Apr 2024 10:29:25 +0000
Statistical Computations at FreeStatistics.org, Office for Research Development and Education, URL https://freestatistics.org/blog/index.php?pk=58240, Retrieved Sat, 20 Apr 2024 10:29:25 +0000
QR Codes:

Original text written by user:
IsPrivate?No (this computation is public)
User-defined keywordsmodel 3
Estimated Impact115
Family? (F = Feedback message, R = changed R code, M = changed R Module, P = changed Parameters, D = changed Data)
-     [Multiple Regression] [Q1 The Seatbeltlaw] [2007-11-14 19:27:43] [8cd6641b921d30ebe00b648d1481bba0]
- RM D  [Multiple Regression] [Seatbelt] [2009-11-12 14:06:21] [b98453cac15ba1066b407e146608df68]
-    D      [Multiple Regression] [Workshop 3] [2009-11-20 14:57:35] [0852d9c28828e87a0aee4d255e088d63] [Current]
Feedback Forum

Post a new message
Dataseries X:
108.2	108.5
108.8	112.3
110.2	116.6
109.5	115.5
109.5	120.1
116	132.9
111.2	128.1
112.1	129.3
114	132.5
119.1	131
114.1	124.9
115.1	120.8
115.4	122
110.8	122.1
116	127.4
119.2	135.2
126.5	137.3
127.8	135
131.3	136
140.3	138.4
137.3	134.7
143	138.4
134.5	133.9
139.9	133.6
159.3	141.2
170.4	151.8
175	155.4
175.8	156.6
180.9	161.6
180.3	160.7
169.6	156
172.3	159.5
184.8	168.7
177.7	169.9
184.6	169.9
211.4	185.9
215.3	190.8
215.9	195.8
244.7	211.9
259.3	227.1
289	251.3
310.9	256.7
321	251.9
315.1	251.2
333.2	270.3
314.1	267.2
284.7	243
273.9	229.9
216	187.2
196.4	178.2
190.9	175.2
206.4	192.4
196.3	187
199.5	184
198.9	194.1
214.4	212.7
214.2	217.5
187.6	200.5
180.6	205.9
172.2	196.5


Summary of computational transaction
Raw Inputview raw input (R code)
Raw Outputview raw output of R engine
Computing time3 seconds
R Server'Gwilym Jenkins' @ 72.249.127.135

\begin{tabular}{lllllllll}
\hline
Summary of computational transaction \tabularnewline
Raw Input & view raw input (R code)  \tabularnewline
Raw Output & view raw output of R engine  \tabularnewline
Computing time & 3 seconds \tabularnewline
R Server & 'Gwilym Jenkins' @ 72.249.127.135 \tabularnewline
\hline
\end{tabular}
%Source: https://freestatistics.org/blog/index.php?pk=58240&T=0

[TABLE]
[ROW][C]Summary of computational transaction[/C][/ROW]
[ROW][C]Raw Input[/C][C]view raw input (R code) [/C][/ROW]
[ROW][C]Raw Output[/C][C]view raw output of R engine [/C][/ROW]
[ROW][C]Computing time[/C][C]3 seconds[/C][/ROW]
[ROW][C]R Server[/C][C]'Gwilym Jenkins' @ 72.249.127.135[/C][/ROW]
[/TABLE]
Source: https://freestatistics.org/blog/index.php?pk=58240&T=0

Globally Unique Identifier (entire table): ba.freestatistics.org/blog/index.php?pk=58240&T=0

As an alternative you can also use a QR Code:  

The GUIDs for individual cells are displayed in the table below:

Summary of computational transaction
Raw Inputview raw input (R code)
Raw Outputview raw output of R engine
Computing time3 seconds
R Server'Gwilym Jenkins' @ 72.249.127.135


Multiple Linear Regression - Estimated Regression Equation
Y[t] = -73.1510170709155 + 1.59969233247625X[t] + 11.1606847397861M1[t] + 6.0224322816004M2[t] + 5.10915205278968M3[t] -0.50326670695449M4[t] -3.26028849504525M5[t] -0.0384486529738717M6[t] + 1.08645587982531M7[t] -1.87090434254156M8[t] -5.83979691027234M9[t] -8.29572307978729M10[t] -6.8884307248126M11[t] -0.601101440014372t + e[t]

\begin{tabular}{lllllllll}
\hline
Multiple Linear Regression - Estimated Regression Equation \tabularnewline
Y[t] =  -73.1510170709155 +  1.59969233247625X[t] +  11.1606847397861M1[t] +  6.0224322816004M2[t] +  5.10915205278968M3[t] -0.50326670695449M4[t] -3.26028849504525M5[t] -0.0384486529738717M6[t] +  1.08645587982531M7[t] -1.87090434254156M8[t] -5.83979691027234M9[t] -8.29572307978729M10[t] -6.8884307248126M11[t] -0.601101440014372t  + e[t] \tabularnewline
\hline
\end{tabular}
%Source: https://freestatistics.org/blog/index.php?pk=58240&T=1

[TABLE]
[ROW][C]Multiple Linear Regression - Estimated Regression Equation[/C][/ROW]
[ROW][C]Y[t] =  -73.1510170709155 +  1.59969233247625X[t] +  11.1606847397861M1[t] +  6.0224322816004M2[t] +  5.10915205278968M3[t] -0.50326670695449M4[t] -3.26028849504525M5[t] -0.0384486529738717M6[t] +  1.08645587982531M7[t] -1.87090434254156M8[t] -5.83979691027234M9[t] -8.29572307978729M10[t] -6.8884307248126M11[t] -0.601101440014372t  + e[t][/C][/ROW]
[/TABLE]
Source: https://freestatistics.org/blog/index.php?pk=58240&T=1

Globally Unique Identifier (entire table): ba.freestatistics.org/blog/index.php?pk=58240&T=1

As an alternative you can also use a QR Code:  

The GUIDs for individual cells are displayed in the table below:

Multiple Linear Regression - Estimated Regression Equation
Y[t] = -73.1510170709155 + 1.59969233247625X[t] + 11.1606847397861M1[t] + 6.0224322816004M2[t] + 5.10915205278968M3[t] -0.50326670695449M4[t] -3.26028849504525M5[t] -0.0384486529738717M6[t] + 1.08645587982531M7[t] -1.87090434254156M8[t] -5.83979691027234M9[t] -8.29572307978729M10[t] -6.8884307248126M11[t] -0.601101440014372t + e[t]


Multiple Linear Regression - Ordinary Least Squares
VariableParameterS.D.T-STATH0: parameter = 02-tail p-value1-tail p-value
(Intercept)-73.151017070915510.228513-7.151700
X1.599692332476250.0722222.150200
M111.16068473978618.8920781.25510.2157720.107886
M26.02243228160048.8787780.67830.5009830.250491
M35.109152052789688.8684850.57610.5673540.283677
M4-0.503266706954498.877189-0.05670.9550360.477518
M5-3.260288495045258.892682-0.36660.7155790.35779
M6-0.03844865297387178.88698-0.00430.9965670.498283
M71.086455879825318.8616710.12260.9029570.451478
M8-1.870904342541568.876112-0.21080.833990.416995
M9-5.839796910272348.911837-0.65530.5155480.257774
M10-8.295723079787298.861467-0.93620.3540810.177041
M11-6.88843072481268.821069-0.78090.4388580.219429
t-0.6011014400143720.182858-3.28730.0019430.000971

\begin{tabular}{lllllllll}
\hline
Multiple Linear Regression - Ordinary Least Squares \tabularnewline
Variable & Parameter & S.D. & T-STATH0: parameter = 0 & 2-tail p-value & 1-tail p-value \tabularnewline
(Intercept) & -73.1510170709155 & 10.228513 & -7.1517 & 0 & 0 \tabularnewline
X & 1.59969233247625 & 0.07222 & 22.1502 & 0 & 0 \tabularnewline
M1 & 11.1606847397861 & 8.892078 & 1.2551 & 0.215772 & 0.107886 \tabularnewline
M2 & 6.0224322816004 & 8.878778 & 0.6783 & 0.500983 & 0.250491 \tabularnewline
M3 & 5.10915205278968 & 8.868485 & 0.5761 & 0.567354 & 0.283677 \tabularnewline
M4 & -0.50326670695449 & 8.877189 & -0.0567 & 0.955036 & 0.477518 \tabularnewline
M5 & -3.26028849504525 & 8.892682 & -0.3666 & 0.715579 & 0.35779 \tabularnewline
M6 & -0.0384486529738717 & 8.88698 & -0.0043 & 0.996567 & 0.498283 \tabularnewline
M7 & 1.08645587982531 & 8.861671 & 0.1226 & 0.902957 & 0.451478 \tabularnewline
M8 & -1.87090434254156 & 8.876112 & -0.2108 & 0.83399 & 0.416995 \tabularnewline
M9 & -5.83979691027234 & 8.911837 & -0.6553 & 0.515548 & 0.257774 \tabularnewline
M10 & -8.29572307978729 & 8.861467 & -0.9362 & 0.354081 & 0.177041 \tabularnewline
M11 & -6.8884307248126 & 8.821069 & -0.7809 & 0.438858 & 0.219429 \tabularnewline
t & -0.601101440014372 & 0.182858 & -3.2873 & 0.001943 & 0.000971 \tabularnewline
\hline
\end{tabular}
%Source: https://freestatistics.org/blog/index.php?pk=58240&T=2

[TABLE]
[ROW][C]Multiple Linear Regression - Ordinary Least Squares[/C][/ROW]
[ROW][C]Variable[/C][C]Parameter[/C][C]S.D.[/C][C]T-STATH0: parameter = 0[/C][C]2-tail p-value[/C][C]1-tail p-value[/C][/ROW]
[ROW][C](Intercept)[/C][C]-73.1510170709155[/C][C]10.228513[/C][C]-7.1517[/C][C]0[/C][C]0[/C][/ROW]
[ROW][C]X[/C][C]1.59969233247625[/C][C]0.07222[/C][C]22.1502[/C][C]0[/C][C]0[/C][/ROW]
[ROW][C]M1[/C][C]11.1606847397861[/C][C]8.892078[/C][C]1.2551[/C][C]0.215772[/C][C]0.107886[/C][/ROW]
[ROW][C]M2[/C][C]6.0224322816004[/C][C]8.878778[/C][C]0.6783[/C][C]0.500983[/C][C]0.250491[/C][/ROW]
[ROW][C]M3[/C][C]5.10915205278968[/C][C]8.868485[/C][C]0.5761[/C][C]0.567354[/C][C]0.283677[/C][/ROW]
[ROW][C]M4[/C][C]-0.50326670695449[/C][C]8.877189[/C][C]-0.0567[/C][C]0.955036[/C][C]0.477518[/C][/ROW]
[ROW][C]M5[/C][C]-3.26028849504525[/C][C]8.892682[/C][C]-0.3666[/C][C]0.715579[/C][C]0.35779[/C][/ROW]
[ROW][C]M6[/C][C]-0.0384486529738717[/C][C]8.88698[/C][C]-0.0043[/C][C]0.996567[/C][C]0.498283[/C][/ROW]
[ROW][C]M7[/C][C]1.08645587982531[/C][C]8.861671[/C][C]0.1226[/C][C]0.902957[/C][C]0.451478[/C][/ROW]
[ROW][C]M8[/C][C]-1.87090434254156[/C][C]8.876112[/C][C]-0.2108[/C][C]0.83399[/C][C]0.416995[/C][/ROW]
[ROW][C]M9[/C][C]-5.83979691027234[/C][C]8.911837[/C][C]-0.6553[/C][C]0.515548[/C][C]0.257774[/C][/ROW]
[ROW][C]M10[/C][C]-8.29572307978729[/C][C]8.861467[/C][C]-0.9362[/C][C]0.354081[/C][C]0.177041[/C][/ROW]
[ROW][C]M11[/C][C]-6.8884307248126[/C][C]8.821069[/C][C]-0.7809[/C][C]0.438858[/C][C]0.219429[/C][/ROW]
[ROW][C]t[/C][C]-0.601101440014372[/C][C]0.182858[/C][C]-3.2873[/C][C]0.001943[/C][C]0.000971[/C][/ROW]
[/TABLE]
Source: https://freestatistics.org/blog/index.php?pk=58240&T=2

Globally Unique Identifier (entire table): ba.freestatistics.org/blog/index.php?pk=58240&T=2

As an alternative you can also use a QR Code:  

The GUIDs for individual cells are displayed in the table below:

Multiple Linear Regression - Ordinary Least Squares
VariableParameterS.D.T-STATH0: parameter = 02-tail p-value1-tail p-value
(Intercept)-73.151017070915510.228513-7.151700
X1.599692332476250.0722222.150200
M111.16068473978618.8920781.25510.2157720.107886
M26.02243228160048.8787780.67830.5009830.250491
M35.109152052789688.8684850.57610.5673540.283677
M4-0.503266706954498.877189-0.05670.9550360.477518
M5-3.260288495045258.892682-0.36660.7155790.35779
M6-0.03844865297387178.88698-0.00430.9965670.498283
M71.086455879825318.8616710.12260.9029570.451478
M8-1.870904342541568.876112-0.21080.833990.416995
M9-5.839796910272348.911837-0.65530.5155480.257774
M10-8.295723079787298.861467-0.93620.3540810.177041
M11-6.88843072481268.821069-0.78090.4388580.219429
t-0.6011014400143720.182858-3.28730.0019430.000971


Multiple Linear Regression - Regression Statistics
Multiple R0.98098756551415
R-squared0.96233660369338
Adjusted R-squared0.951692600389335
F-TEST (value)90.4111522896355
F-TEST (DF numerator)13
F-TEST (DF denominator)46
p-value0
Multiple Linear Regression - Residual Statistics
Residual Standard Deviation13.9379095736167
Sum Squared Residuals8936.20487098658

\begin{tabular}{lllllllll}
\hline
Multiple Linear Regression - Regression Statistics \tabularnewline
Multiple R & 0.98098756551415 \tabularnewline
R-squared & 0.96233660369338 \tabularnewline
Adjusted R-squared & 0.951692600389335 \tabularnewline
F-TEST (value) & 90.4111522896355 \tabularnewline
F-TEST (DF numerator) & 13 \tabularnewline
F-TEST (DF denominator) & 46 \tabularnewline
p-value & 0 \tabularnewline
Multiple Linear Regression - Residual Statistics \tabularnewline
Residual Standard Deviation & 13.9379095736167 \tabularnewline
Sum Squared Residuals & 8936.20487098658 \tabularnewline
\hline
\end{tabular}
%Source: https://freestatistics.org/blog/index.php?pk=58240&T=3

[TABLE]
[ROW][C]Multiple Linear Regression - Regression Statistics[/C][/ROW]
[ROW][C]Multiple R[/C][C]0.98098756551415[/C][/ROW]
[ROW][C]R-squared[/C][C]0.96233660369338[/C][/ROW]
[ROW][C]Adjusted R-squared[/C][C]0.951692600389335[/C][/ROW]
[ROW][C]F-TEST (value)[/C][C]90.4111522896355[/C][/ROW]
[ROW][C]F-TEST (DF numerator)[/C][C]13[/C][/ROW]
[ROW][C]F-TEST (DF denominator)[/C][C]46[/C][/ROW]
[ROW][C]p-value[/C][C]0[/C][/ROW]
[ROW][C]Multiple Linear Regression - Residual Statistics[/C][/ROW]
[ROW][C]Residual Standard Deviation[/C][C]13.9379095736167[/C][/ROW]
[ROW][C]Sum Squared Residuals[/C][C]8936.20487098658[/C][/ROW]
[/TABLE]
Source: https://freestatistics.org/blog/index.php?pk=58240&T=3

Globally Unique Identifier (entire table): ba.freestatistics.org/blog/index.php?pk=58240&T=3

As an alternative you can also use a QR Code:  

The GUIDs for individual cells are displayed in the table below:

Multiple Linear Regression - Regression Statistics
Multiple R0.98098756551415
R-squared0.96233660369338
Adjusted R-squared0.951692600389335
F-TEST (value)90.4111522896355
F-TEST (DF numerator)13
F-TEST (DF denominator)46
p-value0
Multiple Linear Regression - Residual Statistics
Residual Standard Deviation13.9379095736167
Sum Squared Residuals8936.20487098658


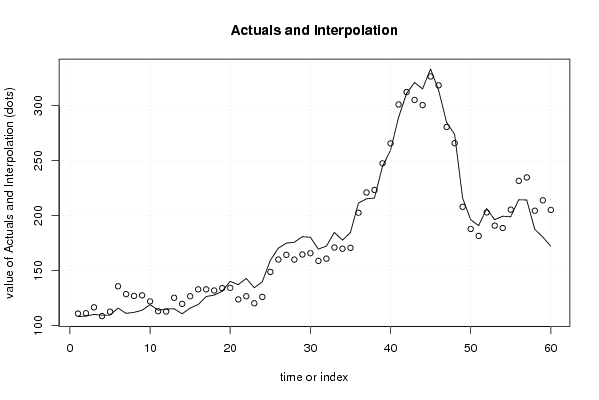
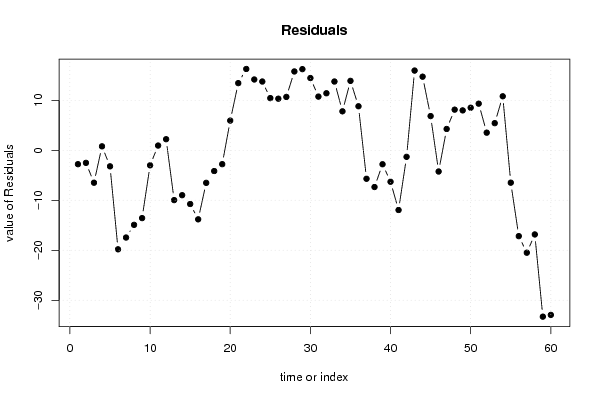
Multiple Linear Regression - Actuals, Interpolation, and Residuals
Time or IndexActualsInterpolationForecastResidualsPrediction Error
1108.2110.975184302529-2.77518430252921
2108.8111.314661267739-2.51466126773874
3110.2116.678956628562-6.47895662856164
4109.5108.7057748630790.794225136920803
5109.5112.706236364365-3.20623636436480
6116135.803036622118-19.8030366221178
7111.2128.648316519017-17.4483165190166
8112.1127.009485655607-14.9094856556069
9114127.558507111786-13.5585071117857
10119.1122.101941003542-3.00194100354202
11114.1113.1500086903970.94999130960277
12115.1112.8785994120432.22140058795716
13115.4125.357813510786-9.95781351078607
14110.8119.778428845834-8.9784288458336
15116126.742416539133-10.7424165391326
16119.2133.006496532689-13.8064965326888
17126.5133.007727202784-6.50772720278385
18127.8131.949173240145-4.14917324014544
19131.3134.072668665406-2.7726686654065
20140.3134.3534686009685.94653139903174
21137.3123.86461296306113.4353870369390
22143126.72644698369416.2735530163062
23134.5120.33402240251114.165977597489
24139.9126.14144398756613.7585560124337
25159.3148.85868901415810.4413109858424
26170.4160.07607384020610.3239261597943
27175164.32058456829510.6794154317049
28175.8160.02669516750815.7733048324919
29180.9164.66703360178416.2329663982158
30180.3165.84804890461314.4519510953875
31169.6158.85329803475910.746701965241
32172.3160.89375953604511.4062404639554
33184.8171.04093498708113.7590650129191
34177.7169.9035381765237.79646182347684
35184.6170.70972909148313.8902709085165
36211.4202.5921356959028.80786430409833
37215.3220.990211424807-5.69021142480705
38215.9223.249319188988-7.34931918898821
39244.7247.489984073031-2.78998407303071
40259.3265.591787326911-6.29178732691112
41289300.946218544731-11.9462185447312
42310.9312.20529554216-1.30529554215997
43321305.05057543905915.9494245609412
44315.1300.37232914394414.7276708560559
45333.2326.3564586864956.84354131350461
46314.1318.340384846290-4.24038484628962
47284.7280.4340213153254.26597868467522
48273.9265.7653810446848.13461895531582
49216208.018101747727.98189825227993
50196.4187.8815168572348.51848314276628
51190.9181.568058190989.33194180902012
52206.4202.8692461098133.53075389018716
53196.3190.8727842863365.42721571366405
54199.5188.69444569096410.8055543090358
55198.9205.375141341759-6.47514134175912
56214.4231.570957063436-17.1709570634361
57214.2234.679486251577-20.4794862515770
58187.6204.427688989951-16.8276889899514
59180.6213.872218500284-33.2722185002835
60172.2205.122439859805-32.922439859805

\begin{tabular}{lllllllll}
\hline
Multiple Linear Regression - Actuals, Interpolation, and Residuals \tabularnewline
Time or Index & Actuals & InterpolationForecast & ResidualsPrediction Error \tabularnewline
1 & 108.2 & 110.975184302529 & -2.77518430252921 \tabularnewline
2 & 108.8 & 111.314661267739 & -2.51466126773874 \tabularnewline
3 & 110.2 & 116.678956628562 & -6.47895662856164 \tabularnewline
4 & 109.5 & 108.705774863079 & 0.794225136920803 \tabularnewline
5 & 109.5 & 112.706236364365 & -3.20623636436480 \tabularnewline
6 & 116 & 135.803036622118 & -19.8030366221178 \tabularnewline
7 & 111.2 & 128.648316519017 & -17.4483165190166 \tabularnewline
8 & 112.1 & 127.009485655607 & -14.9094856556069 \tabularnewline
9 & 114 & 127.558507111786 & -13.5585071117857 \tabularnewline
10 & 119.1 & 122.101941003542 & -3.00194100354202 \tabularnewline
11 & 114.1 & 113.150008690397 & 0.94999130960277 \tabularnewline
12 & 115.1 & 112.878599412043 & 2.22140058795716 \tabularnewline
13 & 115.4 & 125.357813510786 & -9.95781351078607 \tabularnewline
14 & 110.8 & 119.778428845834 & -8.9784288458336 \tabularnewline
15 & 116 & 126.742416539133 & -10.7424165391326 \tabularnewline
16 & 119.2 & 133.006496532689 & -13.8064965326888 \tabularnewline
17 & 126.5 & 133.007727202784 & -6.50772720278385 \tabularnewline
18 & 127.8 & 131.949173240145 & -4.14917324014544 \tabularnewline
19 & 131.3 & 134.072668665406 & -2.7726686654065 \tabularnewline
20 & 140.3 & 134.353468600968 & 5.94653139903174 \tabularnewline
21 & 137.3 & 123.864612963061 & 13.4353870369390 \tabularnewline
22 & 143 & 126.726446983694 & 16.2735530163062 \tabularnewline
23 & 134.5 & 120.334022402511 & 14.165977597489 \tabularnewline
24 & 139.9 & 126.141443987566 & 13.7585560124337 \tabularnewline
25 & 159.3 & 148.858689014158 & 10.4413109858424 \tabularnewline
26 & 170.4 & 160.076073840206 & 10.3239261597943 \tabularnewline
27 & 175 & 164.320584568295 & 10.6794154317049 \tabularnewline
28 & 175.8 & 160.026695167508 & 15.7733048324919 \tabularnewline
29 & 180.9 & 164.667033601784 & 16.2329663982158 \tabularnewline
30 & 180.3 & 165.848048904613 & 14.4519510953875 \tabularnewline
31 & 169.6 & 158.853298034759 & 10.746701965241 \tabularnewline
32 & 172.3 & 160.893759536045 & 11.4062404639554 \tabularnewline
33 & 184.8 & 171.040934987081 & 13.7590650129191 \tabularnewline
34 & 177.7 & 169.903538176523 & 7.79646182347684 \tabularnewline
35 & 184.6 & 170.709729091483 & 13.8902709085165 \tabularnewline
36 & 211.4 & 202.592135695902 & 8.80786430409833 \tabularnewline
37 & 215.3 & 220.990211424807 & -5.69021142480705 \tabularnewline
38 & 215.9 & 223.249319188988 & -7.34931918898821 \tabularnewline
39 & 244.7 & 247.489984073031 & -2.78998407303071 \tabularnewline
40 & 259.3 & 265.591787326911 & -6.29178732691112 \tabularnewline
41 & 289 & 300.946218544731 & -11.9462185447312 \tabularnewline
42 & 310.9 & 312.20529554216 & -1.30529554215997 \tabularnewline
43 & 321 & 305.050575439059 & 15.9494245609412 \tabularnewline
44 & 315.1 & 300.372329143944 & 14.7276708560559 \tabularnewline
45 & 333.2 & 326.356458686495 & 6.84354131350461 \tabularnewline
46 & 314.1 & 318.340384846290 & -4.24038484628962 \tabularnewline
47 & 284.7 & 280.434021315325 & 4.26597868467522 \tabularnewline
48 & 273.9 & 265.765381044684 & 8.13461895531582 \tabularnewline
49 & 216 & 208.01810174772 & 7.98189825227993 \tabularnewline
50 & 196.4 & 187.881516857234 & 8.51848314276628 \tabularnewline
51 & 190.9 & 181.56805819098 & 9.33194180902012 \tabularnewline
52 & 206.4 & 202.869246109813 & 3.53075389018716 \tabularnewline
53 & 196.3 & 190.872784286336 & 5.42721571366405 \tabularnewline
54 & 199.5 & 188.694445690964 & 10.8055543090358 \tabularnewline
55 & 198.9 & 205.375141341759 & -6.47514134175912 \tabularnewline
56 & 214.4 & 231.570957063436 & -17.1709570634361 \tabularnewline
57 & 214.2 & 234.679486251577 & -20.4794862515770 \tabularnewline
58 & 187.6 & 204.427688989951 & -16.8276889899514 \tabularnewline
59 & 180.6 & 213.872218500284 & -33.2722185002835 \tabularnewline
60 & 172.2 & 205.122439859805 & -32.922439859805 \tabularnewline
\hline
\end{tabular}
%Source: https://freestatistics.org/blog/index.php?pk=58240&T=4

[TABLE]
[ROW][C]Multiple Linear Regression - Actuals, Interpolation, and Residuals[/C][/ROW]
[ROW][C]Time or Index[/C][C]Actuals[/C][C]InterpolationForecast[/C][C]ResidualsPrediction Error[/C][/ROW]
[ROW][C]1[/C][C]108.2[/C][C]110.975184302529[/C][C]-2.77518430252921[/C][/ROW]
[ROW][C]2[/C][C]108.8[/C][C]111.314661267739[/C][C]-2.51466126773874[/C][/ROW]
[ROW][C]3[/C][C]110.2[/C][C]116.678956628562[/C][C]-6.47895662856164[/C][/ROW]
[ROW][C]4[/C][C]109.5[/C][C]108.705774863079[/C][C]0.794225136920803[/C][/ROW]
[ROW][C]5[/C][C]109.5[/C][C]112.706236364365[/C][C]-3.20623636436480[/C][/ROW]
[ROW][C]6[/C][C]116[/C][C]135.803036622118[/C][C]-19.8030366221178[/C][/ROW]
[ROW][C]7[/C][C]111.2[/C][C]128.648316519017[/C][C]-17.4483165190166[/C][/ROW]
[ROW][C]8[/C][C]112.1[/C][C]127.009485655607[/C][C]-14.9094856556069[/C][/ROW]
[ROW][C]9[/C][C]114[/C][C]127.558507111786[/C][C]-13.5585071117857[/C][/ROW]
[ROW][C]10[/C][C]119.1[/C][C]122.101941003542[/C][C]-3.00194100354202[/C][/ROW]
[ROW][C]11[/C][C]114.1[/C][C]113.150008690397[/C][C]0.94999130960277[/C][/ROW]
[ROW][C]12[/C][C]115.1[/C][C]112.878599412043[/C][C]2.22140058795716[/C][/ROW]
[ROW][C]13[/C][C]115.4[/C][C]125.357813510786[/C][C]-9.95781351078607[/C][/ROW]
[ROW][C]14[/C][C]110.8[/C][C]119.778428845834[/C][C]-8.9784288458336[/C][/ROW]
[ROW][C]15[/C][C]116[/C][C]126.742416539133[/C][C]-10.7424165391326[/C][/ROW]
[ROW][C]16[/C][C]119.2[/C][C]133.006496532689[/C][C]-13.8064965326888[/C][/ROW]
[ROW][C]17[/C][C]126.5[/C][C]133.007727202784[/C][C]-6.50772720278385[/C][/ROW]
[ROW][C]18[/C][C]127.8[/C][C]131.949173240145[/C][C]-4.14917324014544[/C][/ROW]
[ROW][C]19[/C][C]131.3[/C][C]134.072668665406[/C][C]-2.7726686654065[/C][/ROW]
[ROW][C]20[/C][C]140.3[/C][C]134.353468600968[/C][C]5.94653139903174[/C][/ROW]
[ROW][C]21[/C][C]137.3[/C][C]123.864612963061[/C][C]13.4353870369390[/C][/ROW]
[ROW][C]22[/C][C]143[/C][C]126.726446983694[/C][C]16.2735530163062[/C][/ROW]
[ROW][C]23[/C][C]134.5[/C][C]120.334022402511[/C][C]14.165977597489[/C][/ROW]
[ROW][C]24[/C][C]139.9[/C][C]126.141443987566[/C][C]13.7585560124337[/C][/ROW]
[ROW][C]25[/C][C]159.3[/C][C]148.858689014158[/C][C]10.4413109858424[/C][/ROW]
[ROW][C]26[/C][C]170.4[/C][C]160.076073840206[/C][C]10.3239261597943[/C][/ROW]
[ROW][C]27[/C][C]175[/C][C]164.320584568295[/C][C]10.6794154317049[/C][/ROW]
[ROW][C]28[/C][C]175.8[/C][C]160.026695167508[/C][C]15.7733048324919[/C][/ROW]
[ROW][C]29[/C][C]180.9[/C][C]164.667033601784[/C][C]16.2329663982158[/C][/ROW]
[ROW][C]30[/C][C]180.3[/C][C]165.848048904613[/C][C]14.4519510953875[/C][/ROW]
[ROW][C]31[/C][C]169.6[/C][C]158.853298034759[/C][C]10.746701965241[/C][/ROW]
[ROW][C]32[/C][C]172.3[/C][C]160.893759536045[/C][C]11.4062404639554[/C][/ROW]
[ROW][C]33[/C][C]184.8[/C][C]171.040934987081[/C][C]13.7590650129191[/C][/ROW]
[ROW][C]34[/C][C]177.7[/C][C]169.903538176523[/C][C]7.79646182347684[/C][/ROW]
[ROW][C]35[/C][C]184.6[/C][C]170.709729091483[/C][C]13.8902709085165[/C][/ROW]
[ROW][C]36[/C][C]211.4[/C][C]202.592135695902[/C][C]8.80786430409833[/C][/ROW]
[ROW][C]37[/C][C]215.3[/C][C]220.990211424807[/C][C]-5.69021142480705[/C][/ROW]
[ROW][C]38[/C][C]215.9[/C][C]223.249319188988[/C][C]-7.34931918898821[/C][/ROW]
[ROW][C]39[/C][C]244.7[/C][C]247.489984073031[/C][C]-2.78998407303071[/C][/ROW]
[ROW][C]40[/C][C]259.3[/C][C]265.591787326911[/C][C]-6.29178732691112[/C][/ROW]
[ROW][C]41[/C][C]289[/C][C]300.946218544731[/C][C]-11.9462185447312[/C][/ROW]
[ROW][C]42[/C][C]310.9[/C][C]312.20529554216[/C][C]-1.30529554215997[/C][/ROW]
[ROW][C]43[/C][C]321[/C][C]305.050575439059[/C][C]15.9494245609412[/C][/ROW]
[ROW][C]44[/C][C]315.1[/C][C]300.372329143944[/C][C]14.7276708560559[/C][/ROW]
[ROW][C]45[/C][C]333.2[/C][C]326.356458686495[/C][C]6.84354131350461[/C][/ROW]
[ROW][C]46[/C][C]314.1[/C][C]318.340384846290[/C][C]-4.24038484628962[/C][/ROW]
[ROW][C]47[/C][C]284.7[/C][C]280.434021315325[/C][C]4.26597868467522[/C][/ROW]
[ROW][C]48[/C][C]273.9[/C][C]265.765381044684[/C][C]8.13461895531582[/C][/ROW]
[ROW][C]49[/C][C]216[/C][C]208.01810174772[/C][C]7.98189825227993[/C][/ROW]
[ROW][C]50[/C][C]196.4[/C][C]187.881516857234[/C][C]8.51848314276628[/C][/ROW]
[ROW][C]51[/C][C]190.9[/C][C]181.56805819098[/C][C]9.33194180902012[/C][/ROW]
[ROW][C]52[/C][C]206.4[/C][C]202.869246109813[/C][C]3.53075389018716[/C][/ROW]
[ROW][C]53[/C][C]196.3[/C][C]190.872784286336[/C][C]5.42721571366405[/C][/ROW]
[ROW][C]54[/C][C]199.5[/C][C]188.694445690964[/C][C]10.8055543090358[/C][/ROW]
[ROW][C]55[/C][C]198.9[/C][C]205.375141341759[/C][C]-6.47514134175912[/C][/ROW]
[ROW][C]56[/C][C]214.4[/C][C]231.570957063436[/C][C]-17.1709570634361[/C][/ROW]
[ROW][C]57[/C][C]214.2[/C][C]234.679486251577[/C][C]-20.4794862515770[/C][/ROW]
[ROW][C]58[/C][C]187.6[/C][C]204.427688989951[/C][C]-16.8276889899514[/C][/ROW]
[ROW][C]59[/C][C]180.6[/C][C]213.872218500284[/C][C]-33.2722185002835[/C][/ROW]
[ROW][C]60[/C][C]172.2[/C][C]205.122439859805[/C][C]-32.922439859805[/C][/ROW]
[/TABLE]
Source: https://freestatistics.org/blog/index.php?pk=58240&T=4

Globally Unique Identifier (entire table): ba.freestatistics.org/blog/index.php?pk=58240&T=4

As an alternative you can also use a QR Code:  

The GUIDs for individual cells are displayed in the table below:

Multiple Linear Regression - Actuals, Interpolation, and Residuals
Time or IndexActualsInterpolationForecastResidualsPrediction Error
1108.2110.975184302529-2.77518430252921
2108.8111.314661267739-2.51466126773874
3110.2116.678956628562-6.47895662856164
4109.5108.7057748630790.794225136920803
5109.5112.706236364365-3.20623636436480
6116135.803036622118-19.8030366221178
7111.2128.648316519017-17.4483165190166
8112.1127.009485655607-14.9094856556069
9114127.558507111786-13.5585071117857
10119.1122.101941003542-3.00194100354202
11114.1113.1500086903970.94999130960277
12115.1112.8785994120432.22140058795716
13115.4125.357813510786-9.95781351078607
14110.8119.778428845834-8.9784288458336
15116126.742416539133-10.7424165391326
16119.2133.006496532689-13.8064965326888
17126.5133.007727202784-6.50772720278385
18127.8131.949173240145-4.14917324014544
19131.3134.072668665406-2.7726686654065
20140.3134.3534686009685.94653139903174
21137.3123.86461296306113.4353870369390
22143126.72644698369416.2735530163062
23134.5120.33402240251114.165977597489
24139.9126.14144398756613.7585560124337
25159.3148.85868901415810.4413109858424
26170.4160.07607384020610.3239261597943
27175164.32058456829510.6794154317049
28175.8160.02669516750815.7733048324919
29180.9164.66703360178416.2329663982158
30180.3165.84804890461314.4519510953875
31169.6158.85329803475910.746701965241
32172.3160.89375953604511.4062404639554
33184.8171.04093498708113.7590650129191
34177.7169.9035381765237.79646182347684
35184.6170.70972909148313.8902709085165
36211.4202.5921356959028.80786430409833
37215.3220.990211424807-5.69021142480705
38215.9223.249319188988-7.34931918898821
39244.7247.489984073031-2.78998407303071
40259.3265.591787326911-6.29178732691112
41289300.946218544731-11.9462185447312
42310.9312.20529554216-1.30529554215997
43321305.05057543905915.9494245609412
44315.1300.37232914394414.7276708560559
45333.2326.3564586864956.84354131350461
46314.1318.340384846290-4.24038484628962
47284.7280.4340213153254.26597868467522
48273.9265.7653810446848.13461895531582
49216208.018101747727.98189825227993
50196.4187.8815168572348.51848314276628
51190.9181.568058190989.33194180902012
52206.4202.8692461098133.53075389018716
53196.3190.8727842863365.42721571366405
54199.5188.69444569096410.8055543090358
55198.9205.375141341759-6.47514134175912
56214.4231.570957063436-17.1709570634361
57214.2234.679486251577-20.4794862515770
58187.6204.427688989951-16.8276889899514
59180.6213.872218500284-33.2722185002835
60172.2205.122439859805-32.922439859805


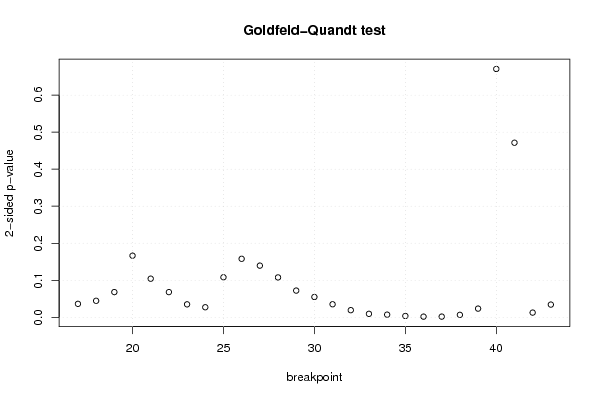
Goldfeld-Quandt test for Heteroskedasticity
p-valuesAlternative Hypothesis
breakpoint indexgreater2-sidedless
170.01822145421837810.03644290843675620.981778545781622
180.02233837548027110.04467675096054210.977661624519729
190.03408568202404590.06817136404809180.965914317975954
200.08323689973652750.1664737994730550.916763100263473
210.05218375158714360.1043675031742870.947816248412856
220.03408755321314320.06817510642628640.965912446786857
230.01757535545679220.03515071091358440.982424644543208
240.01363258927554900.02726517855109790.986367410724451
250.054120613018160.108241226036320.94587938698184
260.07903828839897260.1580765767979450.920961711601027
270.06981400934992160.1396280186998430.930185990650078
280.05388654630292980.1077730926058600.94611345369707
290.03612430505406510.07224861010813030.963875694945935
300.02752209487479210.05504418974958420.972477905125208
310.01765910546355520.03531821092711030.982340894536445
320.00968699539414020.01937399078828040.99031300460586
330.004726932477569470.009453864955138950.99527306752243
340.003642720545898210.007285441091796420.996357279454102
350.001875618106964490.003751236213928980.998124381893035
360.0009370807004375720.001874161400875140.999062919299562
370.000992179236538930.001984358473077860.999007820763461
380.003354991580429320.006709983160858630.99664500841957
390.01179078931643190.02358157863286390.988209210683568
400.3353477739923060.6706955479846120.664652226007694
410.7642603164542620.4714793670914760.235739683545738
420.9936064853949360.01278702921012710.00639351460506355
430.98277555880130.0344488823974020.017224441198701

\begin{tabular}{lllllllll}
\hline
Goldfeld-Quandt test for Heteroskedasticity \tabularnewline
p-values & Alternative Hypothesis \tabularnewline
breakpoint index & greater & 2-sided & less \tabularnewline
17 & 0.0182214542183781 & 0.0364429084367562 & 0.981778545781622 \tabularnewline
18 & 0.0223383754802711 & 0.0446767509605421 & 0.977661624519729 \tabularnewline
19 & 0.0340856820240459 & 0.0681713640480918 & 0.965914317975954 \tabularnewline
20 & 0.0832368997365275 & 0.166473799473055 & 0.916763100263473 \tabularnewline
21 & 0.0521837515871436 & 0.104367503174287 & 0.947816248412856 \tabularnewline
22 & 0.0340875532131432 & 0.0681751064262864 & 0.965912446786857 \tabularnewline
23 & 0.0175753554567922 & 0.0351507109135844 & 0.982424644543208 \tabularnewline
24 & 0.0136325892755490 & 0.0272651785510979 & 0.986367410724451 \tabularnewline
25 & 0.05412061301816 & 0.10824122603632 & 0.94587938698184 \tabularnewline
26 & 0.0790382883989726 & 0.158076576797945 & 0.920961711601027 \tabularnewline
27 & 0.0698140093499216 & 0.139628018699843 & 0.930185990650078 \tabularnewline
28 & 0.0538865463029298 & 0.107773092605860 & 0.94611345369707 \tabularnewline
29 & 0.0361243050540651 & 0.0722486101081303 & 0.963875694945935 \tabularnewline
30 & 0.0275220948747921 & 0.0550441897495842 & 0.972477905125208 \tabularnewline
31 & 0.0176591054635552 & 0.0353182109271103 & 0.982340894536445 \tabularnewline
32 & 0.0096869953941402 & 0.0193739907882804 & 0.99031300460586 \tabularnewline
33 & 0.00472693247756947 & 0.00945386495513895 & 0.99527306752243 \tabularnewline
34 & 0.00364272054589821 & 0.00728544109179642 & 0.996357279454102 \tabularnewline
35 & 0.00187561810696449 & 0.00375123621392898 & 0.998124381893035 \tabularnewline
36 & 0.000937080700437572 & 0.00187416140087514 & 0.999062919299562 \tabularnewline
37 & 0.00099217923653893 & 0.00198435847307786 & 0.999007820763461 \tabularnewline
38 & 0.00335499158042932 & 0.00670998316085863 & 0.99664500841957 \tabularnewline
39 & 0.0117907893164319 & 0.0235815786328639 & 0.988209210683568 \tabularnewline
40 & 0.335347773992306 & 0.670695547984612 & 0.664652226007694 \tabularnewline
41 & 0.764260316454262 & 0.471479367091476 & 0.235739683545738 \tabularnewline
42 & 0.993606485394936 & 0.0127870292101271 & 0.00639351460506355 \tabularnewline
43 & 0.9827755588013 & 0.034448882397402 & 0.017224441198701 \tabularnewline
\hline
\end{tabular}
%Source: https://freestatistics.org/blog/index.php?pk=58240&T=5

[TABLE]
[ROW][C]Goldfeld-Quandt test for Heteroskedasticity[/C][/ROW]
[ROW][C]p-values[/C][C]Alternative Hypothesis[/C][/ROW]
[ROW][C]breakpoint index[/C][C]greater[/C][C]2-sided[/C][C]less[/C][/ROW]
[ROW][C]17[/C][C]0.0182214542183781[/C][C]0.0364429084367562[/C][C]0.981778545781622[/C][/ROW]
[ROW][C]18[/C][C]0.0223383754802711[/C][C]0.0446767509605421[/C][C]0.977661624519729[/C][/ROW]
[ROW][C]19[/C][C]0.0340856820240459[/C][C]0.0681713640480918[/C][C]0.965914317975954[/C][/ROW]
[ROW][C]20[/C][C]0.0832368997365275[/C][C]0.166473799473055[/C][C]0.916763100263473[/C][/ROW]
[ROW][C]21[/C][C]0.0521837515871436[/C][C]0.104367503174287[/C][C]0.947816248412856[/C][/ROW]
[ROW][C]22[/C][C]0.0340875532131432[/C][C]0.0681751064262864[/C][C]0.965912446786857[/C][/ROW]
[ROW][C]23[/C][C]0.0175753554567922[/C][C]0.0351507109135844[/C][C]0.982424644543208[/C][/ROW]
[ROW][C]24[/C][C]0.0136325892755490[/C][C]0.0272651785510979[/C][C]0.986367410724451[/C][/ROW]
[ROW][C]25[/C][C]0.05412061301816[/C][C]0.10824122603632[/C][C]0.94587938698184[/C][/ROW]
[ROW][C]26[/C][C]0.0790382883989726[/C][C]0.158076576797945[/C][C]0.920961711601027[/C][/ROW]
[ROW][C]27[/C][C]0.0698140093499216[/C][C]0.139628018699843[/C][C]0.930185990650078[/C][/ROW]
[ROW][C]28[/C][C]0.0538865463029298[/C][C]0.107773092605860[/C][C]0.94611345369707[/C][/ROW]
[ROW][C]29[/C][C]0.0361243050540651[/C][C]0.0722486101081303[/C][C]0.963875694945935[/C][/ROW]
[ROW][C]30[/C][C]0.0275220948747921[/C][C]0.0550441897495842[/C][C]0.972477905125208[/C][/ROW]
[ROW][C]31[/C][C]0.0176591054635552[/C][C]0.0353182109271103[/C][C]0.982340894536445[/C][/ROW]
[ROW][C]32[/C][C]0.0096869953941402[/C][C]0.0193739907882804[/C][C]0.99031300460586[/C][/ROW]
[ROW][C]33[/C][C]0.00472693247756947[/C][C]0.00945386495513895[/C][C]0.99527306752243[/C][/ROW]
[ROW][C]34[/C][C]0.00364272054589821[/C][C]0.00728544109179642[/C][C]0.996357279454102[/C][/ROW]
[ROW][C]35[/C][C]0.00187561810696449[/C][C]0.00375123621392898[/C][C]0.998124381893035[/C][/ROW]
[ROW][C]36[/C][C]0.000937080700437572[/C][C]0.00187416140087514[/C][C]0.999062919299562[/C][/ROW]
[ROW][C]37[/C][C]0.00099217923653893[/C][C]0.00198435847307786[/C][C]0.999007820763461[/C][/ROW]
[ROW][C]38[/C][C]0.00335499158042932[/C][C]0.00670998316085863[/C][C]0.99664500841957[/C][/ROW]
[ROW][C]39[/C][C]0.0117907893164319[/C][C]0.0235815786328639[/C][C]0.988209210683568[/C][/ROW]
[ROW][C]40[/C][C]0.335347773992306[/C][C]0.670695547984612[/C][C]0.664652226007694[/C][/ROW]
[ROW][C]41[/C][C]0.764260316454262[/C][C]0.471479367091476[/C][C]0.235739683545738[/C][/ROW]
[ROW][C]42[/C][C]0.993606485394936[/C][C]0.0127870292101271[/C][C]0.00639351460506355[/C][/ROW]
[ROW][C]43[/C][C]0.9827755588013[/C][C]0.034448882397402[/C][C]0.017224441198701[/C][/ROW]
[/TABLE]
Source: https://freestatistics.org/blog/index.php?pk=58240&T=5

Globally Unique Identifier (entire table): ba.freestatistics.org/blog/index.php?pk=58240&T=5

As an alternative you can also use a QR Code:  

The GUIDs for individual cells are displayed in the table below:

Goldfeld-Quandt test for Heteroskedasticity
p-valuesAlternative Hypothesis
breakpoint indexgreater2-sidedless
170.01822145421837810.03644290843675620.981778545781622
180.02233837548027110.04467675096054210.977661624519729
190.03408568202404590.06817136404809180.965914317975954
200.08323689973652750.1664737994730550.916763100263473
210.05218375158714360.1043675031742870.947816248412856
220.03408755321314320.06817510642628640.965912446786857
230.01757535545679220.03515071091358440.982424644543208
240.01363258927554900.02726517855109790.986367410724451
250.054120613018160.108241226036320.94587938698184
260.07903828839897260.1580765767979450.920961711601027
270.06981400934992160.1396280186998430.930185990650078
280.05388654630292980.1077730926058600.94611345369707
290.03612430505406510.07224861010813030.963875694945935
300.02752209487479210.05504418974958420.972477905125208
310.01765910546355520.03531821092711030.982340894536445
320.00968699539414020.01937399078828040.99031300460586
330.004726932477569470.009453864955138950.99527306752243
340.003642720545898210.007285441091796420.996357279454102
350.001875618106964490.003751236213928980.998124381893035
360.0009370807004375720.001874161400875140.999062919299562
370.000992179236538930.001984358473077860.999007820763461
380.003354991580429320.006709983160858630.99664500841957
390.01179078931643190.02358157863286390.988209210683568
400.3353477739923060.6706955479846120.664652226007694
410.7642603164542620.4714793670914760.235739683545738
420.9936064853949360.01278702921012710.00639351460506355
430.98277555880130.0344488823974020.017224441198701


Meta Analysis of Goldfeld-Quandt test for Heteroskedasticity
Description# significant tests% significant testsOK/NOK
1% type I error level60.222222222222222NOK
5% type I error level150.555555555555556NOK
10% type I error level190.703703703703704NOK

\begin{tabular}{lllllllll}
\hline
Meta Analysis of Goldfeld-Quandt test for Heteroskedasticity \tabularnewline
Description & # significant tests & % significant tests & OK/NOK \tabularnewline
1% type I error level & 6 & 0.222222222222222 & NOK \tabularnewline
5% type I error level & 15 & 0.555555555555556 & NOK \tabularnewline
10% type I error level & 19 & 0.703703703703704 & NOK \tabularnewline
\hline
\end{tabular}
%Source: https://freestatistics.org/blog/index.php?pk=58240&T=6

[TABLE]
[ROW][C]Meta Analysis of Goldfeld-Quandt test for Heteroskedasticity[/C][/ROW]
[ROW][C]Description[/C][C]# significant tests[/C][C]% significant tests[/C][C]OK/NOK[/C][/ROW]
[ROW][C]1% type I error level[/C][C]6[/C][C]0.222222222222222[/C][C]NOK[/C][/ROW]
[ROW][C]5% type I error level[/C][C]15[/C][C]0.555555555555556[/C][C]NOK[/C][/ROW]
[ROW][C]10% type I error level[/C][C]19[/C][C]0.703703703703704[/C][C]NOK[/C][/ROW]
[/TABLE]
Source: https://freestatistics.org/blog/index.php?pk=58240&T=6

Globally Unique Identifier (entire table): ba.freestatistics.org/blog/index.php?pk=58240&T=6

As an alternative you can also use a QR Code:  

The GUIDs for individual cells are displayed in the table below:

Meta Analysis of Goldfeld-Quandt test for Heteroskedasticity
Description# significant tests% significant testsOK/NOK
1% type I error level60.222222222222222NOK
5% type I error level150.555555555555556NOK
10% type I error level190.703703703703704NOK


Parameters (Session):
par1 = 1 ; par2 = Include Monthly Dummies ; par3 = Linear Trend ;
Parameters (R input):
par1 = 1 ; par2 = Include Monthly Dummies ; par3 = Linear Trend ;
R code (references can be found in the software module):
library(lattice)
library(lmtest)
n25 <- 25 #minimum number of obs. for Goldfeld-Quandt test
par1 <- as.numeric(par1)
x <- t(y)
k <- length(x[1,])
n <- length(x[,1])
x1 <- cbind(x[,par1], x[,1:k!=par1])
mycolnames <- c(colnames(x)[par1], colnames(x)[1:k!=par1])
colnames(x1) <- mycolnames #colnames(x)[par1]
x <- x1
if (par3 == 'First Differences'){
x2 <- array(0, dim=c(n-1,k), dimnames=list(1:(n-1), paste('(1-B)',colnames(x),sep='')))
for (i in 1:n-1) {
for (j in 1:k) {
x2[i,j] <- x[i+1,j] - x[i,j]
}
}
x <- x2
}
if (par2 == 'Include Monthly Dummies'){
x2 <- array(0, dim=c(n,11), dimnames=list(1:n, paste('M', seq(1:11), sep ='')))
for (i in 1:11){
x2[seq(i,n,12),i] <- 1
}
x <- cbind(x, x2)
}
if (par2 == 'Include Quarterly Dummies'){
x2 <- array(0, dim=c(n,3), dimnames=list(1:n, paste('Q', seq(1:3), sep ='')))
for (i in 1:3){
x2[seq(i,n,4),i] <- 1
}
x <- cbind(x, x2)
}
k <- length(x[1,])
if (par3 == 'Linear Trend'){
x <- cbind(x, c(1:n))
colnames(x)[k+1] <- 't'
}
x
k <- length(x[1,])
df <- as.data.frame(x)
(mylm <- lm(df))
(mysum <- summary(mylm))
if (n > n25) {
kp3 <- k + 3
nmkm3 <- n - k - 3
gqarr <- array(NA, dim=c(nmkm3-kp3+1,3))
numgqtests <- 0
numsignificant1 <- 0
numsignificant5 <- 0
numsignificant10 <- 0
for (mypoint in kp3:nmkm3) {
j <- 0
numgqtests <- numgqtests + 1
for (myalt in c('greater', 'two.sided', 'less')) {
j <- j + 1
gqarr[mypoint-kp3+1,j] <- gqtest(mylm, point=mypoint, alternative=myalt)$p.value
}
if (gqarr[mypoint-kp3+1,2] < 0.01) numsignificant1 <- numsignificant1 + 1
if (gqarr[mypoint-kp3+1,2] < 0.05) numsignificant5 <- numsignificant5 + 1
if (gqarr[mypoint-kp3+1,2] < 0.10) numsignificant10 <- numsignificant10 + 1
}
gqarr
}
bitmap(file='test0.png')
plot(x[,1], type='l', main='Actuals and Interpolation', ylab='value of Actuals and Interpolation (dots)', xlab='time or index')
points(x[,1]-mysum$resid)
grid()
dev.off()
bitmap(file='test1.png')
plot(mysum$resid, type='b', pch=19, main='Residuals', ylab='value of Residuals', xlab='time or index')
grid()
dev.off()
bitmap(file='test2.png')
hist(mysum$resid, main='Residual Histogram', xlab='values of Residuals')
grid()
dev.off()
bitmap(file='test3.png')
densityplot(~mysum$resid,col='black',main='Residual Density Plot', xlab='values of Residuals')
dev.off()
bitmap(file='test4.png')
qqnorm(mysum$resid, main='Residual Normal Q-Q Plot')
qqline(mysum$resid)
grid()
dev.off()
(myerror <- as.ts(mysum$resid))
bitmap(file='test5.png')
dum <- cbind(lag(myerror,k=1),myerror)
dum
dum1 <- dum[2:length(myerror),]
dum1
z <- as.data.frame(dum1)
z
plot(z,main=paste('Residual Lag plot, lowess, and regression line'), ylab='values of Residuals', xlab='lagged values of Residuals')
lines(lowess(z))
abline(lm(z))
grid()
dev.off()
bitmap(file='test6.png')
acf(mysum$resid, lag.max=length(mysum$resid)/2, main='Residual Autocorrelation Function')
grid()
dev.off()
bitmap(file='test7.png')
pacf(mysum$resid, lag.max=length(mysum$resid)/2, main='Residual Partial Autocorrelation Function')
grid()
dev.off()
bitmap(file='test8.png')
opar <- par(mfrow = c(2,2), oma = c(0, 0, 1.1, 0))
plot(mylm, las = 1, sub='Residual Diagnostics')
par(opar)
dev.off()
if (n > n25) {
bitmap(file='test9.png')
plot(kp3:nmkm3,gqarr[,2], main='Goldfeld-Quandt test',ylab='2-sided p-value',xlab='breakpoint')
grid()
dev.off()
}
load(file='createtable')
a<-table.start()
a<-table.row.start(a)
a<-table.element(a, 'Multiple Linear Regression - Estimated Regression Equation', 1, TRUE)
a<-table.row.end(a)
myeq <- colnames(x)[1]
myeq <- paste(myeq, '[t] = ', sep='')
for (i in 1:k){
if (mysum$coefficients[i,1] > 0) myeq <- paste(myeq, '+', '')
myeq <- paste(myeq, mysum$coefficients[i,1], sep=' ')
if (rownames(mysum$coefficients)[i] != '(Intercept)') {
myeq <- paste(myeq, rownames(mysum$coefficients)[i], sep='')
if (rownames(mysum$coefficients)[i] != 't') myeq <- paste(myeq, '[t]', sep='')
}
}
myeq <- paste(myeq, ' + e[t]')
a<-table.row.start(a)
a<-table.element(a, myeq)
a<-table.row.end(a)
a<-table.end(a)
table.save(a,file='mytable1.tab')
a<-table.start()
a<-table.row.start(a)
a<-table.element(a,hyperlink('ols1.htm','Multiple Linear Regression - Ordinary Least Squares',''), 6, TRUE)
a<-table.row.end(a)
a<-table.row.start(a)
a<-table.element(a,'Variable',header=TRUE)
a<-table.element(a,'Parameter',header=TRUE)
a<-table.element(a,'S.D.',header=TRUE)
a<-table.element(a,'T-STAT
H0: parameter = 0',header=TRUE)
a<-table.element(a,'2-tail p-value',header=TRUE)
a<-table.element(a,'1-tail p-value',header=TRUE)
a<-table.row.end(a)
for (i in 1:k){
a<-table.row.start(a)
a<-table.element(a,rownames(mysum$coefficients)[i],header=TRUE)
a<-table.element(a,mysum$coefficients[i,1])
a<-table.element(a, round(mysum$coefficients[i,2],6))
a<-table.element(a, round(mysum$coefficients[i,3],4))
a<-table.element(a, round(mysum$coefficients[i,4],6))
a<-table.element(a, round(mysum$coefficients[i,4]/2,6))
a<-table.row.end(a)
}
a<-table.end(a)
table.save(a,file='mytable2.tab')
a<-table.start()
a<-table.row.start(a)
a<-table.element(a, 'Multiple Linear Regression - Regression Statistics', 2, TRUE)
a<-table.row.end(a)
a<-table.row.start(a)
a<-table.element(a, 'Multiple R',1,TRUE)
a<-table.element(a, sqrt(mysum$r.squared))
a<-table.row.end(a)
a<-table.row.start(a)
a<-table.element(a, 'R-squared',1,TRUE)
a<-table.element(a, mysum$r.squared)
a<-table.row.end(a)
a<-table.row.start(a)
a<-table.element(a, 'Adjusted R-squared',1,TRUE)
a<-table.element(a, mysum$adj.r.squared)
a<-table.row.end(a)
a<-table.row.start(a)
a<-table.element(a, 'F-TEST (value)',1,TRUE)
a<-table.element(a, mysum$fstatistic[1])
a<-table.row.end(a)
a<-table.row.start(a)
a<-table.element(a, 'F-TEST (DF numerator)',1,TRUE)
a<-table.element(a, mysum$fstatistic[2])
a<-table.row.end(a)
a<-table.row.start(a)
a<-table.element(a, 'F-TEST (DF denominator)',1,TRUE)
a<-table.element(a, mysum$fstatistic[3])
a<-table.row.end(a)
a<-table.row.start(a)
a<-table.element(a, 'p-value',1,TRUE)
a<-table.element(a, 1-pf(mysum$fstatistic[1],mysum$fstatistic[2],mysum$fstatistic[3]))
a<-table.row.end(a)
a<-table.row.start(a)
a<-table.element(a, 'Multiple Linear Regression - Residual Statistics', 2, TRUE)
a<-table.row.end(a)
a<-table.row.start(a)
a<-table.element(a, 'Residual Standard Deviation',1,TRUE)
a<-table.element(a, mysum$sigma)
a<-table.row.end(a)
a<-table.row.start(a)
a<-table.element(a, 'Sum Squared Residuals',1,TRUE)
a<-table.element(a, sum(myerror*myerror))
a<-table.row.end(a)
a<-table.end(a)
table.save(a,file='mytable3.tab')
a<-table.start()
a<-table.row.start(a)
a<-table.element(a, 'Multiple Linear Regression - Actuals, Interpolation, and Residuals', 4, TRUE)
a<-table.row.end(a)
a<-table.row.start(a)
a<-table.element(a, 'Time or Index', 1, TRUE)
a<-table.element(a, 'Actuals', 1, TRUE)
a<-table.element(a, 'Interpolation
Forecast', 1, TRUE)
a<-table.element(a, 'Residuals
Prediction Error', 1, TRUE)
a<-table.row.end(a)
for (i in 1:n) {
a<-table.row.start(a)
a<-table.element(a,i, 1, TRUE)
a<-table.element(a,x[i])
a<-table.element(a,x[i]-mysum$resid[i])
a<-table.element(a,mysum$resid[i])
a<-table.row.end(a)
}
a<-table.end(a)
table.save(a,file='mytable4.tab')
if (n > n25) {
a<-table.start()
a<-table.row.start(a)
a<-table.element(a,'Goldfeld-Quandt test for Heteroskedasticity',4,TRUE)
a<-table.row.end(a)
a<-table.row.start(a)
a<-table.element(a,'p-values',header=TRUE)
a<-table.element(a,'Alternative Hypothesis',3,header=TRUE)
a<-table.row.end(a)
a<-table.row.start(a)
a<-table.element(a,'breakpoint index',header=TRUE)
a<-table.element(a,'greater',header=TRUE)
a<-table.element(a,'2-sided',header=TRUE)
a<-table.element(a,'less',header=TRUE)
a<-table.row.end(a)
for (mypoint in kp3:nmkm3) {
a<-table.row.start(a)
a<-table.element(a,mypoint,header=TRUE)
a<-table.element(a,gqarr[mypoint-kp3+1,1])
a<-table.element(a,gqarr[mypoint-kp3+1,2])
a<-table.element(a,gqarr[mypoint-kp3+1,3])
a<-table.row.end(a)
}
a<-table.end(a)
table.save(a,file='mytable5.tab')
a<-table.start()
a<-table.row.start(a)
a<-table.element(a,'Meta Analysis of Goldfeld-Quandt test for Heteroskedasticity',4,TRUE)
a<-table.row.end(a)
a<-table.row.start(a)
a<-table.element(a,'Description',header=TRUE)
a<-table.element(a,'# significant tests',header=TRUE)
a<-table.element(a,'% significant tests',header=TRUE)
a<-table.element(a,'OK/NOK',header=TRUE)
a<-table.row.end(a)
a<-table.row.start(a)
a<-table.element(a,'1% type I error level',header=TRUE)
a<-table.element(a,numsignificant1)
a<-table.element(a,numsignificant1/numgqtests)
if (numsignificant1/numgqtests < 0.01) dum <- 'OK' else dum <- 'NOK'
a<-table.element(a,dum)
a<-table.row.end(a)
a<-table.row.start(a)
a<-table.element(a,'5% type I error level',header=TRUE)
a<-table.element(a,numsignificant5)
a<-table.element(a,numsignificant5/numgqtests)
if (numsignificant5/numgqtests < 0.05) dum <- 'OK' else dum <- 'NOK'
a<-table.element(a,dum)
a<-table.row.end(a)
a<-table.row.start(a)
a<-table.element(a,'10% type I error level',header=TRUE)
a<-table.element(a,numsignificant10)
a<-table.element(a,numsignificant10/numgqtests)
if (numsignificant10/numgqtests < 0.1) dum <- 'OK' else dum <- 'NOK'
a<-table.element(a,dum)
a<-table.row.end(a)
a<-table.end(a)
table.save(a,file='mytable6.tab')
}