| Multiple Linear Regression - Estimated Regression Equation |
| Y[t] = + 22527.8181455235 -1760.41995763605X[t] + 22.9871244635193t + e[t] |
| Multiple Linear Regression - Ordinary Least Squares | |||||
| Variable | Parameter | S.D. | T-STAT H0: parameter = 0 | 2-tail p-value | 1-tail p-value |
| (Intercept) | 22527.8181455235 | 1750.229617 | 12.8714 | 0 | 0 |
| X | -1760.41995763605 | 2651.69407 | -0.6639 | 0.509394 | 0.254697 |
| t | 22.9871244635193 | 68.688371 | 0.3347 | 0.73909 | 0.369545 |
| Multiple Linear Regression - Regression Statistics | |
| Multiple R | 0.0957486084587364 |
| R-squared | 0.00916779602178442 |
| Adjusted R-squared | -0.0249988317016023 |
| F-TEST (value) | 0.268326043061872 |
| F-TEST (DF numerator) | 2 |
| F-TEST (DF denominator) | 58 |
| p-value | 0.76560241245108 |
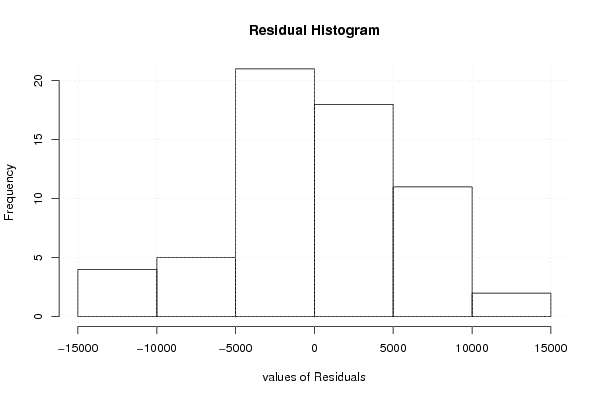
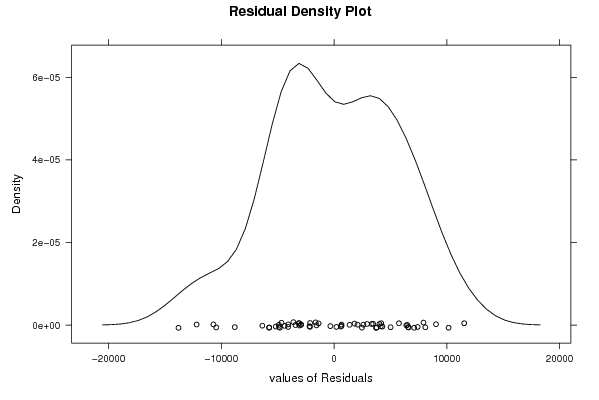
| Multiple Linear Regression - Residual Statistics | |
| Residual Standard Deviation | 5790.43373566096 |
| Sum Squared Residuals | 1944689125.13067 |
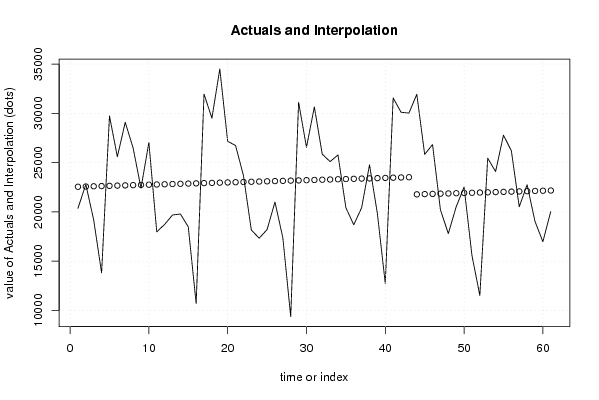
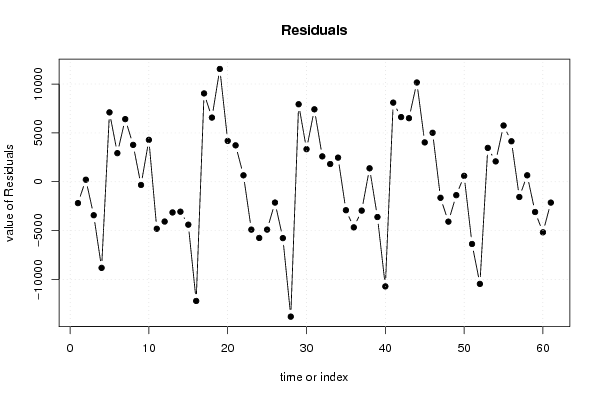
| Multiple Linear Regression - Actuals, Interpolation, and Residuals | |||
| Time or Index | Actuals | Interpolation Forecast | Residuals Prediction Error |
| 1 | 20366 | 22550.8052699870 | -2184.80526998704 |
| 2 | 22782 | 22573.7923944505 | 208.207605549456 |
| 3 | 19169 | 22596.7795189141 | -3427.77951891406 |
| 4 | 13807 | 22619.7666433776 | -8812.76664337758 |
| 5 | 29743 | 22642.7537678411 | 7100.2462321589 |
| 6 | 25591 | 22665.7408923046 | 2925.25910769538 |
| 7 | 29096 | 22688.7280167681 | 6407.27198323186 |
| 8 | 26482 | 22711.7151412317 | 3770.28485876834 |
| 9 | 22405 | 22734.7022656952 | -329.702265695178 |
| 10 | 27044 | 22757.6893901587 | 4286.3106098413 |
| 11 | 17970 | 22780.6765146222 | -4810.67651462222 |
| 12 | 18730 | 22803.6636390857 | -4073.66363908574 |
| 13 | 19684 | 22826.6507635493 | -3142.65076354926 |
| 14 | 19785 | 22849.6378880128 | -3064.63788801278 |
| 15 | 18479 | 22872.6250124763 | -4393.62501247629 |
| 16 | 10698 | 22895.6121369398 | -12197.6121369398 |
| 17 | 31956 | 22918.5992614033 | 9037.40073859667 |
| 18 | 29506 | 22941.5863858669 | 6564.41361413315 |
| 19 | 34506 | 22964.5735103304 | 11541.4264896696 |
| 20 | 27165 | 22987.5606347939 | 4177.43936520611 |
| 21 | 26736 | 23010.5477592574 | 3725.45224074259 |
| 22 | 23691 | 23033.5348837209 | 657.46511627907 |
| 23 | 18157 | 23056.5220081844 | -4899.52200818445 |
| 24 | 17328 | 23079.5091326480 | -5751.50913264797 |
| 25 | 18205 | 23102.4962571115 | -4897.49625711149 |
| 26 | 20995 | 23125.483381575 | -2130.48338157501 |
| 27 | 17382 | 23148.4705060385 | -5766.47050603853 |
| 28 | 9367 | 23171.4576305020 | -13804.4576305020 |
| 29 | 31124 | 23194.4447549656 | 7929.55524503443 |
| 30 | 26551 | 23217.4318794291 | 3333.56812057092 |
| 31 | 30651 | 23240.4190038926 | 7410.5809961074 |
| 32 | 25859 | 23263.4061283561 | 2595.59387164388 |
| 33 | 25100 | 23286.3932528196 | 1813.60674718036 |
| 34 | 25778 | 23309.3803772832 | 2468.61962271684 |
| 35 | 20418 | 23332.3675017467 | -2914.36750174668 |
| 36 | 18688 | 23355.3546262102 | -4667.3546262102 |
| 37 | 20424 | 23378.3417506737 | -2954.34175067372 |
| 38 | 24776 | 23401.3288751372 | 1374.67112486276 |
| 39 | 19814 | 23424.3159996008 | -3610.31599960076 |
| 40 | 12738 | 23447.3031240643 | -10709.3031240643 |
| 41 | 31566 | 23470.2902485278 | 8095.7097514722 |
| 42 | 30111 | 23493.2773729913 | 6617.72262700868 |
| 43 | 30019 | 23516.2644974548 | 6502.73550254516 |
| 44 | 31934 | 21778.8316642823 | 10155.1683357177 |
| 45 | 25826 | 21801.8187887458 | 4024.18121125417 |
| 46 | 26835 | 21824.8059132093 | 5010.19408679065 |
| 47 | 20205 | 21847.7930376729 | -1642.79303767287 |
| 48 | 17789 | 21870.7801621364 | -4081.78016213639 |
| 49 | 20520 | 21893.7672865999 | -1373.76728659990 |
| 50 | 22518 | 21916.7544110634 | 601.245588936576 |
| 51 | 15572 | 21939.7415355269 | -6367.74153552694 |
| 52 | 11509 | 21962.7286599905 | -10453.7286599905 |
| 53 | 25447 | 21985.715784454 | 3461.28421554602 |
| 54 | 24090 | 22008.7029089175 | 2081.2970910825 |
| 55 | 27786 | 22031.690033381 | 5754.30996661898 |
| 56 | 26195 | 22054.6771578445 | 4140.32284215546 |
| 57 | 20516 | 22077.6642823081 | -1561.66428230806 |
| 58 | 22759 | 22100.6514067716 | 658.348593228421 |
| 59 | 19028 | 22123.6385312351 | -3095.6385312351 |
| 60 | 16971 | 22146.6256556986 | -5175.62565569862 |
| 61 | 20036 | 22169.6127801621 | -2133.61278016214 |
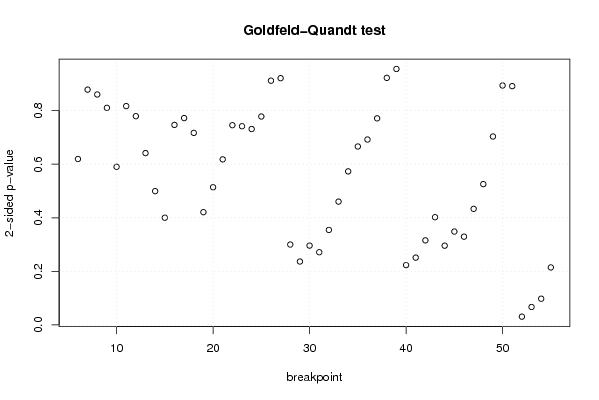
| Goldfeld-Quandt test for Heteroskedasticity | |||
| p-values | Alternative Hypothesis | ||
| breakpoint index | greater | 2-sided | less |
| 6 | 0.690228296540862 | 0.619543406918275 | 0.309771703459138 |
| 7 | 0.560730414310135 | 0.878539171379729 | 0.439269585689865 |
| 8 | 0.430217514465791 | 0.860435028931582 | 0.569782485534209 |
| 9 | 0.405290916835629 | 0.810581833671258 | 0.594709083164371 |
| 10 | 0.295223616414178 | 0.590447232828356 | 0.704776383585822 |
| 11 | 0.408483346360986 | 0.816966692721971 | 0.591516653639014 |
| 12 | 0.389696910484616 | 0.779393820969233 | 0.610303089515384 |
| 13 | 0.320815121783283 | 0.641630243566566 | 0.679184878216717 |
| 14 | 0.249781163712051 | 0.499562327424102 | 0.750218836287949 |
| 15 | 0.200189598335037 | 0.400379196670074 | 0.799810401664963 |
| 16 | 0.373432580484672 | 0.746865160969343 | 0.626567419515328 |
| 17 | 0.61381089375875 | 0.772378212482501 | 0.386189106241251 |
| 18 | 0.641460847420919 | 0.717078305158162 | 0.358539152579081 |
| 19 | 0.789520395700454 | 0.420959208599092 | 0.210479604299546 |
| 20 | 0.742977186645308 | 0.514045626709384 | 0.257022813354692 |
| 21 | 0.690871790995919 | 0.618256418008162 | 0.309128209004081 |
| 22 | 0.62712707237395 | 0.745745855252101 | 0.372872927626050 |
| 23 | 0.629067741309413 | 0.741864517381174 | 0.370932258690587 |
| 24 | 0.634271134143415 | 0.73145773171317 | 0.365728865856585 |
| 25 | 0.610892819048545 | 0.77821436190291 | 0.389107180951455 |
| 26 | 0.544032076829843 | 0.911935846340314 | 0.455967923170157 |
| 27 | 0.539341614175535 | 0.92131677164893 | 0.460658385824465 |
| 28 | 0.849909919399349 | 0.300180161201302 | 0.150090080600651 |
| 29 | 0.881615298453914 | 0.236769403092171 | 0.118384701546086 |
| 30 | 0.851910655802569 | 0.296178688394863 | 0.148089344197431 |
| 31 | 0.864258698758191 | 0.271482602483618 | 0.135741301241809 |
| 32 | 0.822686431015921 | 0.354627137968157 | 0.177313568984079 |
| 33 | 0.76979245881889 | 0.460415082362219 | 0.230207541181109 |
| 34 | 0.713294488830408 | 0.573411022339185 | 0.286705511169592 |
| 35 | 0.6668461632408 | 0.666307673518399 | 0.333153836759199 |
| 36 | 0.653892129059586 | 0.692215741880827 | 0.346107870940414 |
| 37 | 0.614323801877604 | 0.771352396244793 | 0.385676198122396 |
| 38 | 0.538725695034472 | 0.922548609931057 | 0.461274304965528 |
| 39 | 0.522112292522692 | 0.955775414954617 | 0.477887707477308 |
| 40 | 0.888299930575295 | 0.22340013884941 | 0.111700069424705 |
| 41 | 0.874293904575543 | 0.251412190848914 | 0.125706095424457 |
| 42 | 0.84211046828611 | 0.315779063427779 | 0.157889531713889 |
| 43 | 0.798843308980131 | 0.402313382039737 | 0.201156691019869 |
| 44 | 0.852055189571598 | 0.295889620856804 | 0.147944810428402 |
| 45 | 0.825669594958842 | 0.348660810082316 | 0.174330405041158 |
| 46 | 0.835235200016811 | 0.329529599966378 | 0.164764799983189 |
| 47 | 0.7833011048881 | 0.433397790223801 | 0.216698895111901 |
| 48 | 0.73710903109139 | 0.525781937817221 | 0.262890968908610 |
| 49 | 0.648244348992552 | 0.703511302014897 | 0.351755651007448 |
| 50 | 0.552984146223902 | 0.894031707552195 | 0.447015853776098 |
| 51 | 0.55421365241074 | 0.891572695178521 | 0.445786347589260 |
| 52 | 0.984530393589052 | 0.0309392128218952 | 0.0154696064109476 |
| 53 | 0.966484151861137 | 0.0670316962777266 | 0.0335158481388633 |
| 54 | 0.951062579678392 | 0.0978748406432165 | 0.0489374203216082 |
| 55 | 0.892635205406853 | 0.214729589186294 | 0.107364794593147 |
| Meta Analysis of Goldfeld-Quandt test for Heteroskedasticity | |||
| Description | # significant tests | % significant tests | OK/NOK |
| 1% type I error level | 0 | 0 | OK |
| 5% type I error level | 1 | 0.02 | OK |
| 10% type I error level | 3 | 0.06 | OK |