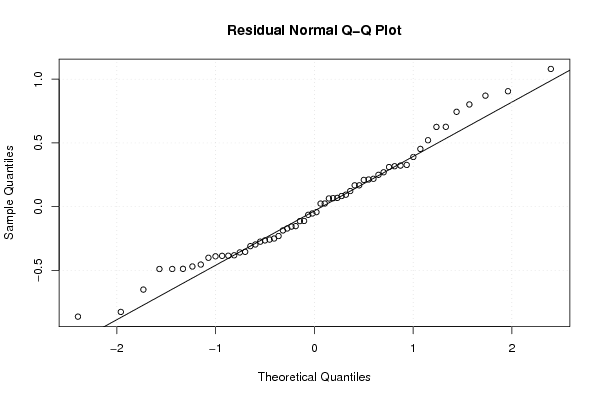
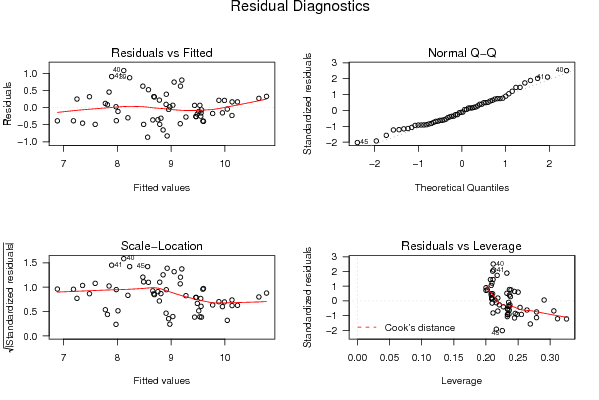
| Multiple Linear Regression - Estimated Regression Equation |
| WLVrouw[t] = + 4.27824764466338 + 0.7361871878754WLMan[t] -0.161515411368572M1[t] -0.169408779657346M2[t] -0.244788454128544M3[t] -0.405444384842235M4[t] -0.460824059313433M5[t] -0.190927477542139M6[t] + 0.518361816473883M7[t] + 0.786297216912588M8[t] + 0.593127592381327M9[t] + 0.323024174152621M10[t] + 0.039302037136374M11[t] -0.0226591441962139t + e[t] |
| Multiple Linear Regression - Ordinary Least Squares | |||||
| Variable | Parameter | S.D. | T-STAT H0: parameter = 0 | 2-tail p-value | 1-tail p-value |
| (Intercept) | 4.27824764466338 | 1.190597 | 3.5934 | 0.000792 | 0.000396 |
| WLMan | 0.7361871878754 | 0.145897 | 5.0459 | 8e-06 | 4e-06 |
| M1 | -0.161515411368572 | 0.311833 | -0.518 | 0.606973 | 0.303486 |
| M2 | -0.169408779657346 | 0.311101 | -0.5445 | 0.588696 | 0.294348 |
| M3 | -0.244788454128544 | 0.308421 | -0.7937 | 0.431456 | 0.215728 |
| M4 | -0.405444384842235 | 0.308572 | -1.3139 | 0.195382 | 0.097691 |
| M5 | -0.460824059313433 | 0.311452 | -1.4796 | 0.145797 | 0.072899 |
| M6 | -0.190927477542139 | 0.316203 | -0.6038 | 0.548934 | 0.274467 |
| M7 | 0.518361816473883 | 0.307008 | 1.6884 | 0.098098 | 0.049049 |
| M8 | 0.786297216912588 | 0.306859 | 2.5624 | 0.013734 | 0.006867 |
| M9 | 0.593127592381327 | 0.306653 | 1.9342 | 0.059254 | 0.029627 |
| M10 | 0.323024174152621 | 0.307551 | 1.0503 | 0.299062 | 0.149531 |
| M11 | 0.039302037136374 | 0.308558 | 0.1274 | 0.8992 | 0.4496 |
| t | -0.0226591441962139 | 0.005221 | -4.3397 | 7.7e-05 | 3.9e-05 |
| Multiple Linear Regression - Regression Statistics | |
| Multiple R | 0.900983958337249 |
| R-squared | 0.811772093181057 |
| Adjusted R-squared | 0.758577249949617 |
| F-TEST (value) | 15.2603531445557 |
| F-TEST (DF numerator) | 13 |
| F-TEST (DF denominator) | 46 |
| p-value | 1.53033141714332e-12 |
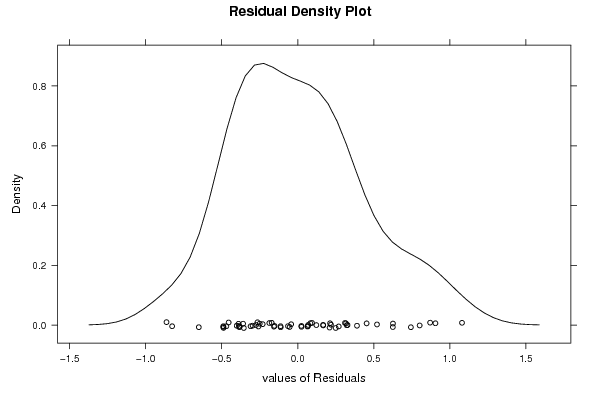
| Multiple Linear Regression - Residual Statistics | |
| Residual Standard Deviation | 0.484544056241358 |
| Sum Squared Residuals | 10.8000153521861 |
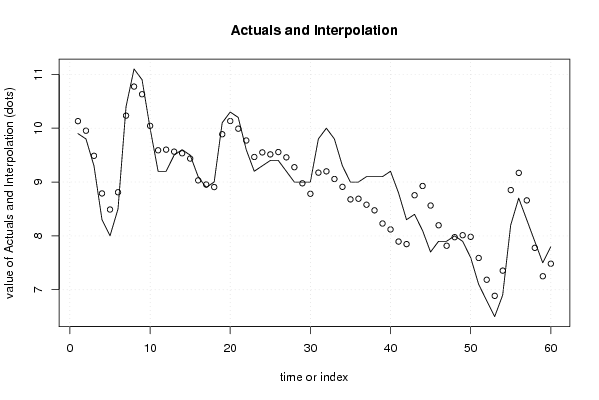
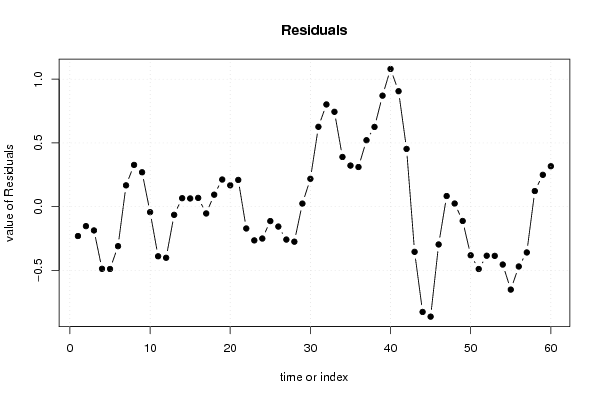
| Multiple Linear Regression - Actuals, Interpolation, and Residuals | |||
| Time or Index | Actuals | Interpolation Forecast | Residuals Prediction Error |
| 1 | 9.9 | 10.1308080296768 | -0.230808029676850 |
| 2 | 9.8 | 9.9530180796168 | -0.153018079616801 |
| 3 | 9.3 | 9.48688566701169 | -0.186885667011687 |
| 4 | 8.3 | 8.788239560589 | -0.488239560589004 |
| 5 | 8 | 8.48934458555897 | -0.489344585558973 |
| 6 | 8.5 | 8.8102007419216 | -0.310200741921593 |
| 7 | 10.4 | 10.2330180796168 | 0.166981920383200 |
| 8 | 11.1 | 10.7727692110095 | 0.327230788990547 |
| 9 | 10.9 | 10.6305591610695 | 0.269440838930484 |
| 10 | 10 | 10.0433217234944 | -0.0433217234944362 |
| 11 | 9.2 | 9.5897030047069 | -0.389703004706897 |
| 12 | 9.2 | 9.60136054216185 | -0.401360542161849 |
| 13 | 9.5 | 9.56442342417214 | -0.064423424172142 |
| 14 | 9.6 | 9.53387091168715 | 0.0661290883128454 |
| 15 | 9.5 | 9.43583209301974 | 0.0641679069802581 |
| 16 | 9.1 | 9.03166086174722 | 0.0683391382527815 |
| 17 | 8.9 | 8.9536220430798 | -0.0536220430798058 |
| 18 | 9 | 8.90638460550473 | 0.0936153944952737 |
| 19 | 10.1 | 9.8874896304747 | 0.212510369525305 |
| 20 | 10.3 | 10.1327658867172 | 0.167234113282815 |
| 21 | 10.2 | 9.99055583677725 | 0.209444163222749 |
| 22 | 9.6 | 9.77141199313987 | -0.171411993139870 |
| 23 | 9.2 | 9.46503071192741 | -0.265030711927410 |
| 24 | 9.3 | 9.5503069681699 | -0.250306968169901 |
| 25 | 9.4 | 9.5133698501802 | -0.113369850180195 |
| 26 | 9.4 | 9.55643605648275 | -0.156436056482747 |
| 27 | 9.2 | 9.45839723781534 | -0.258397237815336 |
| 28 | 9 | 9.27508216290543 | -0.275082162905431 |
| 29 | 9 | 8.9761871878754 | 0.0238128121246005 |
| 30 | 9 | 8.78171231272524 | 0.21828768727476 |
| 31 | 9.8 | 9.17386758739489 | 0.626132412605112 |
| 32 | 10 | 9.19828768727476 | 0.80171231272524 |
| 33 | 9.8 | 9.05607763733483 | 0.743922362665176 |
| 34 | 9.3 | 8.91055251248499 | 0.389447487515016 |
| 35 | 9 | 8.67778995006006 | 0.322210049939937 |
| 36 | 9 | 8.68944748751502 | 0.310552512484984 |
| 37 | 9.1 | 8.57889165073777 | 0.52110834926223 |
| 38 | 9.1 | 8.47472041946524 | 0.625279580534758 |
| 39 | 9.1 | 8.22944416322275 | 0.87055583677725 |
| 40 | 9.2 | 8.11974780710039 | 1.08025219289961 |
| 41 | 8.8 | 7.8944715508579 | 0.905528449142107 |
| 42 | 8.3 | 7.84723411328281 | 0.452765886717186 |
| 43 | 8.4 | 8.75472041946524 | -0.354720419465242 |
| 44 | 8.1 | 8.9263779569202 | -0.826377956920194 |
| 45 | 7.7 | 8.56331175061764 | -0.863311750617638 |
| 46 | 7.9 | 8.19693046940518 | -0.296930469405178 |
| 47 | 7.9 | 7.81693046940518 | 0.0830695305948227 |
| 48 | 8 | 7.97582544443521 | 0.0241745555647900 |
| 49 | 7.9 | 8.01250704523304 | -0.112507045233043 |
| 50 | 7.6 | 7.98195453274806 | -0.381954532748056 |
| 51 | 7.1 | 7.58944083893048 | -0.489440838930484 |
| 52 | 6.8 | 7.18526960765796 | -0.38526960765796 |
| 53 | 6.5 | 6.88637463262793 | -0.386374632627928 |
| 54 | 6.9 | 7.35446822656563 | -0.454468226565628 |
| 55 | 8.2 | 8.85090428304838 | -0.650904283048376 |
| 56 | 8.7 | 9.1697992580784 | -0.469799258078408 |
| 57 | 8.3 | 8.65949561420077 | -0.359495614200771 |
| 58 | 7.9 | 7.77778330147553 | 0.122216698524469 |
| 59 | 7.5 | 7.25054586390045 | 0.249454136099548 |
| 60 | 7.8 | 7.48305955771802 | 0.316940442281976 |
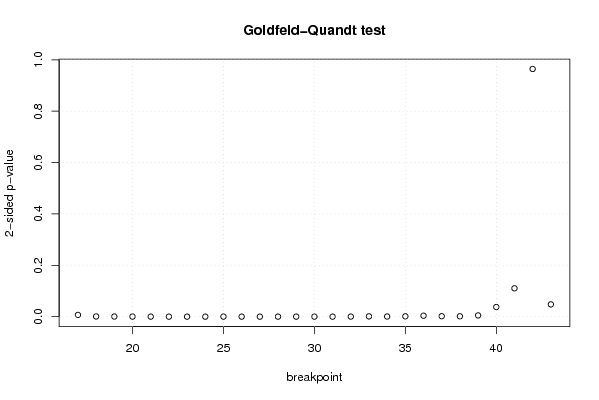
| Goldfeld-Quandt test for Heteroskedasticity | |||
| p-values | Alternative Hypothesis | ||
| breakpoint index | greater | 2-sided | less |
| 17 | 0.0033584772096027 | 0.0067169544192054 | 0.996641522790397 |
| 18 | 0.000385199316939106 | 0.000770398633878212 | 0.99961480068306 |
| 19 | 0.00021265183350146 | 0.00042530366700292 | 0.999787348166499 |
| 20 | 0.000120244708648372 | 0.000240489417296744 | 0.999879755291352 |
| 21 | 1.93117964550586e-05 | 3.86235929101171e-05 | 0.999980688203545 |
| 22 | 2.98791729495879e-05 | 5.97583458991757e-05 | 0.99997012082705 |
| 23 | 7.60636974065905e-06 | 1.52127394813181e-05 | 0.99999239363026 |
| 24 | 2.16031006069256e-06 | 4.32062012138513e-06 | 0.99999783968994 |
| 25 | 1.11548722344000e-06 | 2.23097444688000e-06 | 0.999998884512777 |
| 26 | 4.04438683342522e-06 | 8.08877366685045e-06 | 0.999995955613167 |
| 27 | 2.14488980810463e-05 | 4.28977961620927e-05 | 0.99997855110192 |
| 28 | 3.93670073080929e-05 | 7.87340146161857e-05 | 0.999960632992692 |
| 29 | 2.50778606514929e-05 | 5.01557213029857e-05 | 0.999974922139349 |
| 30 | 1.58133768155014e-05 | 3.16267536310027e-05 | 0.999984186623184 |
| 31 | 3.37058194846855e-05 | 6.74116389693711e-05 | 0.999966294180515 |
| 32 | 0.000163952746605359 | 0.000327905493210718 | 0.999836047253395 |
| 33 | 0.00051765396794552 | 0.00103530793589104 | 0.999482346032055 |
| 34 | 0.000259985529153302 | 0.000519971058306605 | 0.999740014470847 |
| 35 | 0.000651179663465875 | 0.00130235932693175 | 0.999348820336534 |
| 36 | 0.00184501008694775 | 0.0036900201738955 | 0.998154989913052 |
| 37 | 0.000875077375232503 | 0.00175015475046501 | 0.999124922624767 |
| 38 | 0.000704481702071704 | 0.00140896340414341 | 0.999295518297928 |
| 39 | 0.00241934776545065 | 0.0048386955309013 | 0.99758065223455 |
| 40 | 0.0187737820619402 | 0.0375475641238804 | 0.98122621793806 |
| 41 | 0.0551927745559891 | 0.110385549111978 | 0.94480722544401 |
| 42 | 0.482194177395765 | 0.96438835479153 | 0.517805822604235 |
| 43 | 0.97610651429364 | 0.0477869714127193 | 0.0238934857063597 |
| Meta Analysis of Goldfeld-Quandt test for Heteroskedasticity | |||
| Description | # significant tests | % significant tests | OK/NOK |
| 1% type I error level | 23 | 0.851851851851852 | NOK |
| 5% type I error level | 25 | 0.925925925925926 | NOK |
| 10% type I error level | 25 | 0.925925925925926 | NOK |